. 2020 Nov 11;28(5):712-723.e9.
doi: 10.1016/j.chom.2020.09.014. Epub 2020 Oct 27.

RTP4 Is a Potent IFN-Inducible Anti-flavivirus Effector Engaged in a Host-Virus Arms Race in Bats and Other Mammals

Affiliations

RTP4 Is a Potent IFN-Inducible Anti-flavivirus Effector Engaged in a Host-Virus Arms Race in Bats and Other Mammals

Ian N Boys et al. Cell Host Microbe. .

Abstract

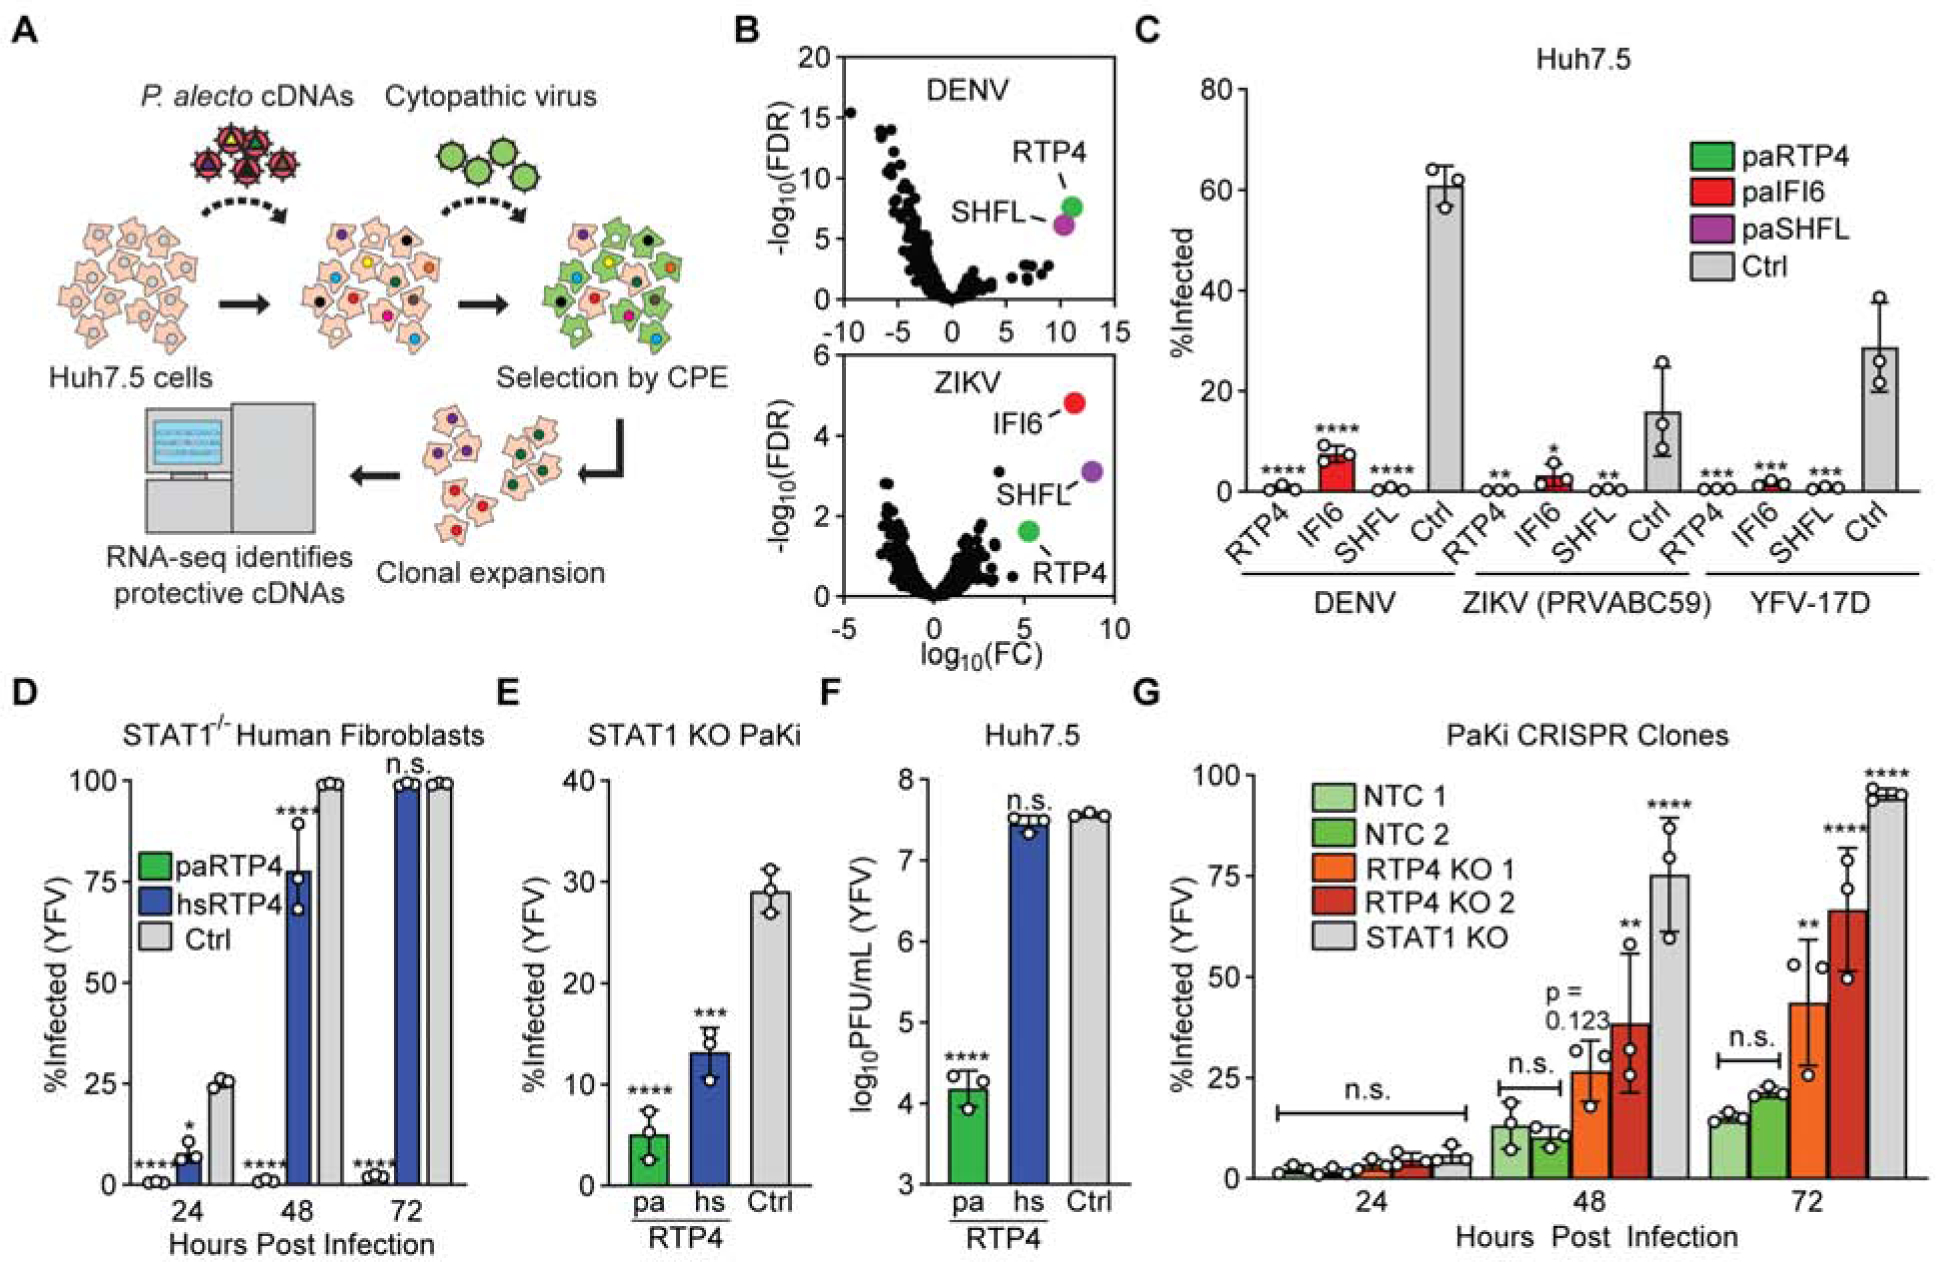
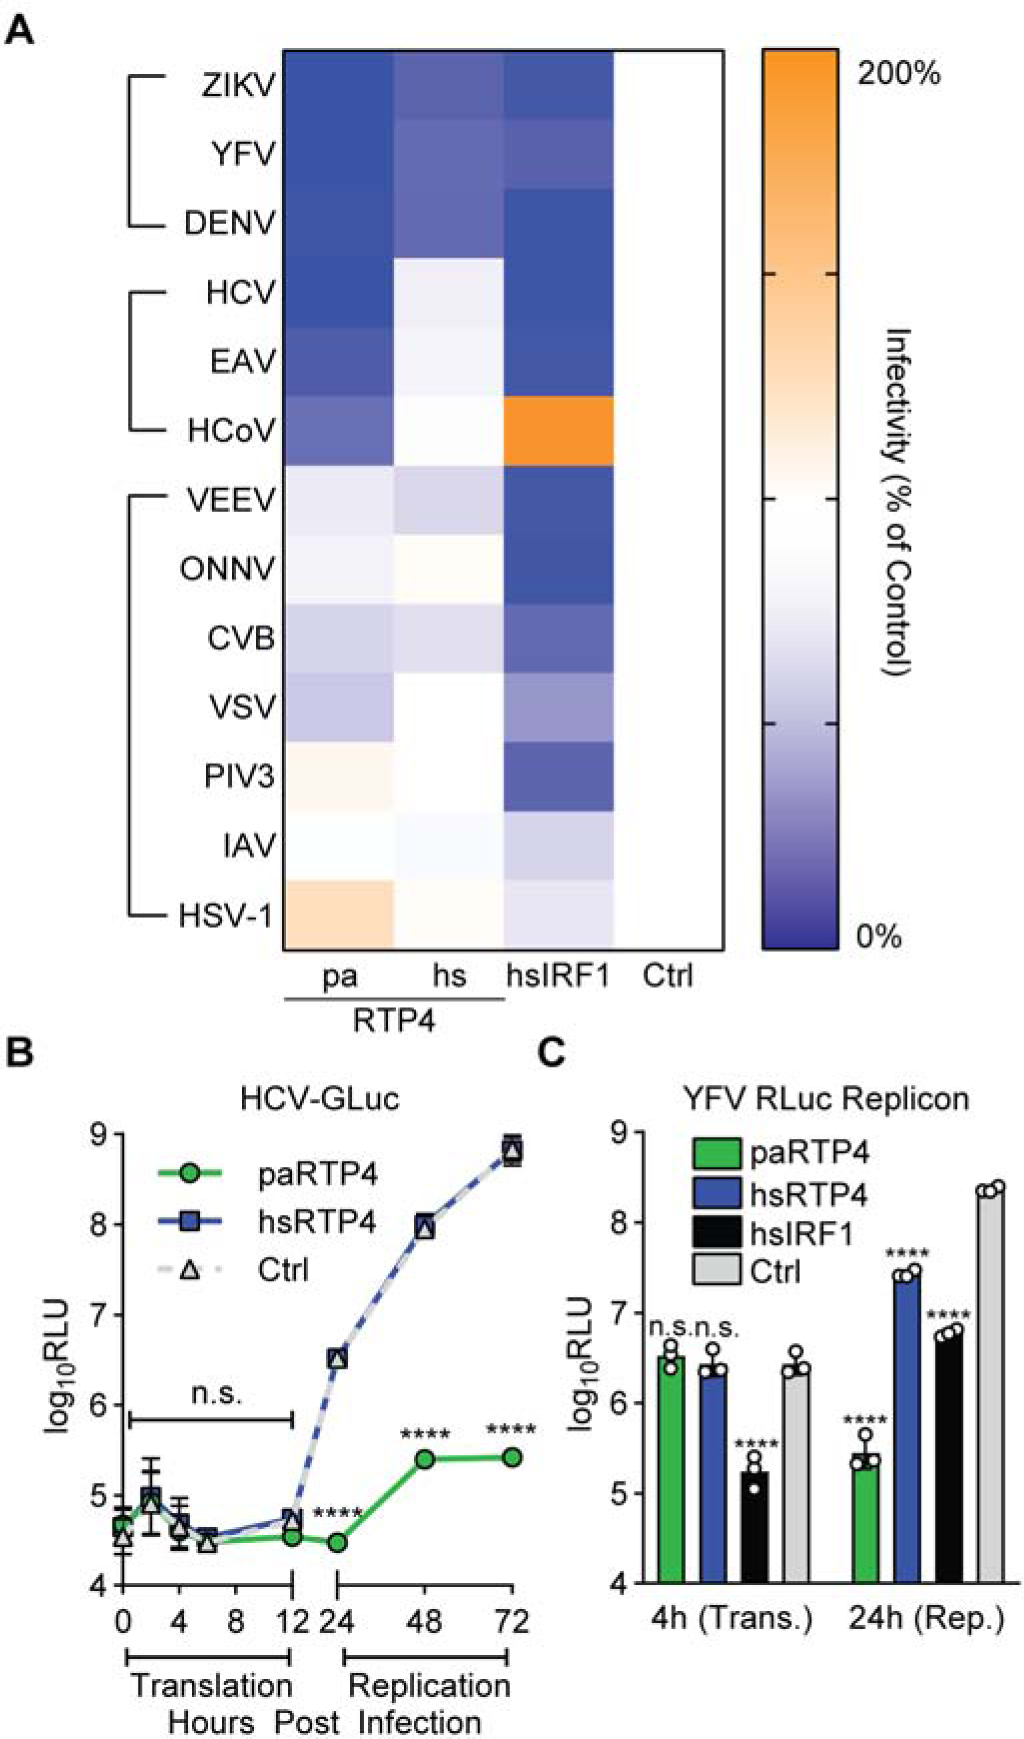
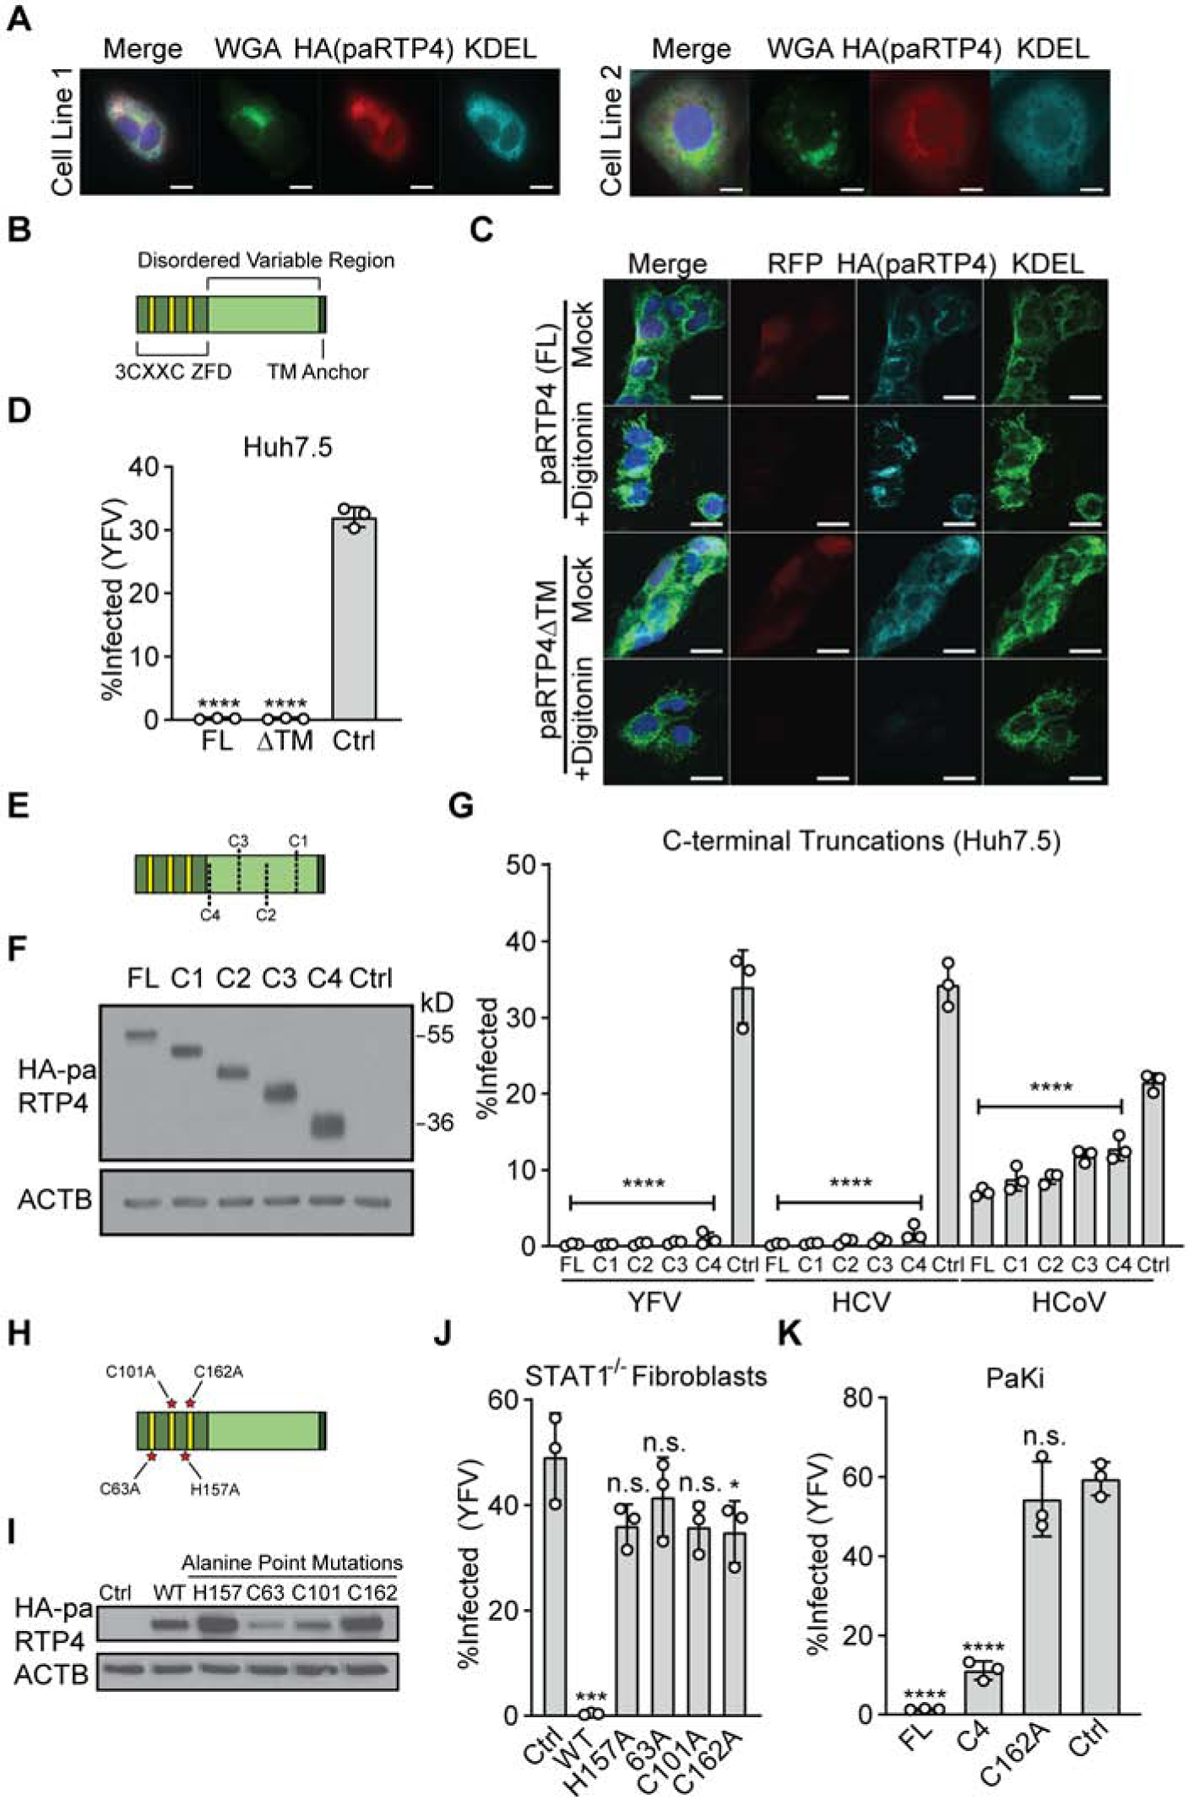
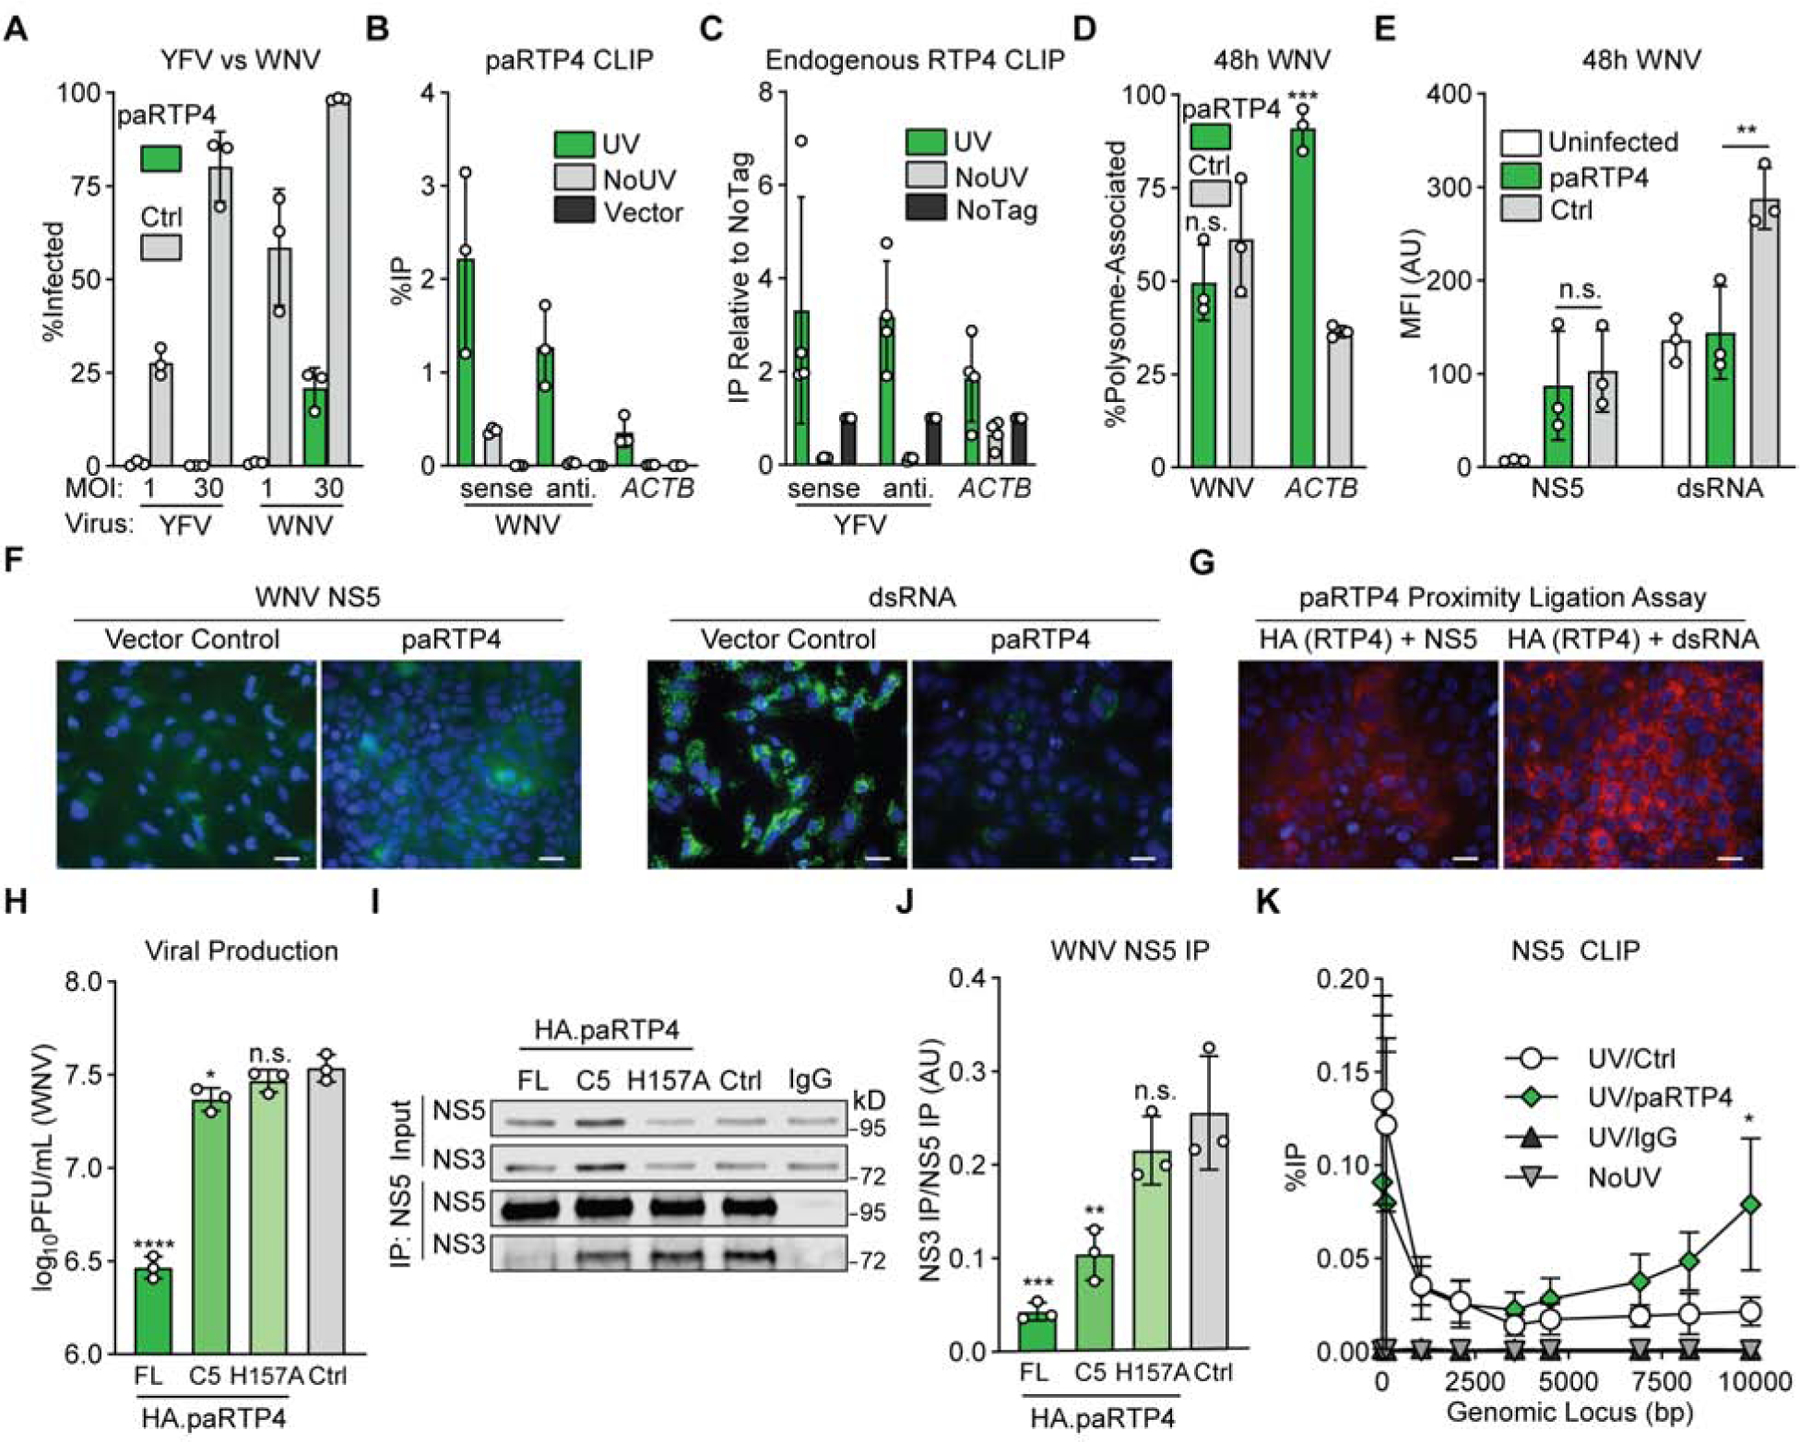
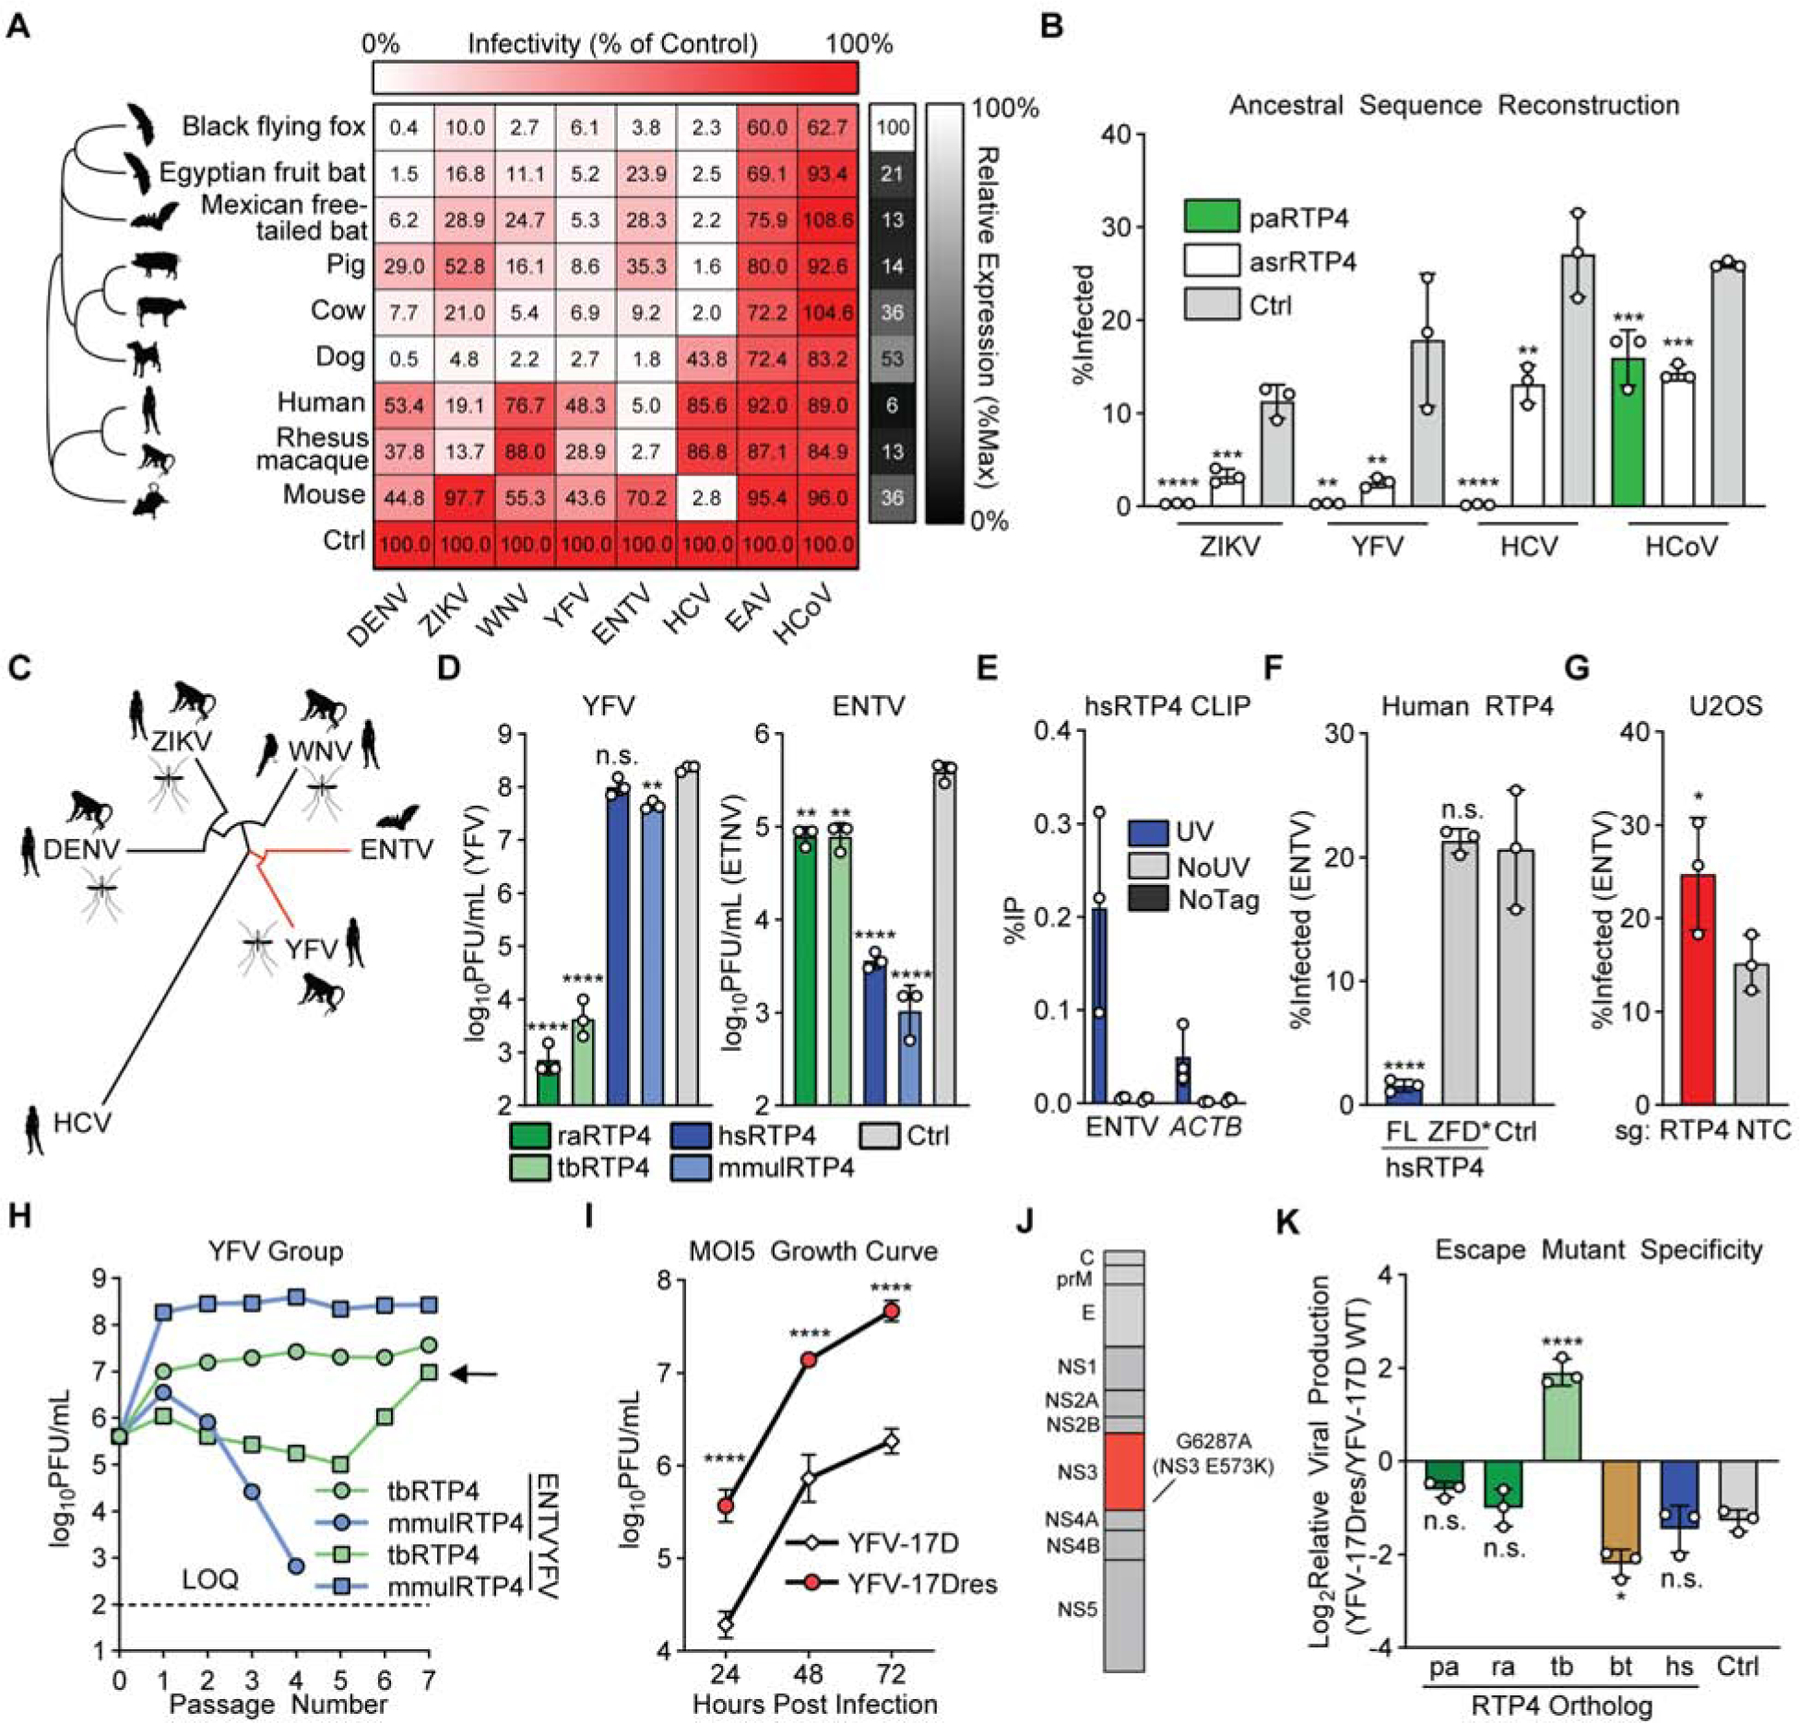
Among mammals, bats are particularly rich in zoonotic viruses, including flaviviruses. Certain bat species can be productively yet asymptomatically infected with viruses that cause overt disease in other species. However, little is known about the antiviral effector repertoire in bats relative to other mammals. Here, we report the black flying fox receptor transporter protein 4 (RTP4) as a potent interferon (IFN)-inducible inhibitor of human pathogens in the Flaviviridae family, including Zika, West Nile, and hepatitis C viruses. Mechanistically, RTP4 associates with the flavivirus replicase, binds viral RNA, and suppresses viral genome amplification. Comparative approaches revealed that RTP4 undergoes positive selection, that a flavivirus can mutate to escape RTP4-imposed restriction, and that diverse mammalian RTP4 orthologs exhibit striking patterns of specificity against distinct Flaviviridae members. Our findings reveal an antiviral mechanism that has likely adapted over 100 million years of mammalian evolution to accommodate unique host-virus genetic conflicts.

Keywords: antiviral immunity; bats; evolution; flavivirus; genetic arms race; interferon; restriction factor; virus-host interactions.


Conflict of interest statement

Declaration of Interests The authors declare no competing interests.

Figures

Figure 1:
Figure 1:. Black flying fox RTP4 restricts flavivirus infection
a) cDNA library screening pipeline. Related data: Supplemental Table 1, Supplemental Figure 1A. b) Results of triplicate DENV and ZIKV screens. Related data: Supplemental Document 1 c) Huh7.5 cells expressing black flying fox RTP4, IFI6, or SHFL were infected with DENV, ZIKV (PRVABC59), and YFV-17D-Venus (YFV-Venus) for 24 (YFV, ZIKV) or 48 (DENV) hours. Bars: mean ± SD of N = 3 biological replicates. One-way ANOVA with Dunnett’s test. d) STAT1−/− human fibroblasts transduced with lentiviral pseudoparticles encoding paRTP4, hsRTP4, or firefly luciferase (Fluc) were infected with YFV-Venus for 24, 48, and 72h. Bars: mean ± SD of N = 3 biological replicates. Two-way ANOVA with Holm-Sidak test. e) AAV-transduced STAT1 KO PaKi cells were infected with YFV-Venus for 24h. Bars: mean ± SD of N = 3 biological replicates. One-way ANOVA with Dunnett’s test. f) Huh7.5 cells expressing paRTP4, hsRTP4, or a vector control were infected with YFV-17D (MOI of 10) for 24h. Quantification by plaque assay. Bars: mean ± SD of N = 3 biological replicates. One-way ANOVA on log-transformed data with Dunnett’s test. g) CRISPR RTP4 KO PaKi clones were infected with YFV-Venus (MOI of 0.05). Bars: mean ± SD of N = 3 biological replicates. All statistics relative to NT.1. Two-way ANOVA with Holm-Sidak test.
Figure 2:
Figure 2:. RTP4 restricts the replication of viruses that replicate at the ER
a) Relative infectivity of cells expressing paRTP4, hsRTP4, hsIRF1, or an empty vector. Heatmap cells represent the mean of N = 3 biological replicates, normalized to control. Raw infectivity and experimental details: Supplemental Figure 2. b) HCV-GLuc infection of Huh7.5 cells expressing paRTP4, hsRTP4, or a vector control. Points indicate the mean ± SD Relative Light Units (RLU) of N = 3 biological replicates. RM ANOVA on log-transformed data with Holm-Sidak test. c) Huh7.5 cells expressing paRTP4, hsRTP4, hsIRF1, or vector control were transfected with YFRluc2a replicon RNA. Bars: mean ± SD RLU of N = 3 biological replicates. Two-way ANOVA on log-transformed data with Holm-Sidak test.
Figure 3:
Figure 3:. The 3CXXC zinc finger domain of black flying fox RTP4 is necessary and sufficient for antiviral activity
a) Endogenous RTP4 bearing a gene-edited HA epitope tag was detected in PaKi cells by tyramide signal amplification following treatment with 100U/mL IFN for 8h. Representative images of N = 3 biological replicates for two clonal cell lines. Linear adjustments were made to all channels separately. Scale bar: 10μm. b) Cartoon depicting the 3CXXC zinc finger domain (ZFD), disordered variable region, and transmembrane (TM) anchor of paRTP4. c) Huh7.5 cells expressing HA.paRTP4 or HA.paRTP4ΔTM were treated with digitonin prior to fixation. Cells were stained with antibodies against HA or KDEL. Co-expressed RFP serves as a control for untethered cytosolic contents and KDEL serves as a control for membrane-bound proteins. Scale bar: 20μm. d) Huh7.5 cells expressing HA.paRTP4ΔTM, full-length HA.paRTP4, or a vector control were infected with YFV-Venus for 24h. Bars: mean ± SD of N = 3 biological replicates. One-way ANOVA with Dunnett’s test. e) Cartoon depicting serial C-terminal truncations of RTP4. C1:Δ56; C2:Δ106; C3:Δ156; C4:Δ206. f) Representative western blot (N = 3) of Huh7.5 cells expressing HA-tagged C-terminal truncations or full-length (FL) paRTP4. g) Huh7.5 cells expressing the indicated constructs were infected with YFV-Venus (24h), HCV (48h), or HCoV-OC43 (24h). Bars: mean ± SD of N = 3 biological replicates. One-way ANOVA with Dunnett’s test. h) Cartoon depicting ZFD-directed point mutations of RTP4. i) Western blot (N = 1) of STAT1−/− fibroblasts transduced with the indicated HA-tagged constructs. j) STAT1−/− fibroblasts transduced with the indicated constructs were infected with YFV-Venus. Bars: mean ± SD of N = 3 biological replicates. One-way ANOVA with Dunnett’s test. k) PaKi cells expressing the indicated constructs were infected with YFV-Venus. Bars: mean ± SD of N = 3 biological replicates. One-way ANOVA with Dunnett’s test.
Figure 4:
Figure 4:. Black flying fox RTP4 binds replicating viral RNA and suppresses viral genome amplification
a) Huh7.5 cells expressing HA.paRTP4 or a vector control were infected with WNV or YFV-17D (MOI of 1 or 30) and harvested at 24h. Bars: mean ± SD of N = 3 biological replicates. Related data: Supplemental Figure 4A b) Huh7.5 cells expressing HA.paRTP4 or a vector control were infected with WNV (MOI of 30) for 48h. CLIP-qPCR identified RNA bound by RTP4. UV: UV crosslinked HA.paRTP4 cells. NoUV: non-crosslinked HA.paRTP4 cells. Vector: UV crosslinked vector control cells. Bars: mean ± SD of N = 3 biological replicates. Related data: Supplemental Figure 4B–C c) PaKi cells were infected with YFV-17D (MOI of 5) for 48h. CLIP-qPCR identified RNA bound by HA.paRTP4. UV: crosslinked endogenously-tagged cells. NoUV: non-crosslinked endogenously-tagged cells. NoTag: crosslinked wild-type cells. Bars: mean ± SD of N = 4 biological replicates. d) Polysome association of WNV vRNA and ACTB in Huh7.5 cells expressing HA.paRTP4 or a vector control infected with WNV (MOI of 30) for 48h. Bars: mean ± SD of N = 3 biological replicates. Two-way ANOVA with Holm-Sidak test. Related data: Supplemental Figure 4D e) Huh7.5 cells expressing HA.paRTP4 or FLuc as a negative control were infected with WNV (MOI of 30) for 48 hours. NS5 and dsRNA levels were quantified by flow cytometry. Bars: mean ± SD of N = 3 biological replicates. Two-way ANOVA with Holm-Sidak test. f) Huh7.5 cells expressing HA.paRTP4 or a vector control were infected with WNV (MOI of 30) for 48 hours. NS5 and dsRNA levels were visualized by immunofluorescence microscopy. Representative image of N = 3 biological replicates. Scale bar: 30μm. g) Huh7.5 cells expressing HA.paRTP4 were infected with WNV (MOI of 30) for 48 hours. A proximity ligation assay was performed for HA and either NS5 or dsRNA. Representative image of N = 2 biological replicates. Scale bar: 30μm. Related data (PLA controls): Supplemental Figure 4E. h) Huh7.5 cells expressing the indicated paRTP4 constructs were infected with WNV (MOI of 30) for 48 hours. Quantification by plaque assay. Bars: mean ± SD of N = 3 biological replicates. One-way ANOVA with Dunnett’s test performed on log-transformed data. i) Huh7.5 cells expressing the indicated paRTP4 constructs were infected with WNV (MOI of 30) for 48h. WNV NS5 was immunoprecipitated and quantitative western blotting was performed using a Li-COR imager. Representative blot of N = 3 biological replicates. j) Quantification of (I) showing the co-immunoprecipitation of NS3 by NS5, normalized to NS5 pulldown efficiency. Bars: mean ± SD of N = 3 biological replicates. One-way ANOVA with Dunnett’s test. k) Huh7.5 cells expressing HA.paRTP4 or a vector control were infected with WNV (MOI of 30) for 48h. CLIP-qPCR with limited nuclease digestion identified the binding profile of NS5 on viral genomic RNA. UV/Ctrl: cross-linked vector control cells, IP NS5. UV/RTP4: crosslinked paRTP4-expressing cells, IP NS5. UV/IgG: crosslinked control cells, IP IgG. NoUV: non-crosslinked vector control cells, IP NS5. Bars: mean ± SD of N = 3 biological replicates. Two-way ANOVA with Holm-Sidak test.
Figure 5:
Figure 5:. RTP4 is a species-specific mammalian restriction factor
a) Huh7.5 cells expressing HA-tagged RTP4 orthologs or a vector control were infected with the indicated viruses. Large heatmap: Cells represent the mean infectivity of N = 3 biological replicates, normalized to within-replicate control. Small heatmap: Cells represent the mean protein expression of N = 3 biological replicates, relative to ACTB and normalized to within-replicate maximum expression. Raw infectivity data in Supplemental Table 2. b) Huh7.5 cells expressing paRTP4, asrRTP4 or a control were infected with the indicated viruses. Bars: mean ± SD of N = 3 biological replicates. One-way ANOVA with Dunnett’s test. c) Maximum-likelihood phylogenetic tree for polyprotein of flaviviruses screened in 5A. Common amplifying hosts are indicated by silhouettes. d) Huh7.5 cells expressing the indicated constructs were infected with YFV-17D and ENTV (MOI of 0.05) for 24h (ENTV) or 48h (YFV). Quantification by plaque assay. Bars: mean ± SD of N = 3 biological replicates. One-way ANOVA with Dunnett’s test performed on log-transformed data. e) Huh7.5 cells expressing either HA-tagged hsRTP4 or untagged hsRTP4 as a control were infected with ENTV (MOI of 5) for 24h. CLIP-qPCR identified RNA bound by RTP4. UV: UV-crosslinked HA.hsRTP4 cells. NoUV: non-crosslinked HA.hsRTP4 cells. NoTag: UV-crosslinked hsRTP4 cells. Bars: mean ± SD of N = 3 biological replicates. f) Huh7.5 cells expressing the indicated hsRTP4 constructs were infected with ENTV at an MOI of 0.5 for 16h. Bars: mean ± SD of N = 3 biological replicates. One-way ANOVA with Dunnett’s test. g) CRISPR-targeted U2OS cells were infected with ENTV (MOI of 2.5) for 24 hours. Bars: mean ± SD of N = 3 biological replicates. Paired two-tailed t-test. h) Cells expressing rhesus macaque (mmul) or Mexican free-tailed bat (tb) RTP4 were infected with ENTV or YFV-17D (MOI of 5). Supernatant was collected at 24h (ENTV) or 48h (YFV) and transferred to naive cells for seven passages. Quantification by plaque assay. Points represent N = 1 plaque assay. i) Huh7.5 cells expressing tbRTP4 were infected with YFV-17D or YFV-17Dresp (MOI of 5) for 72h. Quantification by plaque assay. Points indicate the mean ± SD of N = 3 biological replicates. Two-way ANOVA on log-transformed data with Holm-Sidak test j) Cartoon representing the YFV polyprotein. NS3 point mutation is indicated. k) Huh7.5 cells expressing the indicated RTP4 constructs or a vector control were infected with YFV-17D or YFV-17Dresc (MOI of 5) for 24h. Quantification by plaque assay. The ratio of viral production from wild-type YFV-17D and YFV-17Dresc is shown. Bars: mean ± SD of N = 3 biological replicates. One-way ANOVA with Dunnett’s test. Related data: Supplemental Figure 6J–K.

Comment in

Similar articles

Cited by

References

    1. Ahn M, Anderson DE, Zhang Q, Tan CW, Lim BL, Luko K, Wen M, Chia WN, Mani S, Wang LC, et al. (2019). Dampened NLRP3-mediated inflammation in bats and implications for a special viral reservoir host. Nat Microbiol 4, 789–799. - PMC - PubMed
    1. Ashkenazy H, Penn O, Doron-Faigenboim A, Cohen O, Cannarozzi G, Zomer O, and Pupko T (2012). FastML: a web server for probabilistic reconstruction of ancestral sequences. Nucleic Acids Res 40, W580–584. - PMC - PubMed
    1. Baker FB (1974). Stability of Two Hierarchical Grouping Techniques Case I: Sensitivity to Data Errors. Journal of the American Statistical Association 69, 440–445.
    1. Balinsky CA, Schmeisser H, Wells AI, Ganesan S, Jin T, Singh K, and Zoon KC (2017). IRAV (FLJ11286), an Interferon-Stimulated Gene with Antiviral Activity against Dengue Virus, Interacts with MOV10. J Virol 91. - PMC - PubMed
    1. Banerjee A, Zhang X, Yip A, Schulz KS, Irving AT, Bowdish D, Golding B, Wang LF, and Mossman K (2020). Positive Selection of a Serine Residue in Bat IRF3 Confers Enhanced Antiviral Protection. iScience 23, 100958. - PMC - PubMed

Publication types

MeSH terms