. 2020 Nov 25;183(5):1234-1248.e25.
doi: 10.1016/j.cell.2020.09.064. Epub 2020 Oct 27.

CNS-Native Myeloid Cells Drive Immune Suppression in the Brain Metastatic Niche through Cxcl10

Affiliations

CNS-Native Myeloid Cells Drive Immune Suppression in the Brain Metastatic Niche through Cxcl10

Ian H Guldner et al. Cell. .

Abstract

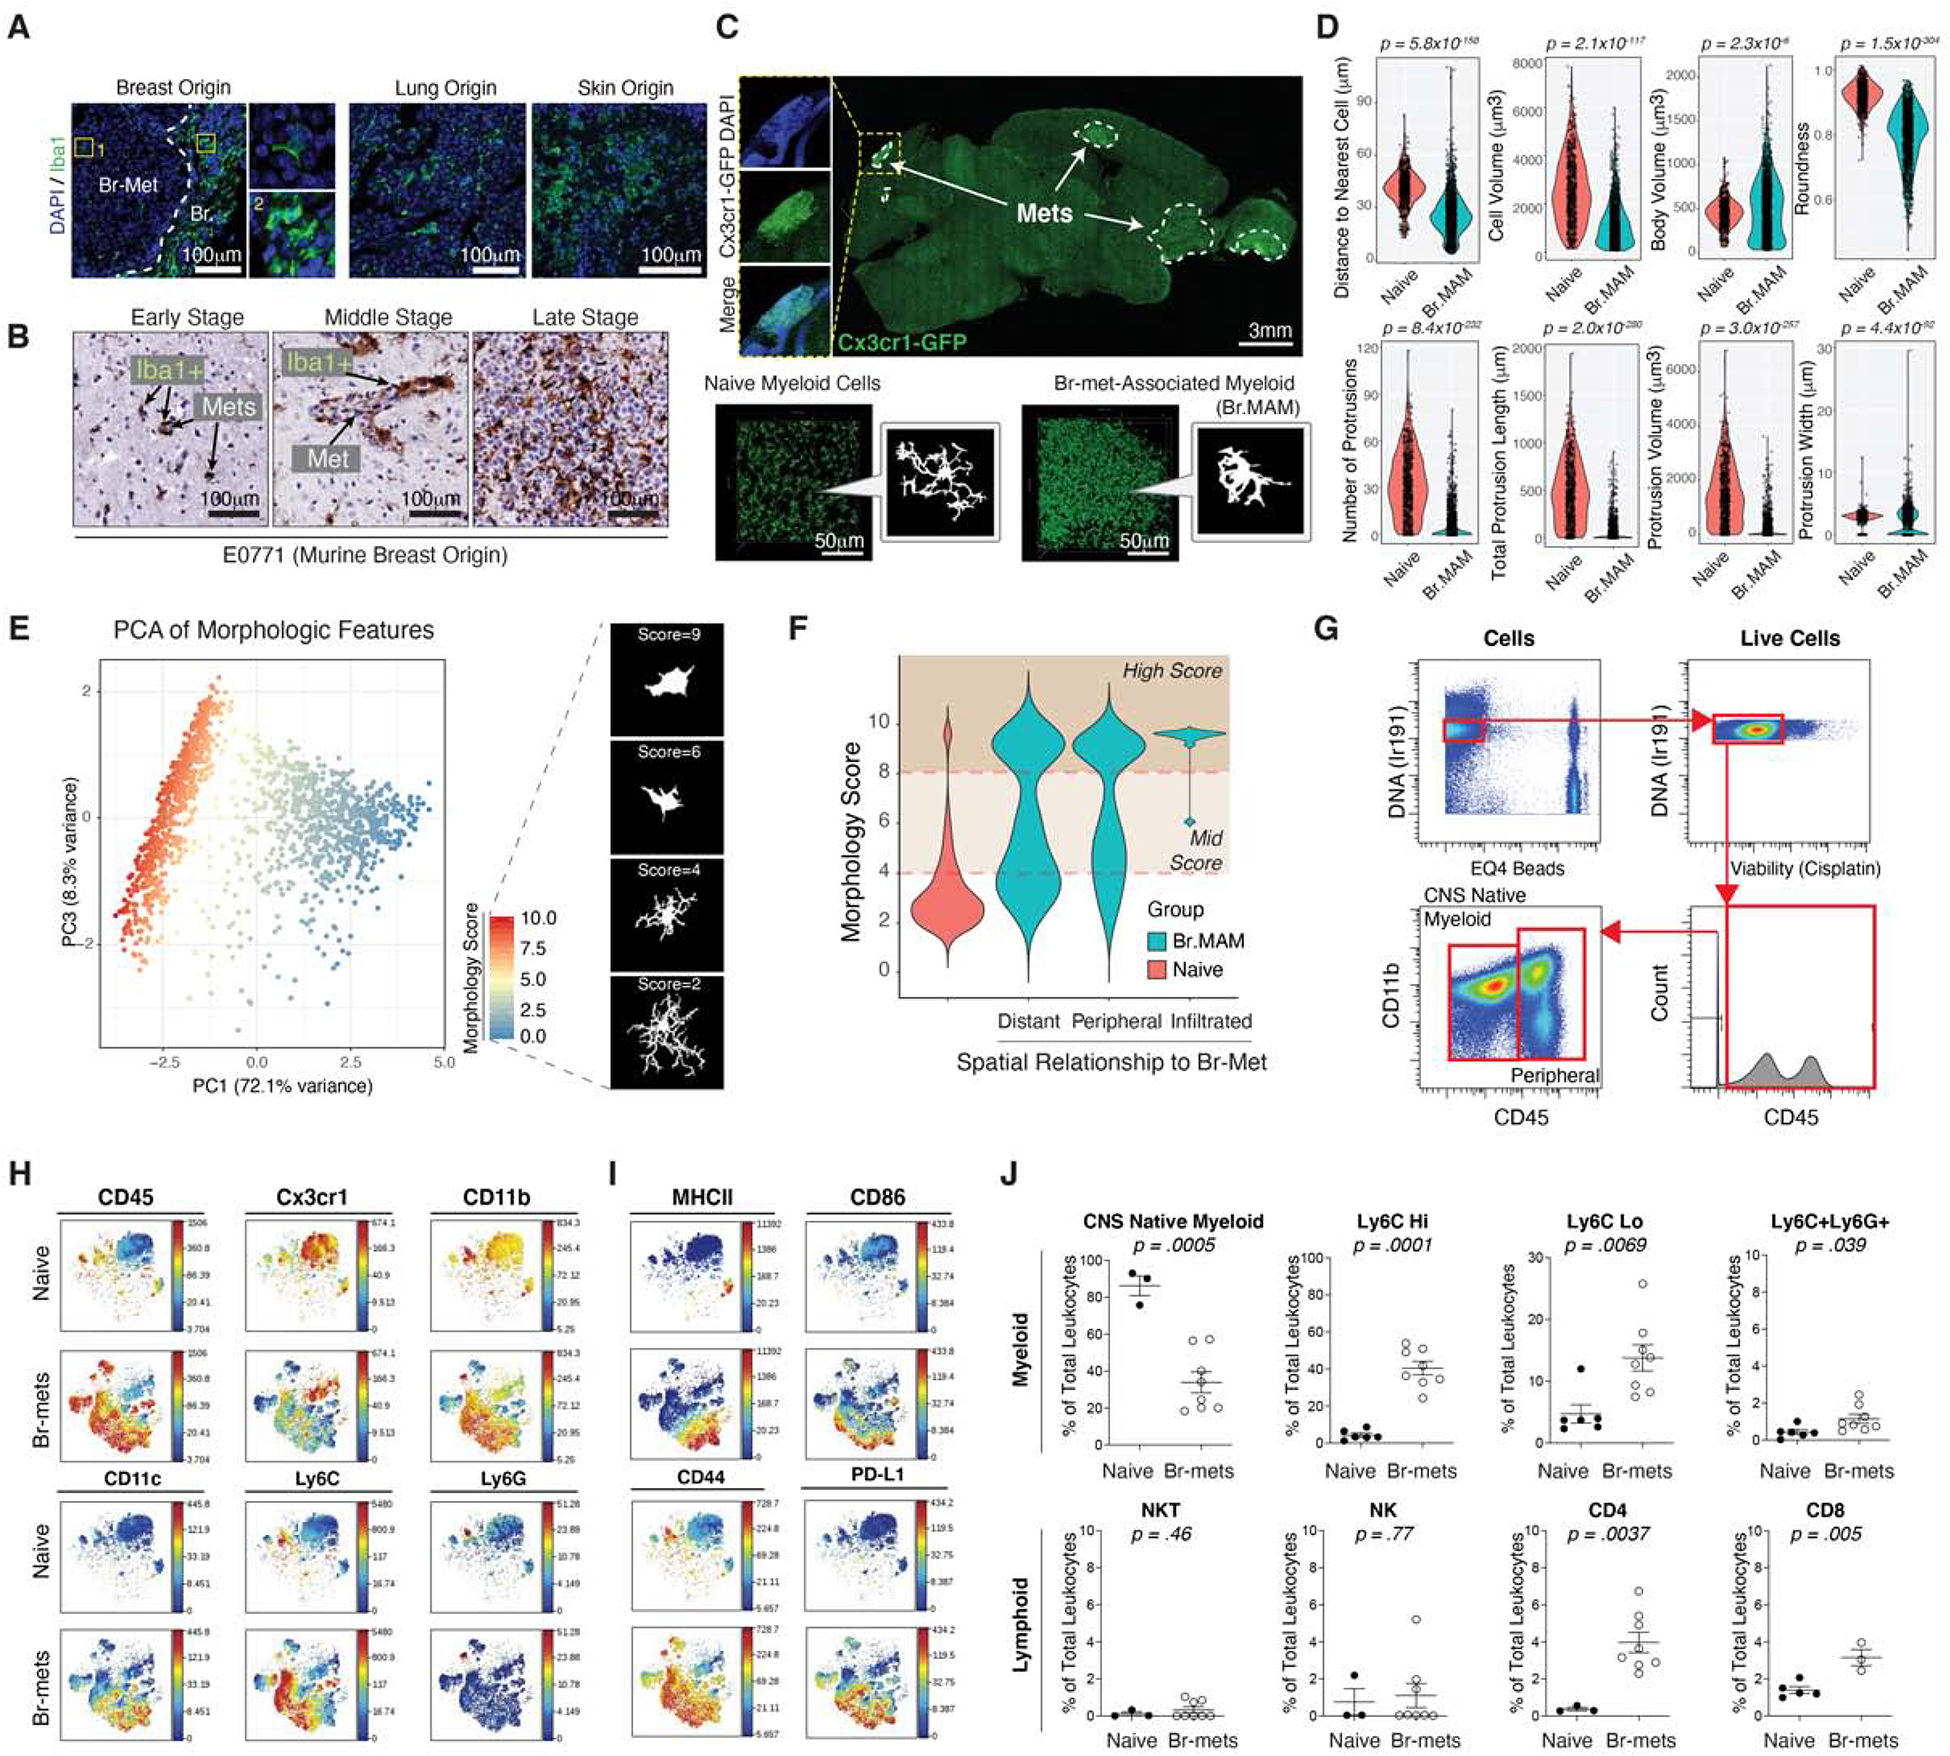
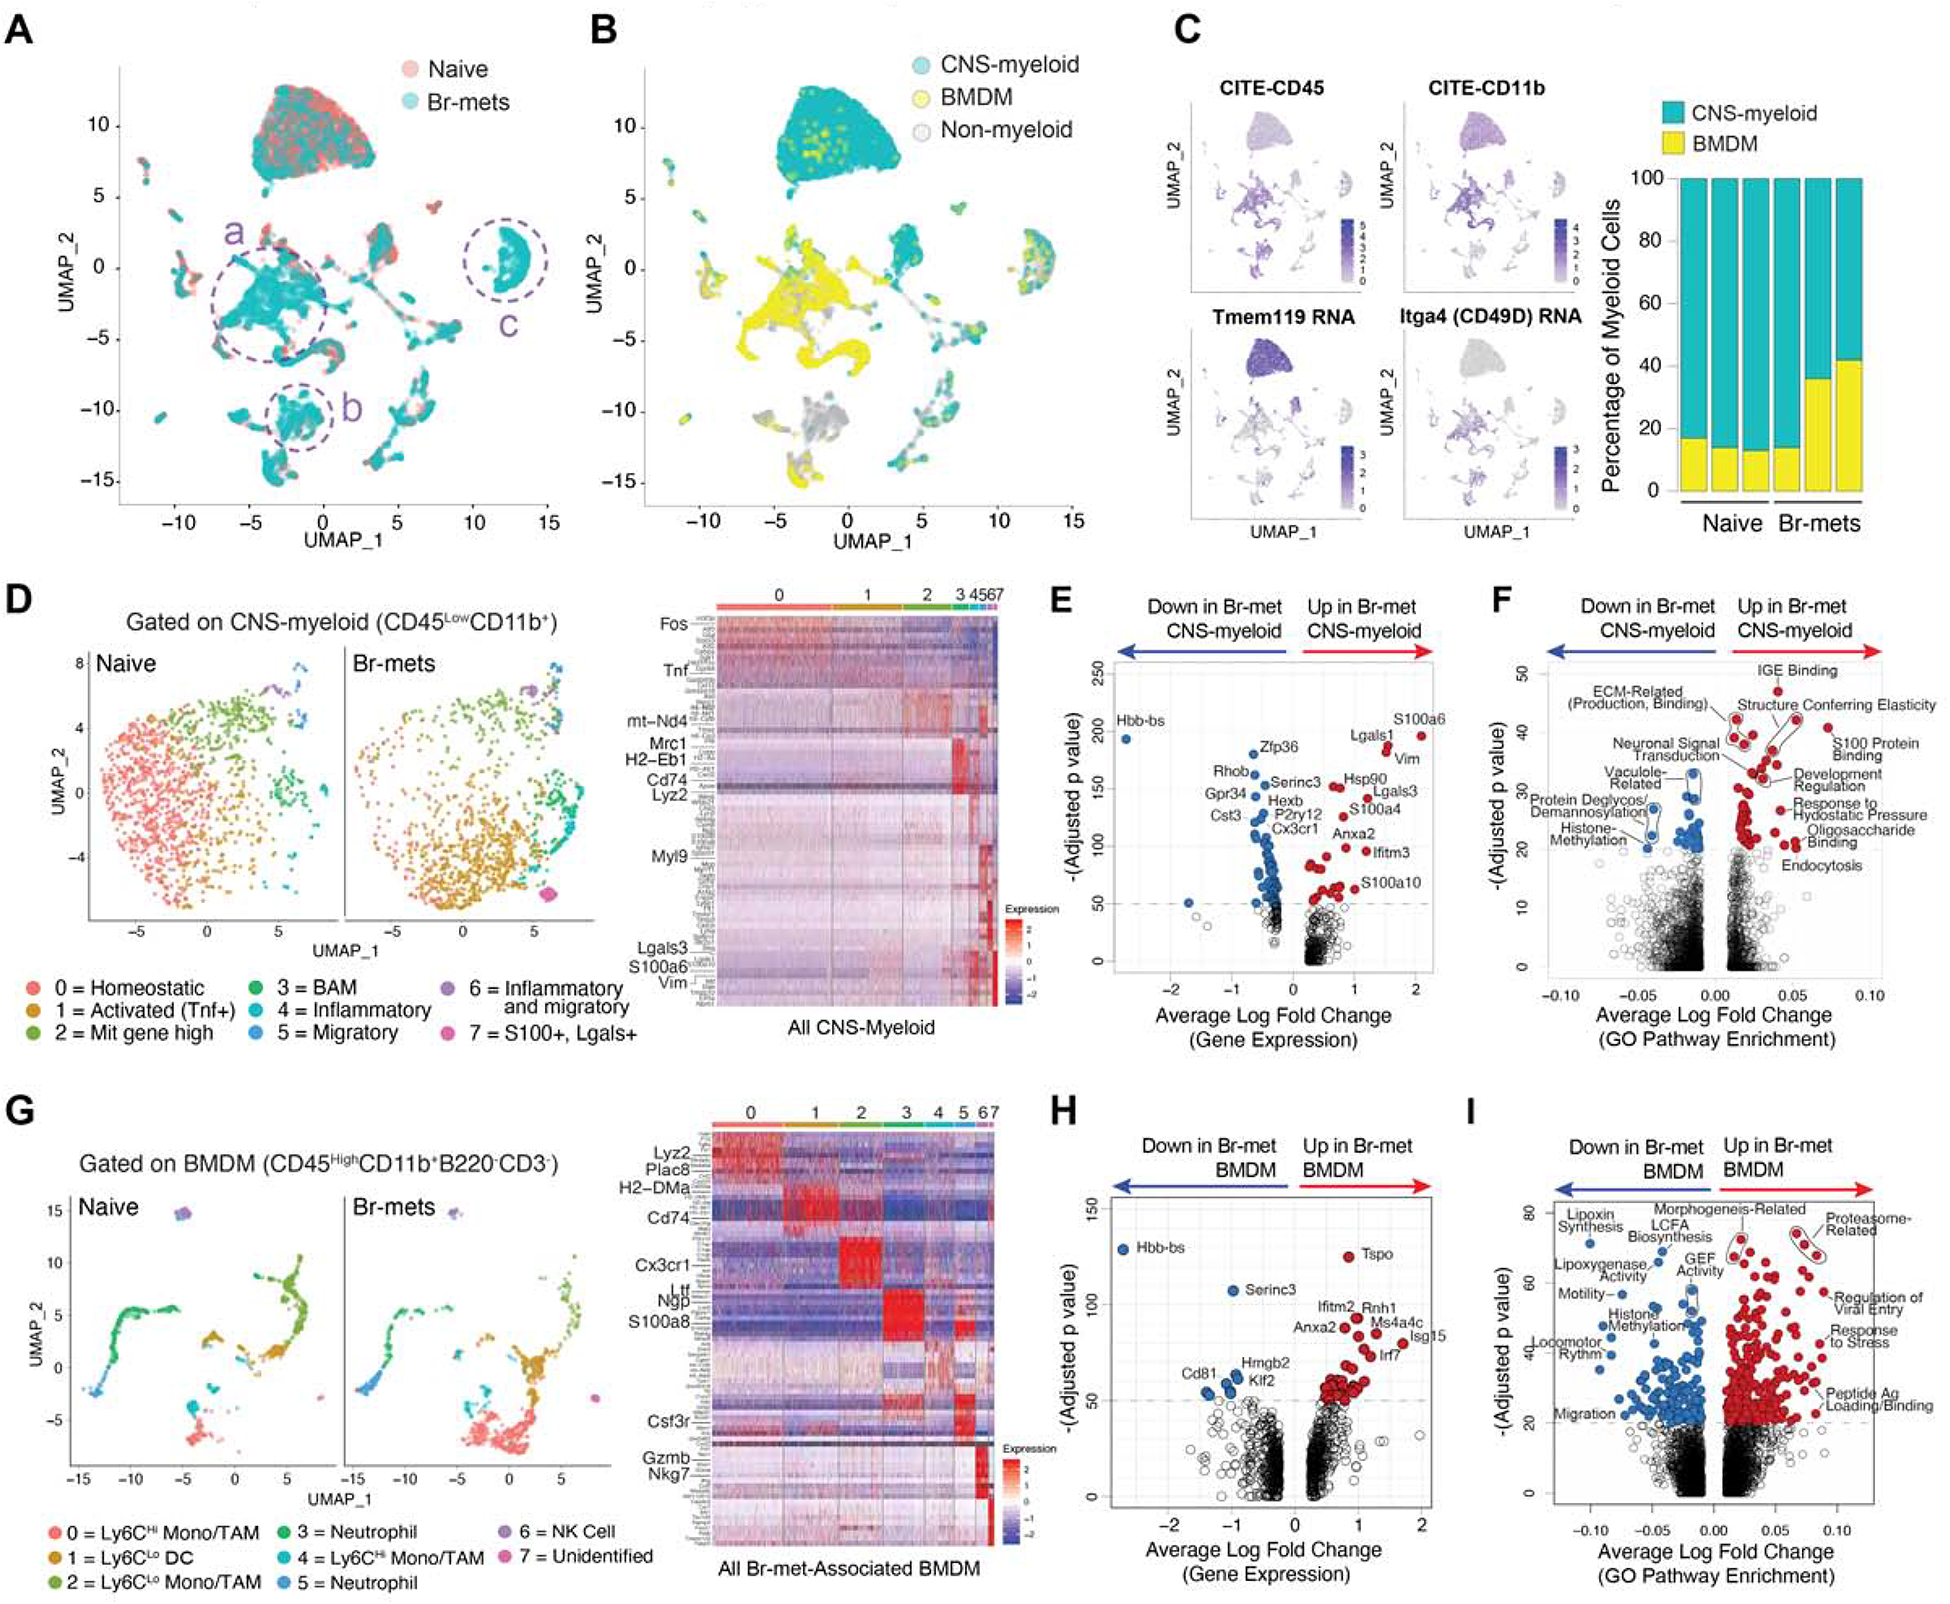
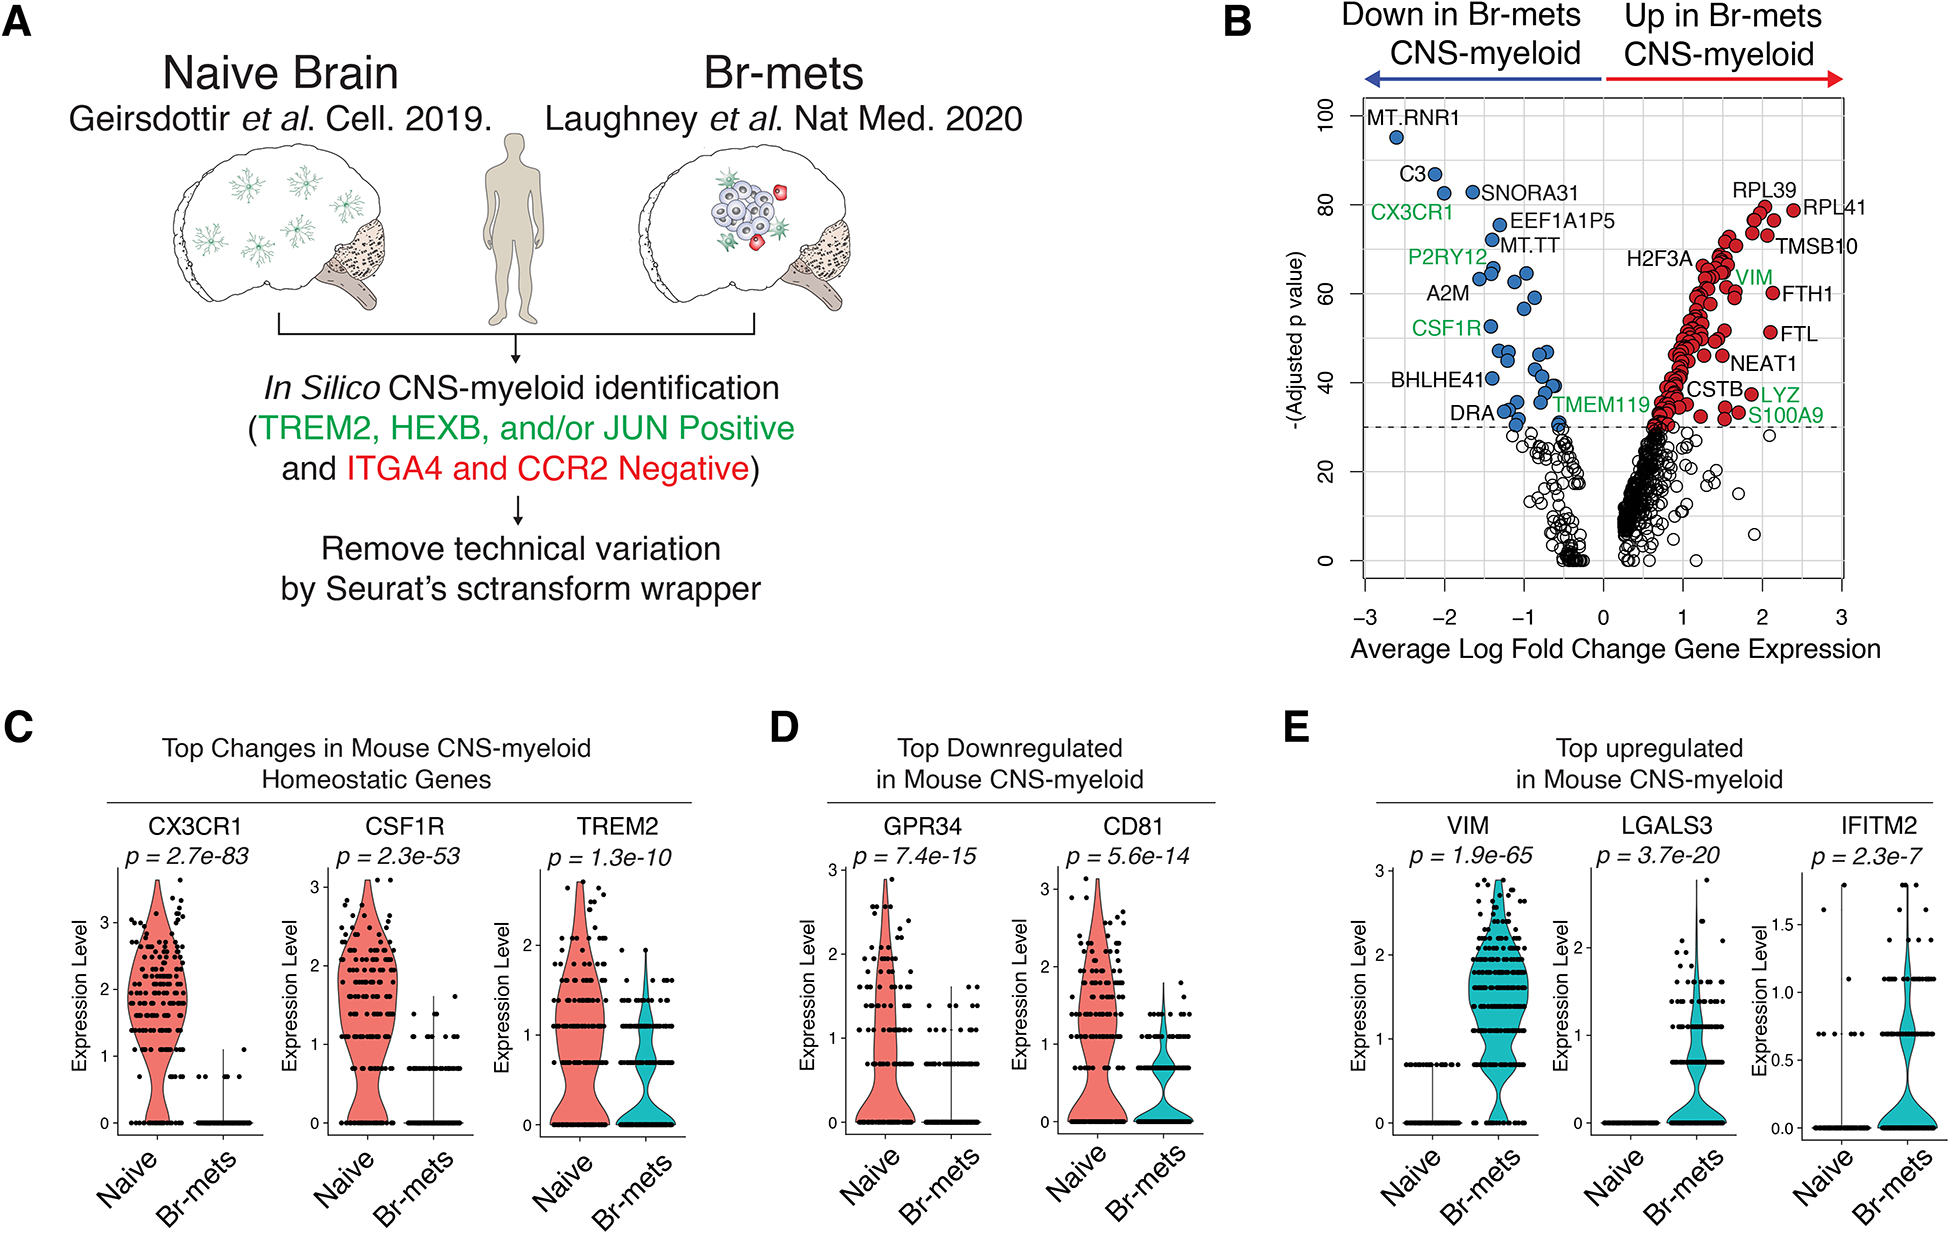
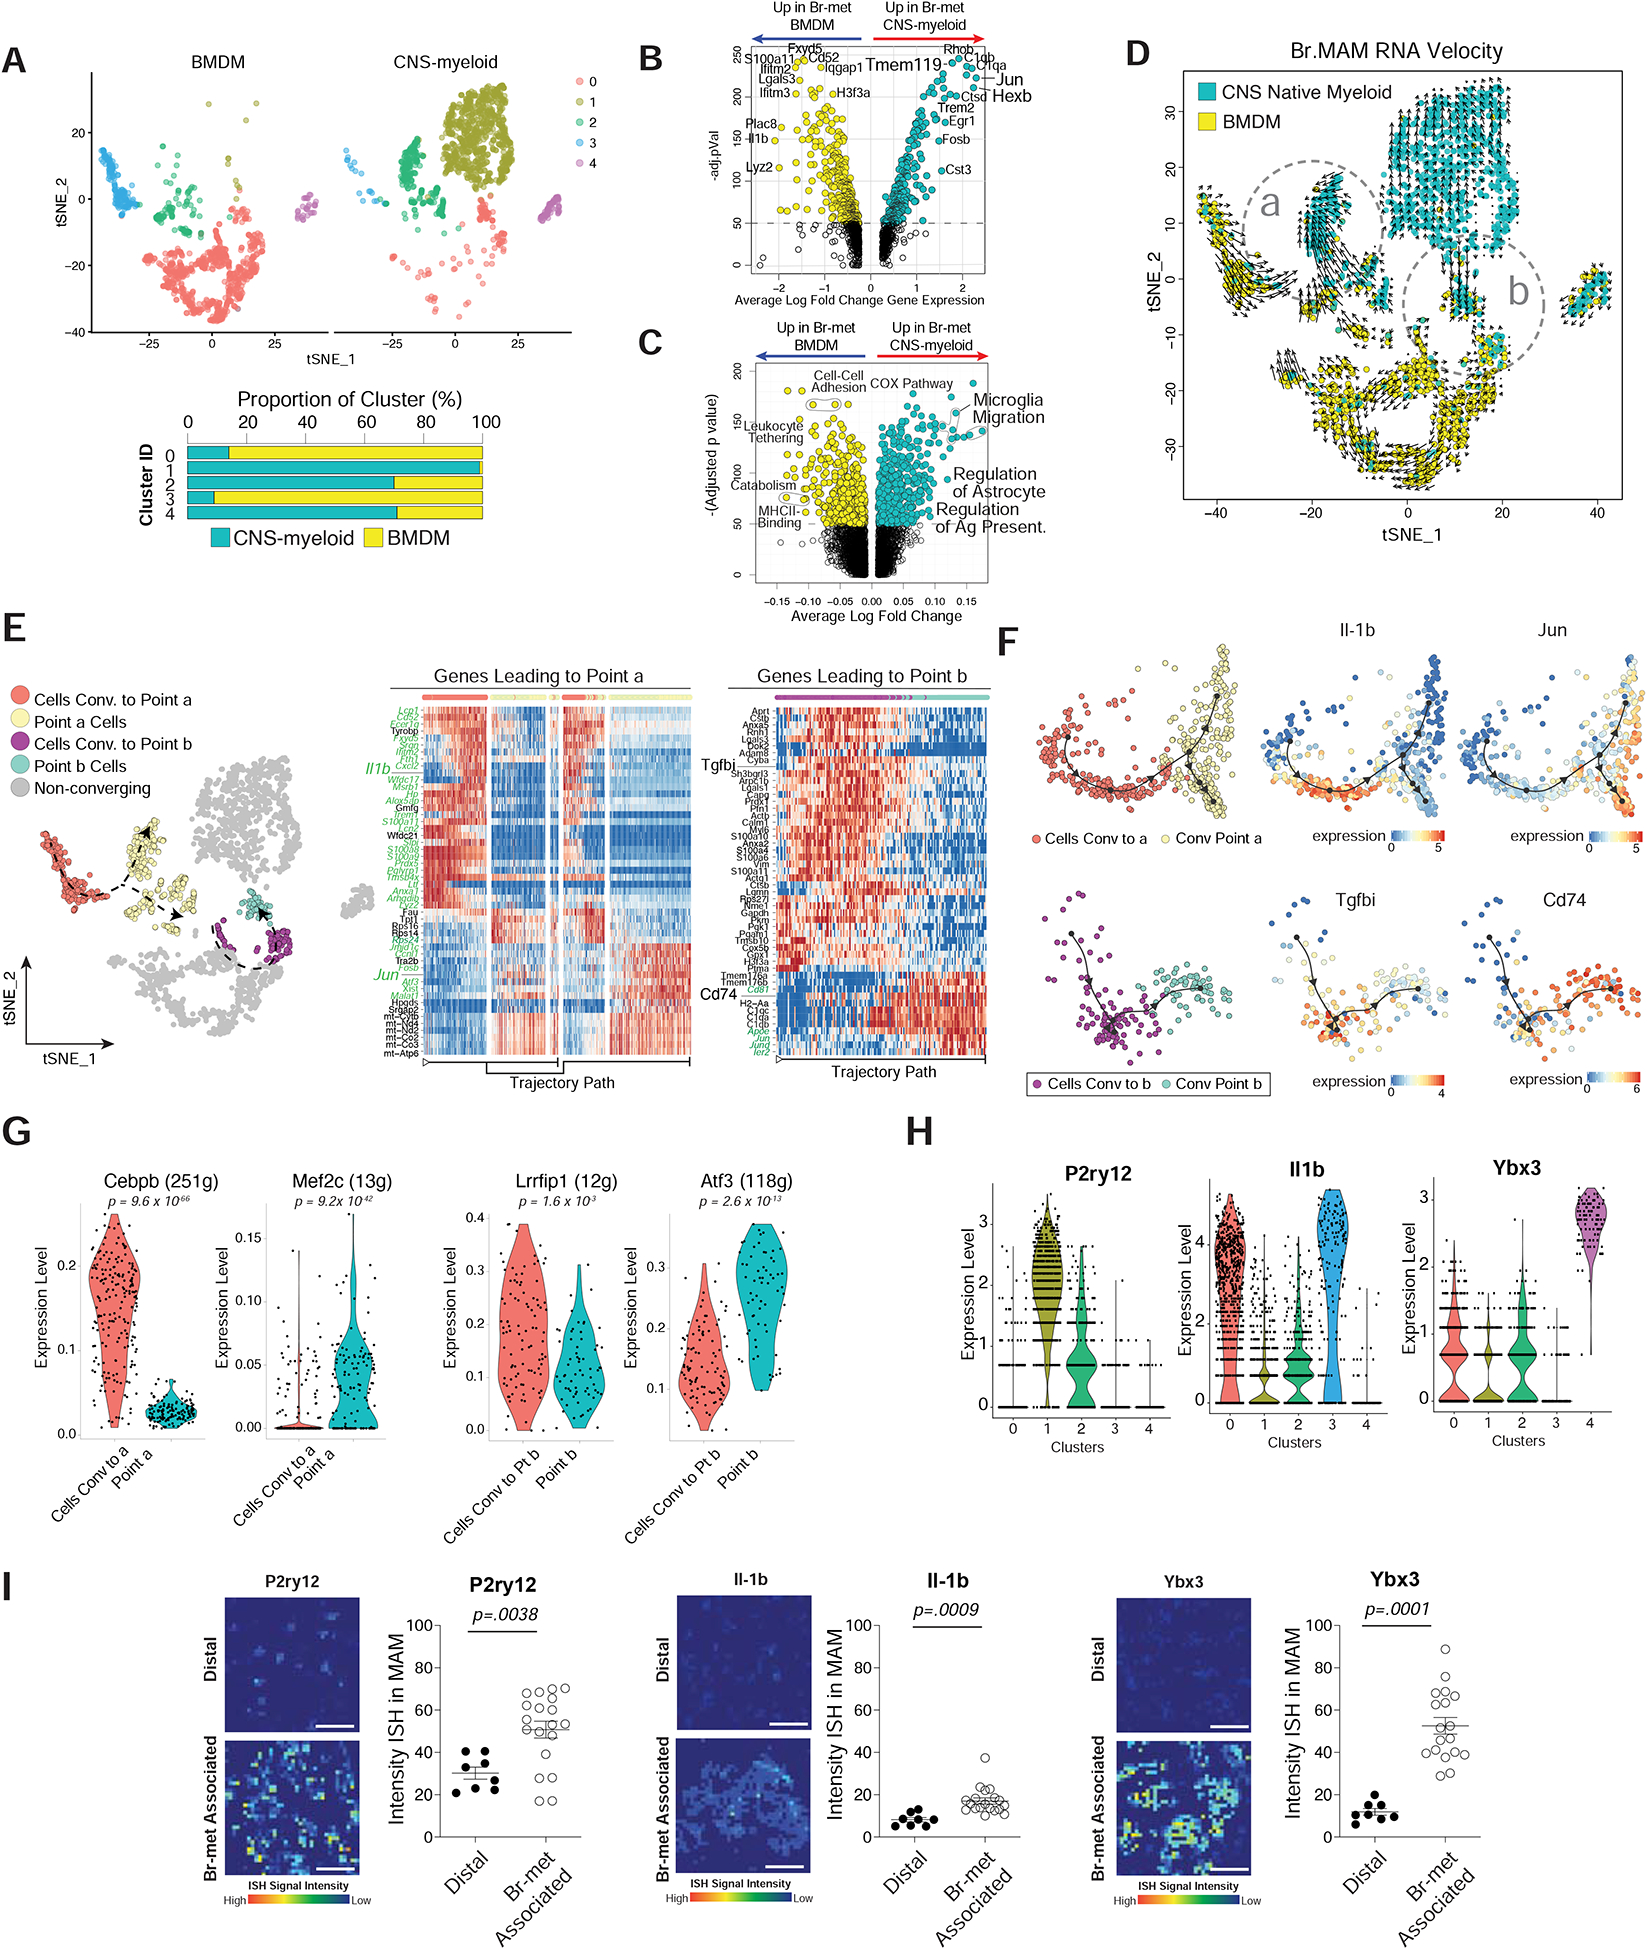
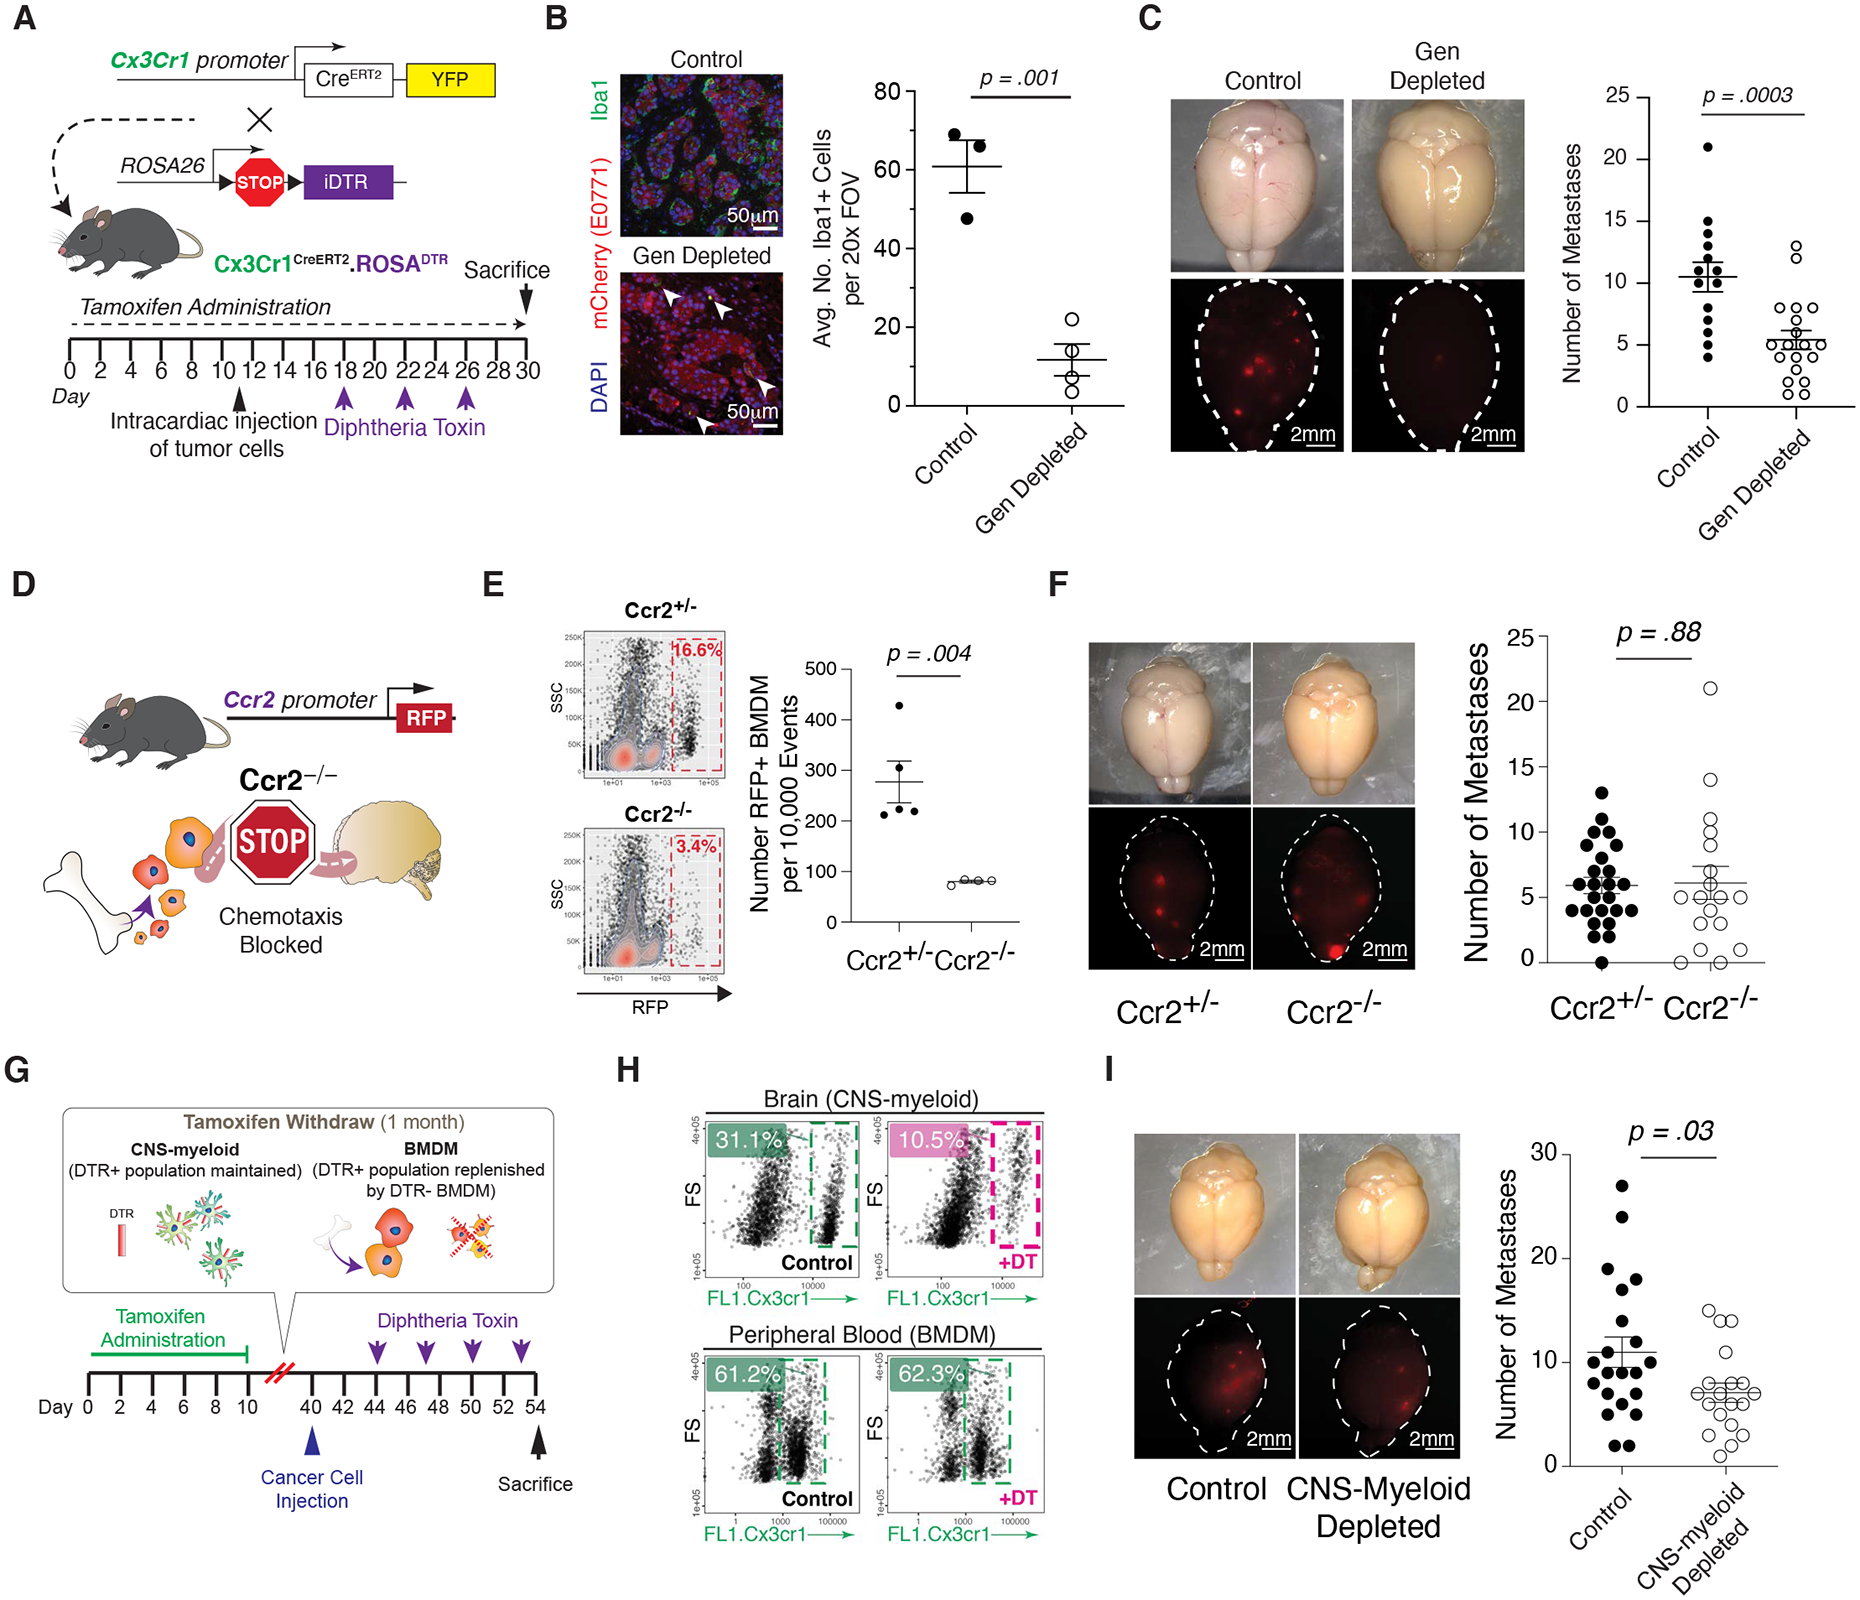
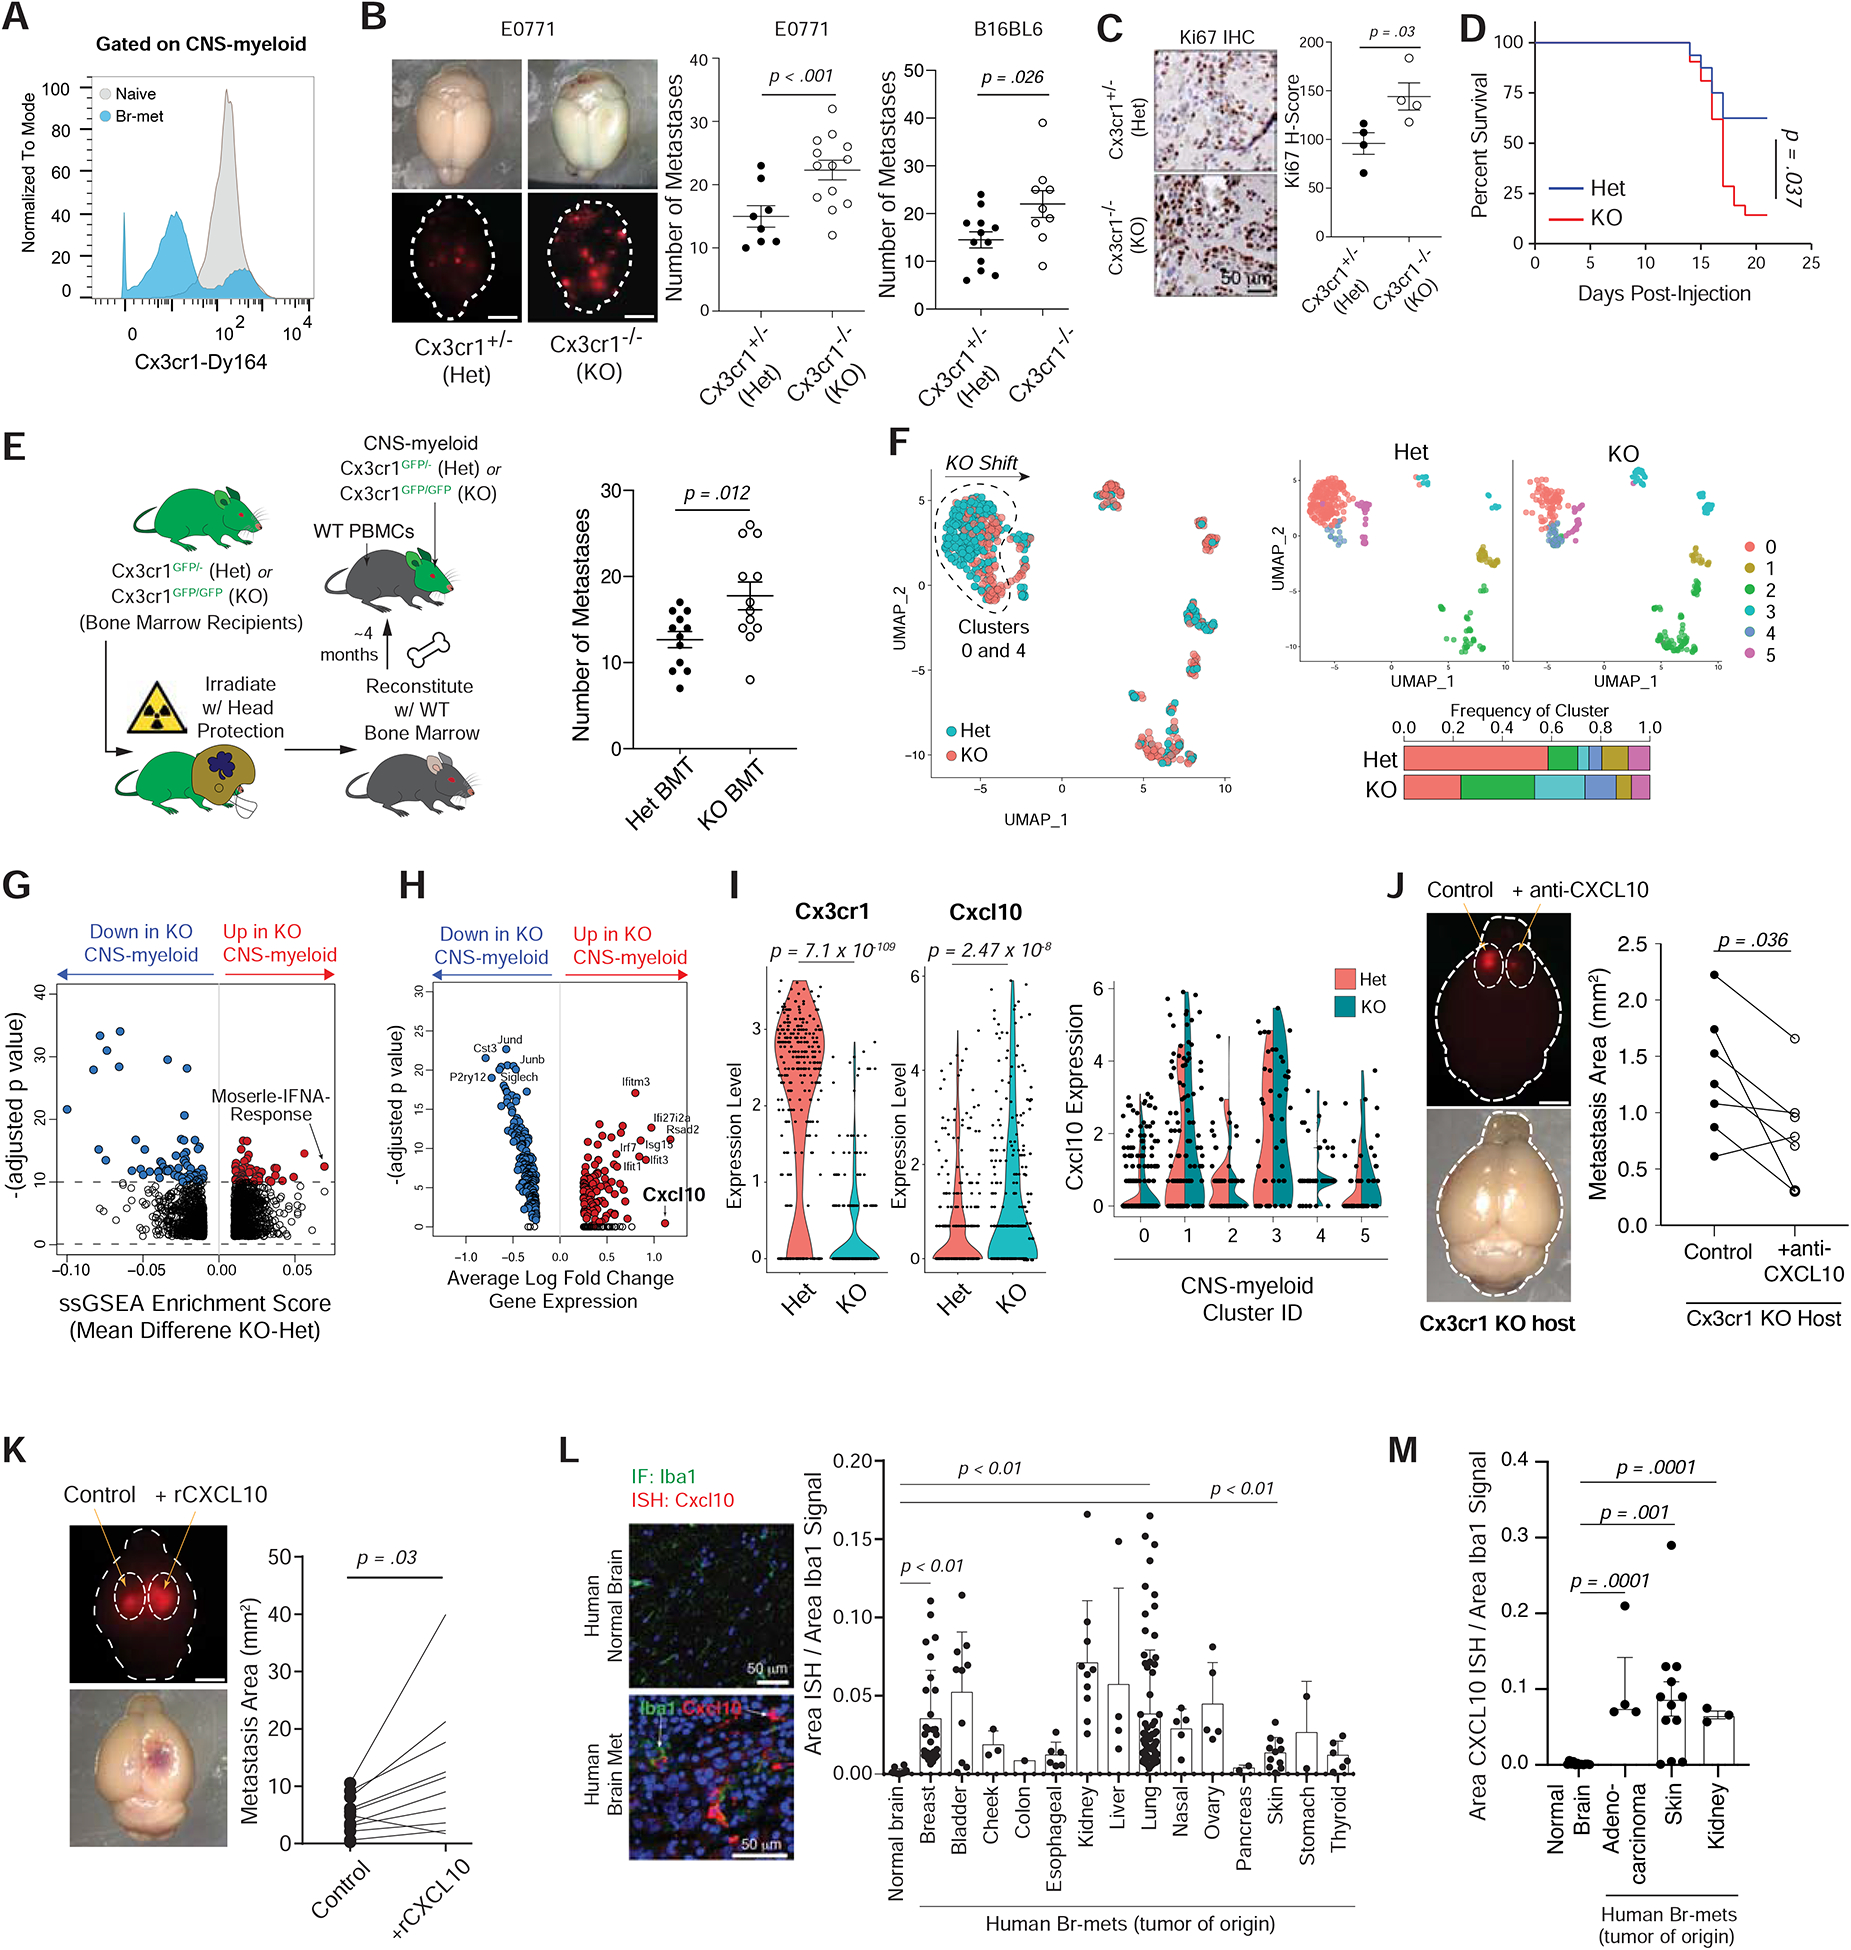
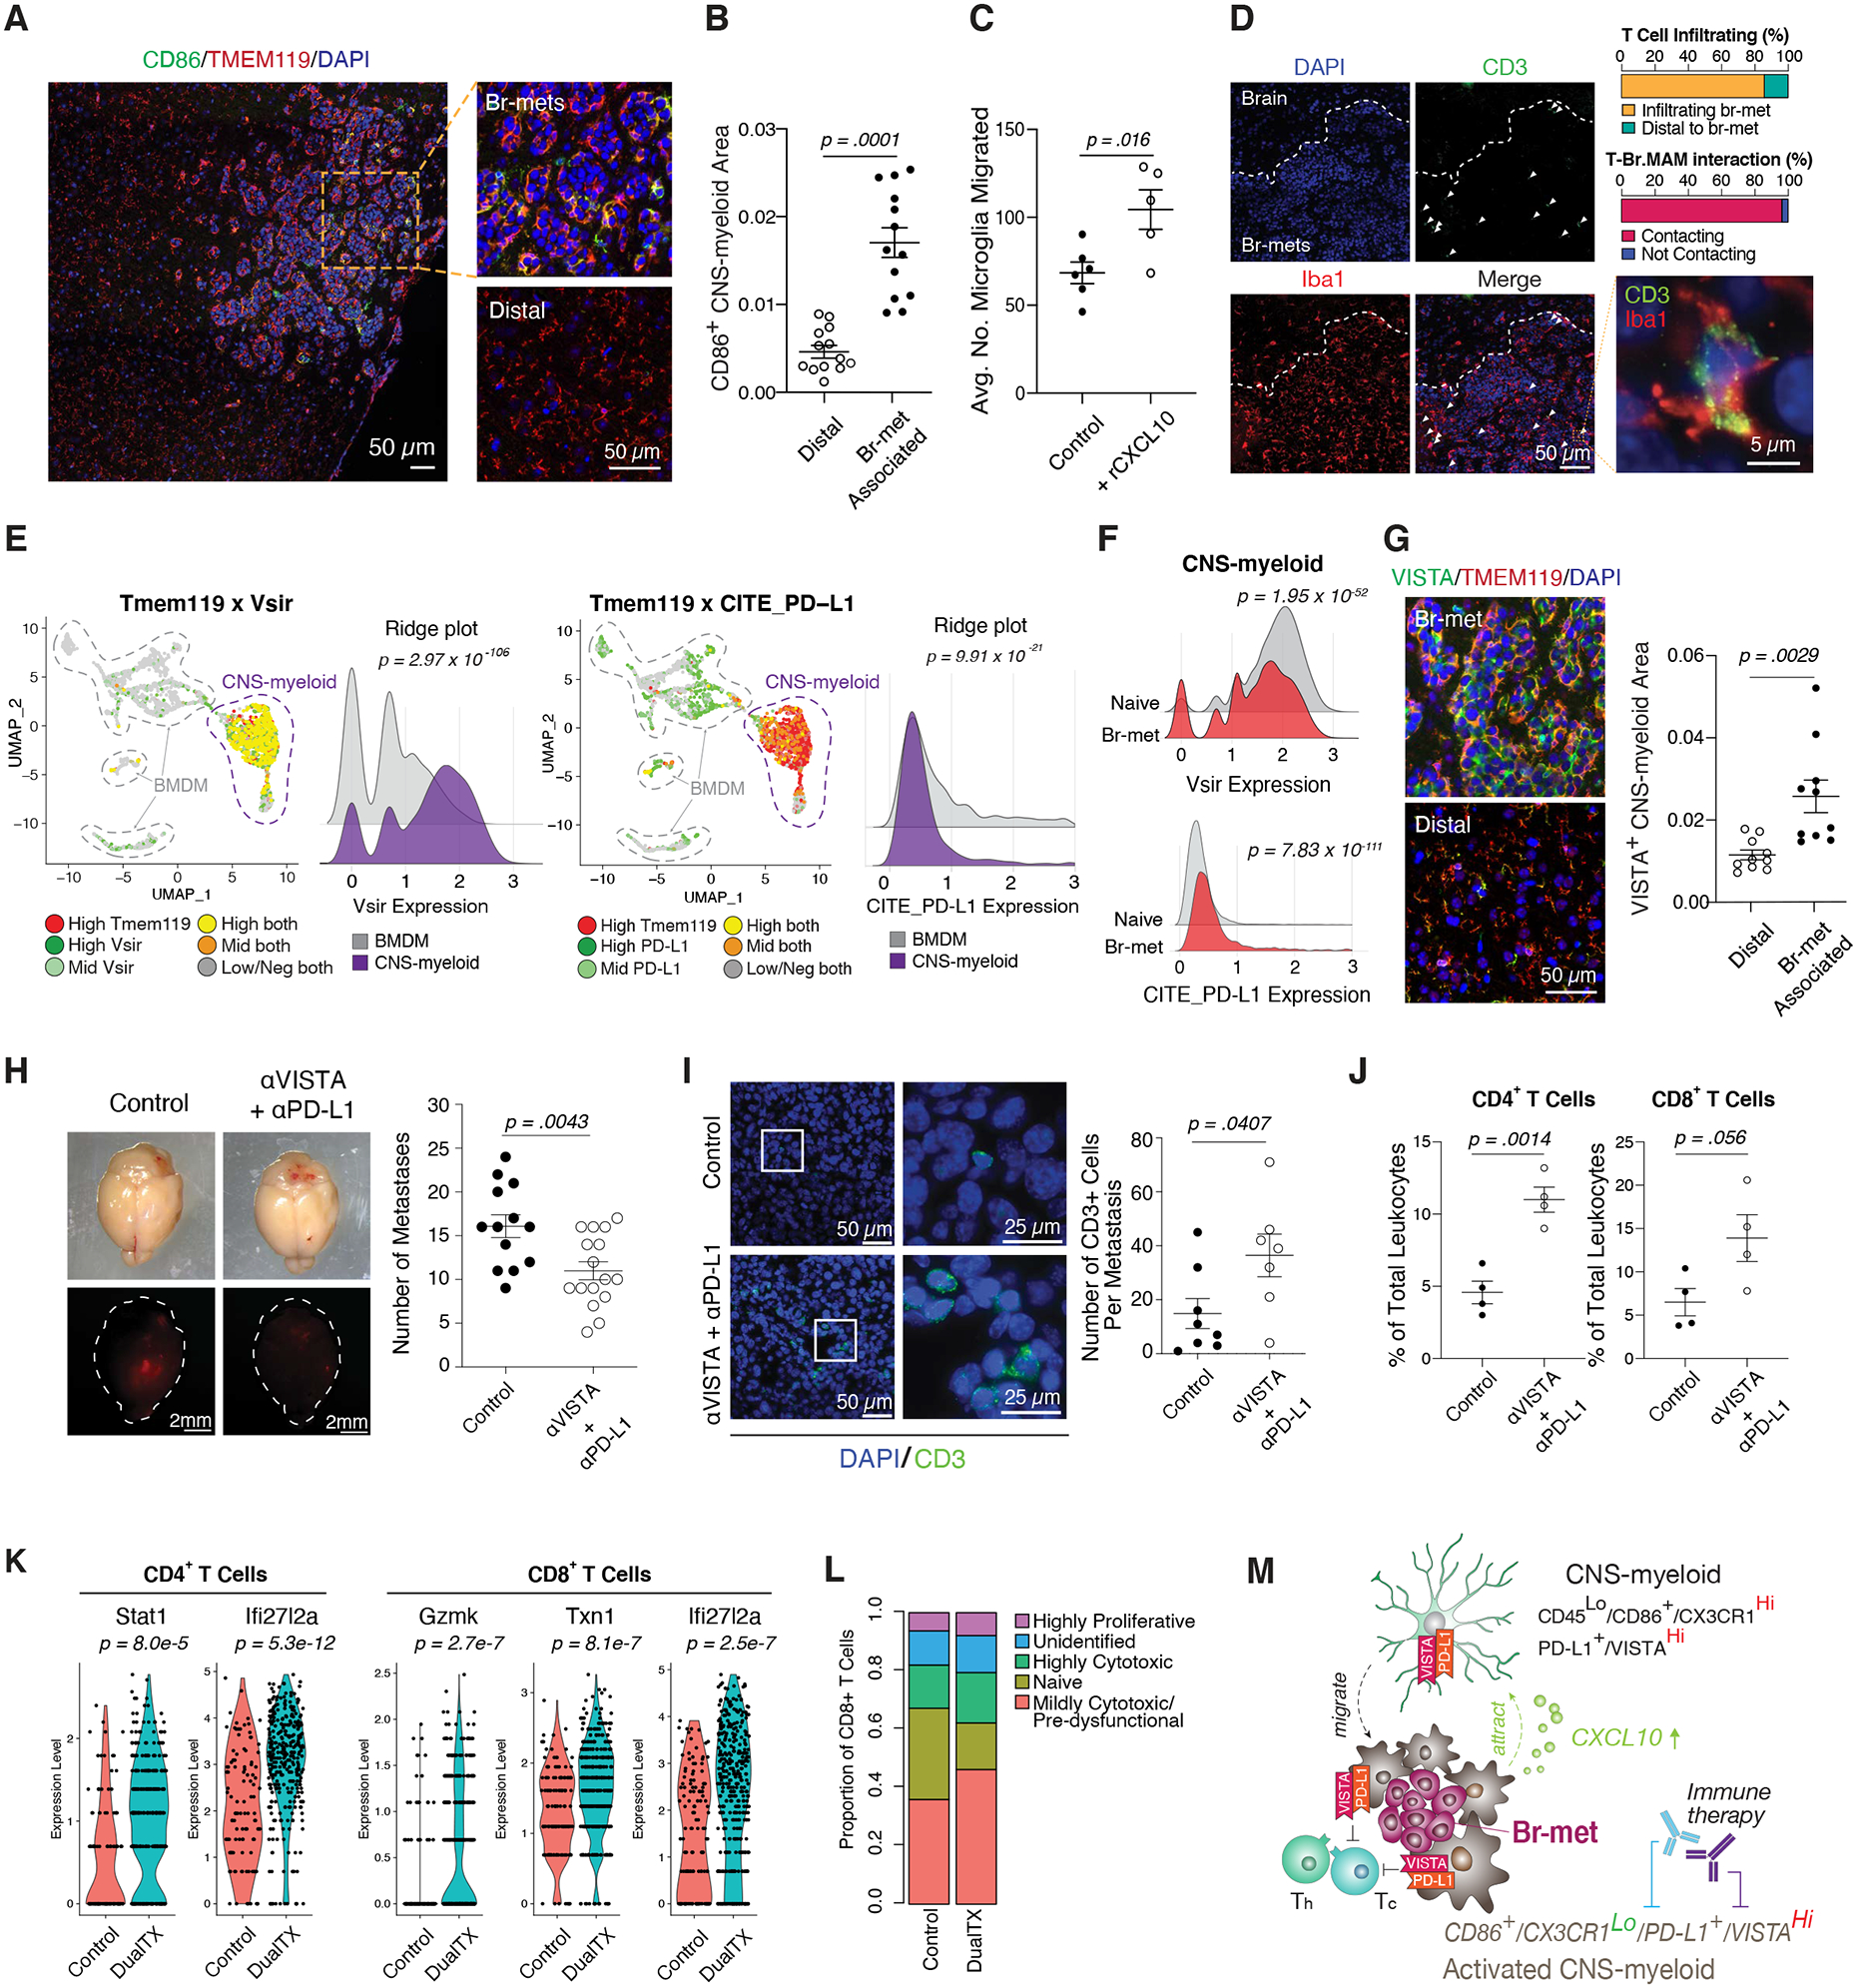
Brain metastasis (br-met) develops in an immunologically unique br-met niche. Central nervous system-native myeloid cells (CNS-myeloids) and bone-marrow-derived myeloid cells (BMDMs) cooperatively regulate brain immunity. The phenotypic heterogeneity and specific roles of these myeloid subsets in shaping the br-met niche to regulate br-met outgrowth have not been fully revealed. Applying multimodal single-cell analyses, we elucidated a heterogeneous but spatially defined CNS-myeloid response during br-met outgrowth. We found Ccr2+ BMDMs minimally influenced br-met while CNS-myeloid promoted br-met outgrowth. Additionally, br-met-associated CNS-myeloid exhibited downregulation of Cx3cr1. Cx3cr1 knockout in CNS-myeloid increased br-met incidence, leading to an enriched interferon response signature and Cxcl10 upregulation. Significantly, neutralization of Cxcl10 reduced br-met, while rCxcl10 increased br-met and recruited VISTAHi PD-L1+ CNS-myeloid to br-met lesions. Inhibiting VISTA- and PD-L1-signaling relieved immune suppression and reduced br-met burden. Our results demonstrate that loss of Cx3cr1 in CNS-myeloid triggers a Cxcl10-mediated vicious cycle, cultivating a br-met-promoting, immune-suppressive niche.

Keywords: Brain metastasis; T cells; bone marrow-derived myeloid cells; brain immunity; cancer immunology; immune suppression; immune therapy; metastatic niche; microglia; tumor microenvironment.


Conflict of interest statement

Declaration of Interests The authors declare no competing interests.

Figures

Figure 1.
Figure 1.. Myeloid Cells Infiltrate Br-mets and are a Prominent, Diverse Component of the Br-mets Niche
A) IF of myeloid cells in human br-mets. B) IHC of myeloid cells in murine E0771 br-mets. C) Fluorescence image of br-met-burdened Cx3cr1GFP/+ brain (top), 3D reconstruction and silhouettes of myeloid cells in the naive brain and in br-mets (bottom). D) Quantifications of 3D morphological and spatial features of naive myeloid cells (NMC) and Br.MAM (≥ 650 myeloid cells per group; each dot represents 1 cell). E) PCA based on morphologic features in (D) to assign morphology scores (left), silhouettes of myeloid cells of indicated morphology scores (each dot represents 1 cell) (right). F) Morphology score distributions for NMC and Br.MAM grouped by proximity to br-mets. G) Gating strategy to identify CD45+ cells in CyTOF data. H-I) tSNEs comparing innate immune cell marker expression (H) and functional marker expression (I) in leukocytes in br-mets and the naive brain. J) Frequency of indicated immune populations in naive and br-met-burdened brains as identified by manual gating (each dot represents 1 mouse). Data in D and J analyzed by two-tailed student’s t test, error bars represent SEM, center represents mean. See also Figure S1 and Table S1.
Figure 2.
Figure 2.. CITE-seq Reveals Br.MAM Subsets Display Transcriptional Profiles Distinct from their Naive Counterparts
A) UMAP of cells from the naive brain and br-mets color coded by sample (naive or br-met). B) UMAP color coded by myeloid subset (CNS-myeloid or BMDM). C) Feature plots of indicated genes (left), CNS-myeloid to BMDM ratio in the naive brain and br-mets (right). D) UMAPs of CNS-myeloid from the naive brain and br-mets color coded by transcriptional cluster (left), associated heatmap showing top differentially expressed genes (DEGs) among clusters (right). E) Volcano plot of DEGs between br-met-associated and naive CNS-myeloid. F) Volcano plot showing differentially expressed gene pathways (DEGPs) between br-met-associated and naive CNS-myeloid. G) UMAPs of BMDM from the naive brain and br-mets color coded by transcriptional clusters (left), associated heatmap showing top DEGs between clusters (right). H) Volcano plot of DEGs between br-met-associated and naive BMDM. I) Volcano plot showing DEGPs between br-met-associated and naive BMDM. Data in E, F, H, and I analyzed by Wilcoxon rank sum test. See also Figures S2–3 and Table S2–3.
Figure 3.
Figure 3.. Human Br-met-associated CNS-myeloid are Unique from their Naive Counterparts
A) Human scRNA-seq analysis schematic. B) Volcano plot of DEGs between br-met-associated and naive CNS-myeloid. C-E) Violin plots of expression of CNS-myeloid homeostatic genes (C), top downregulated mouse genes (D), and top upregulated mouse genes (E) in br-met-associated and naive CNS-myeloid (each dot represents 1 cell). All plots derived from pooling three biological replicates per experimental condition. Data analyzed by Wilcoxon rank sum test. See also Table S4.
Figure 4.
Figure 4.. Br.MAM Subsets Display Divergent and Convergent Phenotypes and Unique Spatial Distributions
A) tSNE of Br.MAM color coded by transcriptional clusters (top), CNS-myeloid to BMDM ratio within each cluster (bottom). B-C) Volcano plots showing DEGs (B) and DEGPs (C) between CNS-myeloid and BMDM during br-met. D) tSNE overlaid with RNA velocity of Br.MAM. E) tSNE annotated to show cells used for trajectory DEG analysis (left), heatmaps of trajectory DEGs related to point a (middle) and b (right). Genes in green font regulated by transcription factors (TFs) identified in panel (G). F) Dimensional reduction representation of trajectory overlaid with indicated genes. G) Violin plots of indicated TFs differentially expressed between cells converging and convergent point cells (each dot represents 1 cell). H) Violin plots of indicated Br.MAM transcriptional cluster marker genes (each dot represents 1 cell). I) Heatmaps of ISH intensity within myeloid cells associated with br-mets or distal to br-mets (left), associated quantification of ISH intensity within myeloid cells (each dot represents 1 field of view) (right). Panels A-H derived from pooling of three biological replicates. Data in B, C, and G analyzed by Wilcoxon rank sum test. Data in I analyzed by two-tailed student’s t test, error bars represent SEM, center represents mean. See also Tables S5.
Figure 5.
Figure 5.. Depletion of the General Myeloid Population and CNS-myeloid Reduces Br-met
A) Schematic of Cx3cr1CreERT/+ROSAiDTR/+ mouse model. B) IF of Br.MAM in control and myeloid-depleted mice (left), associated quantification of Iba1+ cells per 20x FOV in brains of control and myeloid-depleted mice during br-mets (each dot represents 1 mouse) (right). C) Stereoscope images of br-mets in brains of control and myeloid-depleted mice (left), associated quantification of br-met number in control and myeloid-depleted mice (each dot represents 1 mouse; data pooled from two independent experiments with ≥3 mice per group) (right). D) Schematic of Ccr2−/− mouse model. E) Biaxial plots of RFP+ BMDM br-met infiltration in Ccr2+/− and Ccr2−/− mice (left), associated quantification (each dot represents 1 mouse; biaxial representative of ≥ 3 biological replicates per group) (right). F) Stereoscope images of br-mets in brains of Ccr2+/− and Ccr2−/−mice (left), associated quantification of br-met number in Ccr2+/− and Ccr2−/− mice (each dot represents 1 mouse; data pooled from 3 independent experiments with ≥ 3 mice per group) (right). G) Experimental schematic of CNS-myeloid-exclusive depletion. H) Biaxial plots comparing Cx3cr1+ cell abundance in brain (top) and blood (bottom) of CNS-myeloid depleted mice relative to controls. I) Stereoscope images of br-mets in brains of control and CNS-myeloid-depleted mice (left), associated quantification of br-met number in control and CNS-myeloid-depleted mice (each dot represents 1 mouse; quantification based on pooled data from 4 independent experiments with ≥ 4 mice per group) (right). Data in B, C, E, F, and I analyzed by two-tailed student’s t test and error bars represent SEM, center represents mean. See also Figures S4–5.
Figure 6.
Figure 6.. Cx3cr1 Knockout Drives a CNS-myeloid Interferon Response that Promotes Br-met via Cxcl10
A) Histogram of Cx3cr1 protein expression in naive or br-met-associated CNS-myeloid. B) Stereoscope images of E0771 br-mets in brains of Cx3cr1+/− (Het) and Cx3cr1−/− (KO) mice (left), associated quantification of br-met number in Het and KO mice (each dot represents 1 mouse; quantification based on pooled data from 2 independent experiments with ≥ 3 mice per group) (middle). Quantification of B16BL6 br-mets that formed in Het and KO mice (each dot represents 1 mouse; quantification based on pooling of 3 independent experiments with ≥ 3 mice per group) (right). C) Ki67 IHC of br-mets of Het and KO (left), associated Ki67 H-score quantification (each dot represents cumulative H score of all br-mets within one mouse) (right). D) Survival plot of br-met-bearing Het and KO mice (Quantification based on 1 experiment). E) Schematic bone marrow transplantation into Het and Hom hosts (left), associated quantification of br-met burden in Het BMT and Hom BMT hosts (each dot represents 1 mouse; quantification based on pooled data from 3 independent experiments with ≥ 3 mice per group) (right). F) UMAP of CNS-myeloid color coded by genotype (left) and split by genotype and color coded by transcriptional cluster (top right), with stacked bar chart of cluster frequencies within each genotype (bottom right). G) Volcano plot showing DEGPs between KO and Het CNS-myeloid. H) Volcano plot showing DEGs between KO and Het CNS-myeloid. I) Violin plots of Cx3cr1 and Cxcl10 expression in KO and Het CNS-myeloid (each dot represents 1 cell) (left and middle), and split violin plots showing Cxcl10 expression among genotypes within each transcriptional cluster (each dot represents 1 cell) (right). J) Stereoscope images of br-mets in brains in which cancer cells were co-injected with HBSS (control, left hemisphere) or αCxcl10 (right hemisphere) in KO mice (each dot represents 1 mouse; quantification based on pooled data from 2 independent experiments with ≥ 3 mice per group). K) Stereoscope images of br-mets in brains in which cancer cells were co-injected with HBSS (control, left hemisphere) or rCxcl10 (right hemisphere) (each dot represents 1 mouse; quantification based on pooled data from 2 independent experiments with ≥ 3 mice per group). L) Dual Cxcl10 RNA-ISH/Iba1 IF in the naive human brain and human breast cancer br-mets samples (left), associated quantification of area of Cxcl10-ISH signal within myeloid cells. (each dot represents 1 field of view; Data derived from human tissue arrays; nnaive patient = 4; nbr-met patient = 37). M) Quantification of area of Cxcl10-ISH signal within myeloid cells among normal human brain samples and human br-mets in independently acquired tissue (each dot represents 1 field of view; nnaive patient = 4; nbr-met patient = 5). CITE-seq data derived from pooling two biological replicates per condition. Data in B, C, D, E, L, and M analyzed by two-tailed student’s t test and error bars represent SEM, except L in which error bars represent SD, center represents mean. Data in J and K analyzed by two-tailed paired student’s t test. Data in G and H analyzed by Wilcoxon rank sum test. Data in I analyzed by bimod likelihood-ratio test for single cell feature expression. See also Figure S6 and Table S1 and 6.
Figure 7.
Figure 7.. Cxcl10 Recruits VISTAHi PD-L1+ CNS-myeloid to Suppress T Cells
A) IF of CD86+ CNS-myeloid within br-met niche (left), magnified view of these cells within the lesion (top right) and distal to br-met (bottom right). B) Quantification of area occupied by CD86+ CNS-myeloid within br-met lesions compared to distal to br-mets (each dot represents 1 br-met). C) Quantification of number of SIM-A9 microglia migrated across transwell with rCxcl10 compared to control (each dot represents 1 well; quantification based on 1 experiment). D) IF of T cell and myeloid cell spatial distribution within br-mets and associated quantifications of T cell infiltration and T cell-Br.MAM contact. E) Feature plot and ridge plots showing Vsir RNA expression (left) and PD-L1 protein expression (right) in br-met-associated CNS-myeloid and BMDM. F) Ridge plots comparing Vsir RNA expression (top) and PD-L1 protein expression (bottom) in the naive brain and br-met-burdened brain. G) IF of VISTA+ CNS-myeloid within br-met lesions (top left) and distal to br-met (bottom left), associated quantification of area occupied by VISTA+ CNS-myeloid within br-mets compared to distal to br-mets (each dot represents 1 br-met) (right). H) Stereoscope images of br-mets in brains of αVISTA + αPD-L1 treated mice and control mice (left), associated quantification of br-met number between treatment and control (each dot represents 1 mouse; quantification based on 2 independent experiments with ≥ 3 mice per group per experiment) (right). I) IF of CD3+ T cells associated with E0771 br-mets in αVISTA + αPD-L1 treated mice and control mice (left), associated quantification of the number of CD3+ T cells per br-met (each dot represents 1 br-met) (right). J) Quantification of proportion of CD4+ T cells (left) or CD8+ T cells (right) of all leukocytes in control mice and αVISTA + αPD-L1 treated mice. (Each dot represents 1 mouse). K) Violin plots of T cell activation gene expression that significantly increased with αVISTA + αPD-L1 compared to control (each dot represents 1 cell). L) Stacked bar chart showing proportions of T cell activation status in control mice and αVISTA + αPD-L1 treated mice. M) Model of myeloid cell regulation of br-met outgrowth. Data in E and F derived from pooling three biological replicates per condition. Data in K and L derived from pooling ≥ 4 biological replicates per condition. Data in B, C, G, H, I, and J analyzed by two-tailed student’s t test, error bars represent SEM, center represents mean. Data in E, F, and K analyzed by Wilcoxon rank sum test. See also Figure S7.

Comment in

References

    1. Achrol AS, Rennert RC, Anders C, Soffietti R, Ahluwalia MS, Nayak L, Peters S, Arvold ND, Harsh GR, Steeg PS, et al. (2019). Brain metastases. Nat. Rev. Dis. Primer 5, 5. - PubMed
    1. Aibar S, González-Blas CB, Moerman T, Huynh-Thu VA, Imrichova H, Hulselmans G, Rambow F, Marine J-C, Geurts P, Aerts J, et al. (2017). SCENIC: single-cell regulatory network inference and clustering. Nat. Methods 14, 1083–1086. - PMC - PubMed
    1. Andreou KE, Soto MS, Allen D, Economopoulos V, de Bernardi A, Larkin JR, and Sibson NR (2017). Anti-inflammatory Microglia/Macrophages As a Potential Therapeutic Target in Brain Metastasis. Front. Oncol 7, 251. - PMC - PubMed
    1. Benbenishty A, Gadrich M, Cottarelli A, Lubart A, Kain D, Amer M, Shaashua L, Glasner A, Erez N, Agalliu D, et al. (2019). Prophylactic TLR9 stimulation reduces brain metastasis through microglia activation. PLoS Biol. 17, e2006859. - PMC - PubMed
    1. Bennett FC, Bennett ML, Yaqoob F, Mulinyawe SB, Grant GA, Hayden Gephart M, Plowey ED, and Barres BA (2018). A Combination of Ontogeny and CNS Environment Establishes Microglial Identity. Neuron 98, 1170–1183.e8. - PMC - PubMed

Publication types

MeSH terms