. 2020 Oct 27;33(4):108324.
doi: 10.1016/j.celrep.2020.108324.

Widespread Transcriptional Readthrough Caused by Nab2 Depletion Leads to Chimeric Transcripts with Retained Introns

Affiliations

Widespread Transcriptional Readthrough Caused by Nab2 Depletion Leads to Chimeric Transcripts with Retained Introns

Tara Alpert et al. Cell Rep. .

Erratum in

Abstract

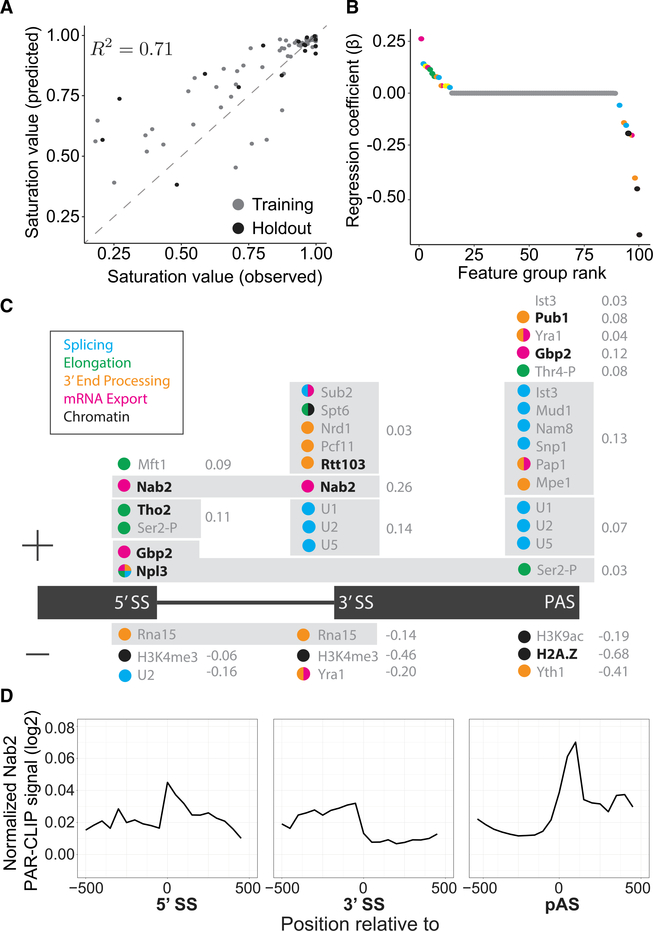
Nascent RNA sequencing has revealed that pre-mRNA splicing can occur shortly after introns emerge from RNA polymerase II (RNA Pol II). Differences in co-transcriptional splicing profiles suggest regulation by cis- and/or trans-acting factors. Here, we use single-molecule intron tracking (SMIT) to identify a cohort of regulators by machine learning in budding yeast. Of these, Nab2 displays reduced co-transcriptional splicing when depleted. Unexpectedly, these splicing defects are attributable to aberrant "intrusive" transcriptional readthrough from upstream genes, as revealed by long-read sequencing. Transcripts that originate from the intron-containing gene's own transcription start site (TSS) are efficiently spliced, indicating no direct role of Nab2 in splicing per se. This work highlights the coupling between transcription, splicing, and 3' end formation in the context of gene organization along chromosomes. We conclude that Nab2 is required for proper 3' end processing, which ensures gene-specific control of co-transcriptional RNA processing.

Keywords: 3′ end cleavage; SMIT; co-transcriptional processes; intrusive transcripts; long-read sequencing; machine learning; nascent RNA; pre-mRNA splicing; transcriptional readthrough.


Conflict of interest statement

Declaration of Interests The authors declare no conflict of interest.

Figures

Figure 1.
Figure 1.. Machine Learning Predicts cis- and trans-Acting Factors Associated with Co-transcriptional Splicing
(A) Observed and predicted saturation values are correlated with the variance explained (R2) as indicated for training (gray) and holdout (black) data. (B) Feature groups used in the model are plotted according to their regression coefficient (b) and colored according to their cellular process (legend in C). Yellow indicates a feature group with mixed processes. (C) Feature groups (gray box) are displayed above or below (positive or negative regression coefficient, respectively) the geneannotation(black) accordingto the genetic position where those features were identified as significant. Regression coefficient values (gray) are indicated to the right of the feature group. (D) Normalized PAR-CLIP signals for Nab2 are aligned to 5′ SSs, 3′ SSs, and poly(A) sites (PASs) of all intron-containing genes in budding yeast (data from Baejen et al., 2014).
Figure 2.
Figure 2.. Nab2 Depletion Variably Affects Co-transcriptional Splicing Profiles
(A) Co-transcriptional splicing profiles for Control-AA (left) and Nab2-AA (right) for three genes that exemplify the range of variation seen. Data from 0, 10, and 30 min of rapamycin treatment are modeled together (top legend) using a Loess smoothing method (solid line) with a 95% confidence interval. DSMIT values, indicated at the top left of each profile, are calculated as the Euclidean distance between the 0 and 10 min samples for the first 300 bp (bins = 60 bp). The PAS is indicated by a vertical dashed line, if the data extend to the end of the gene. (B) Distribution of ΔSMIT values from the 0-min time point for all samples with significance (Mann-Whitney U test) as follows: *p ≤ 0.05, **p ≤ 0.01, ***p ≤ 0.001, ****p ≤ 0.0001. (C) RT-PCR validation of splicing changes for two pre-mRNAs from (A). Random hexamers were used to reverse-transcribe nascent RNA, and intron-spanning primers amplify unspliced (top) and spliced (bottom) bands.
Figure 3.
Figure 3.. Long-Read Sequencing Reveals Transcriptional Readthrough upon Nab2 Depletion
(A) Nanopore sequencing reads were sorted by 3′ end position for YPL079W (gray) for Control-AA (teal) and Nab2-AA (orange) samples. Reads were filtered for overlap with the intron-containing gene and must start no more than 100 bp downstream of the annotated TSS. Unspliced reads are displayed as a solid lineina darker color, and spliced reads are shown in a lighter color, with a thin line representing missing sequence information. All reads shown arise from the Watson strand. Read count and fraction spliced (percent) are shown. (B) Coverage of reads downstream of the PAS was normalized to the signal at the PAS. (C) The fraction spliced per gene is calculated for long reads that start within 50 bp of the annotated TSS and is plotted for Control-AA and Nab2-AA. The adjusted R2 value is displayed for the linear regression fit (gray line) and 95% confidence interval (gray ribbon). Data from two biological replicates were first analyzed separately and then combined for display upon qualitative agreement between replicates.
Figure 4.
Figure 4.. Intrusive Transcripts Generated by Transcriptional Readthrough Are Poorly Spliced
(A) Nanopore reads aligned to YPL079W (gray) were filtered to start no more than 100 bp downstream of the TSS. Intrusive reads that began more than 100 bp upstream of the TSS are displayed separately above reads that began near the TSS. Reads that do not span the entire intron of YPL079W are colored gray and were not included in spliced/unspliced values in (B). Reads are colored a darker shade of teal (Control-AA) or orange (Nab2-AA) when the YPL079W intron is unspliced. All reads shown arise from the Watson strand. (B) Read counts (n =) are displayed for each category diagrammed in (C). The number of spliced and unspliced reads is also indicated alongside the fraction spliced (percent). (C) Top: gene diagram (black) showing how example reads (gray) are classified according to readthrough status relative to the intron-containing gene. Left: colored bar plots showing the fraction of reads that are spliced or unspliced in each readthrough category. Right: grayscale bar plots showing the fraction of reads for each dataset that belong to the three readthrough categories (see legend). (D) The fraction spliced is calculated for each gene using all reads or only intrusive reads and plotted for each condition. Values arising from less than 10 reads were removed. Reads that begin more than 50 bp upstream of the annotated TSS are defined as intrusive. The dashed line (gray) is y = x, and the black line is a linear regression model fit to the data with a 95% confidence interval. R2 for the model is displayed on each plot (p < 2.2 × 10⁻¹⁶ for both). Data from two biological replicates were combined after confirming agreement between replicates for each parameter.

Similar articles

Cited by

References

    1. Aibara S, Gordon JMB, Riesterer AS, McLaughlin SH, and Stewart M (2017). Structural basis for the dimerization of Nab2 generated by RNA binding provides insight into its contribution to both poly(A) tail length determination and transcript compaction in Saccharomyces cerevisiae. Nucleic Acids Res. 45, 1529–1538. - PMC - PubMed
    1. Alpert T, Herzel L, and Neugebauer KM (2017). Perfect timing: splicing and transcription rates in living cells. Wiley Interdiscip. Rev. RNA 8, wrna.1401. - PMC - PubMed
    1. Ares M Jr., Grate L, and Pauling MH (1999). A handful of intron-containing genes produces the lion’s share of yeast mRNA. RNA 5, 1138–1139. - PMC - PubMed
    1. Baejen C, Torkler P, Gressel S, Essig K, Söding J, and Cramer P. (2014). Transcriptome maps of mRNP biogenesis factors define pre-mRNA recognition. Mol. Cell 55, 745–757. - PubMed
    1. Baejen C, Andreani J, Torkler P, Battaglia S, Schwalb B, Lidschreiber M, Maier KC, Boltendahl A, Rus P, Esslinger S, et al. (2017). Genome-wide Analysis of RNA Polymerase II Termination at Protein-Coding Genes. Mol. Cell 66, 38–49.e6. - PubMed

Publication types