. 2020 Oct 27;33(4):108326.
doi: 10.1016/j.celrep.2020.108326.

TET2-Loss-of-Function-Driven Clonal Hematopoiesis Exacerbates Experimental Insulin Resistance in Aging and Obesity

Affiliations

TET2-Loss-of-Function-Driven Clonal Hematopoiesis Exacerbates Experimental Insulin Resistance in Aging and Obesity

José J Fuster et al. Cell Rep. .

Abstract

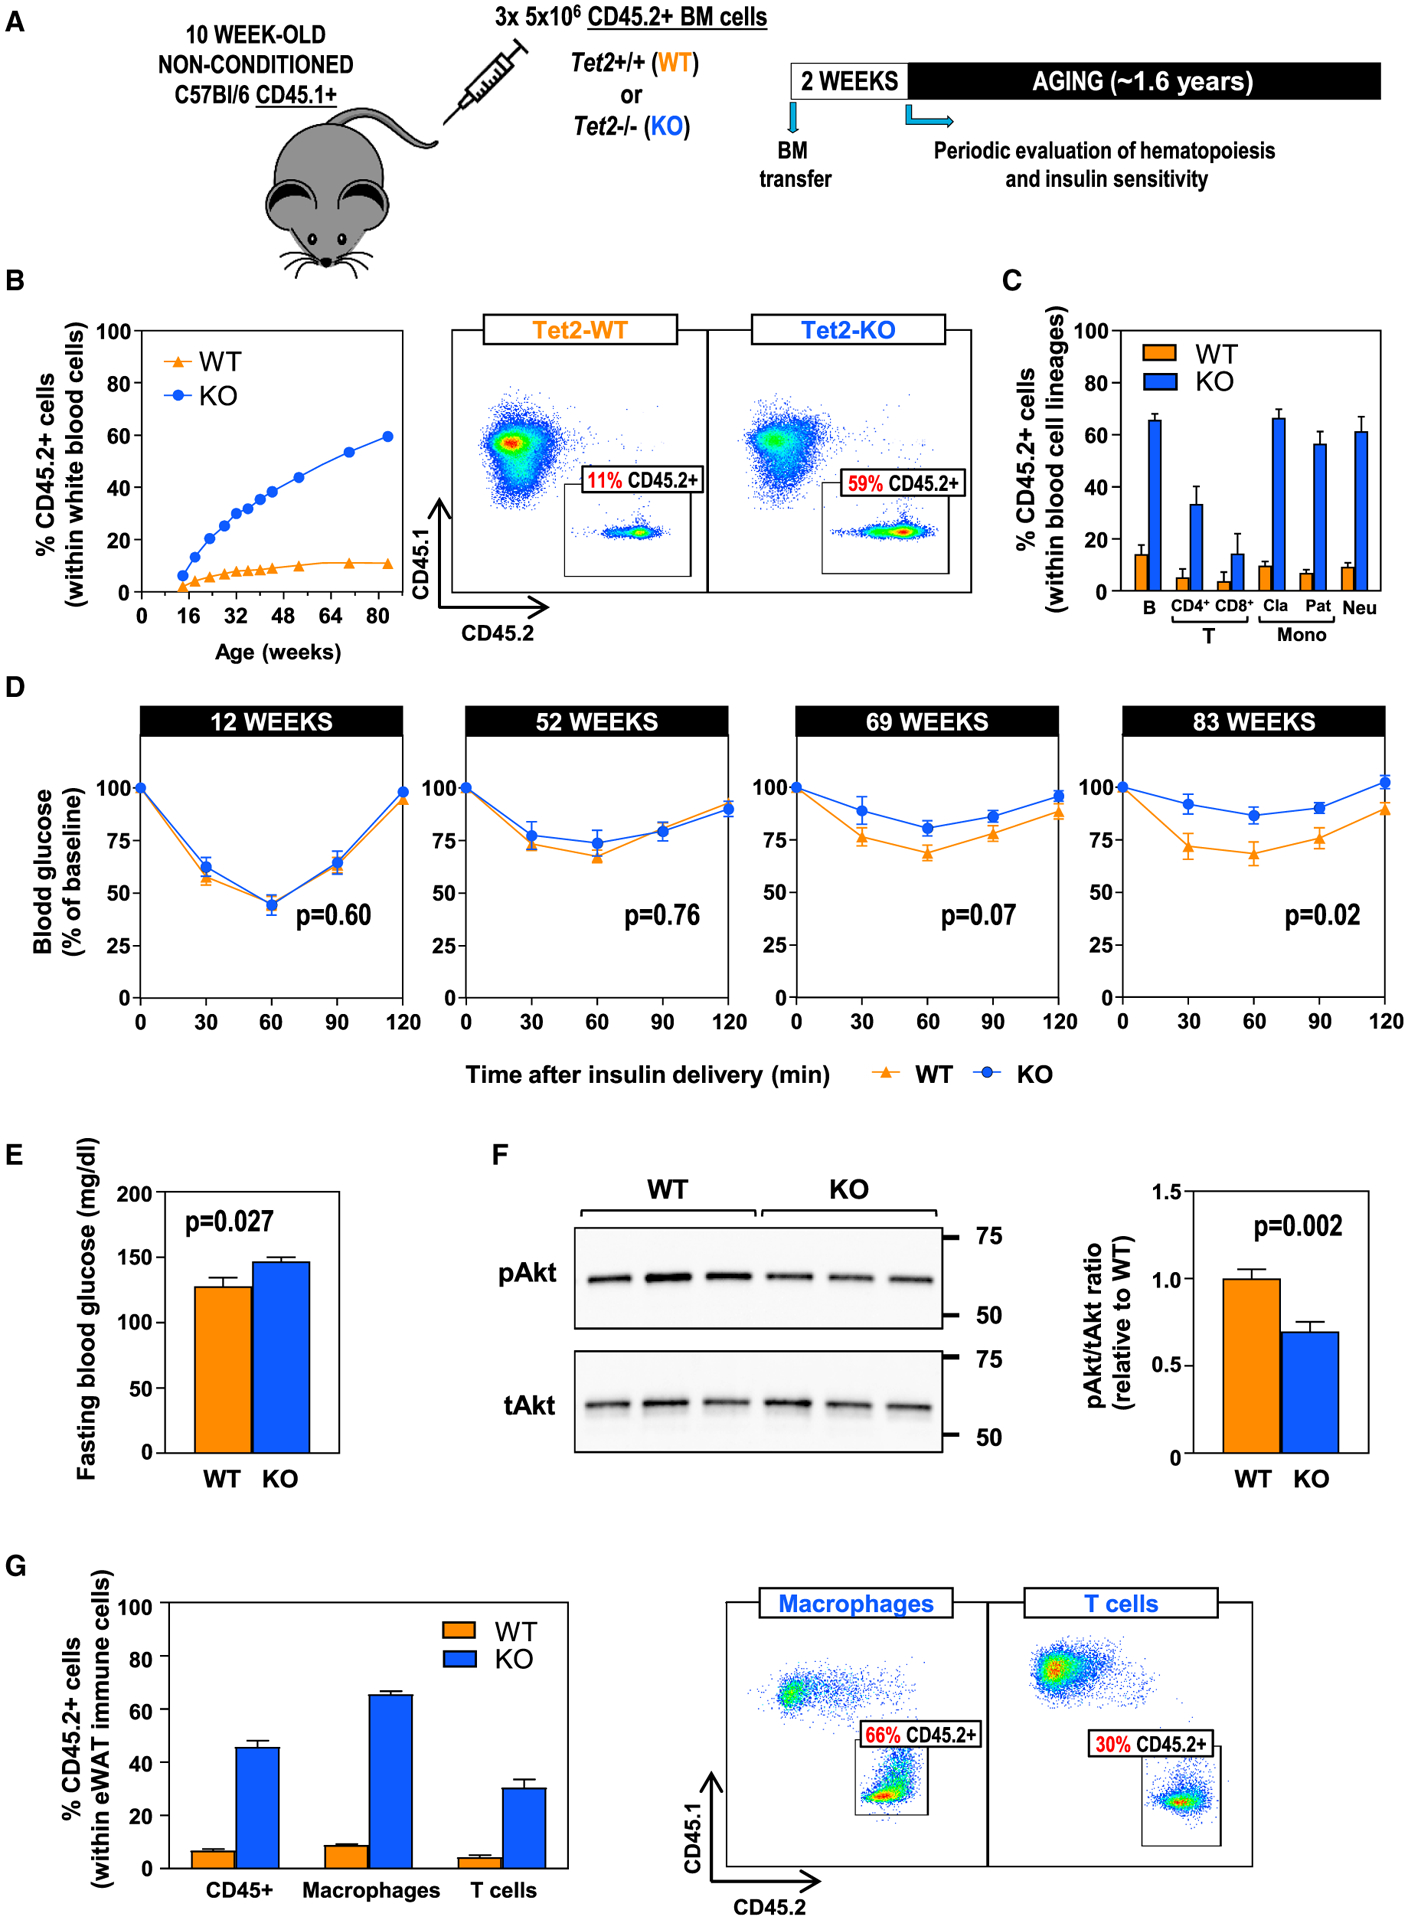
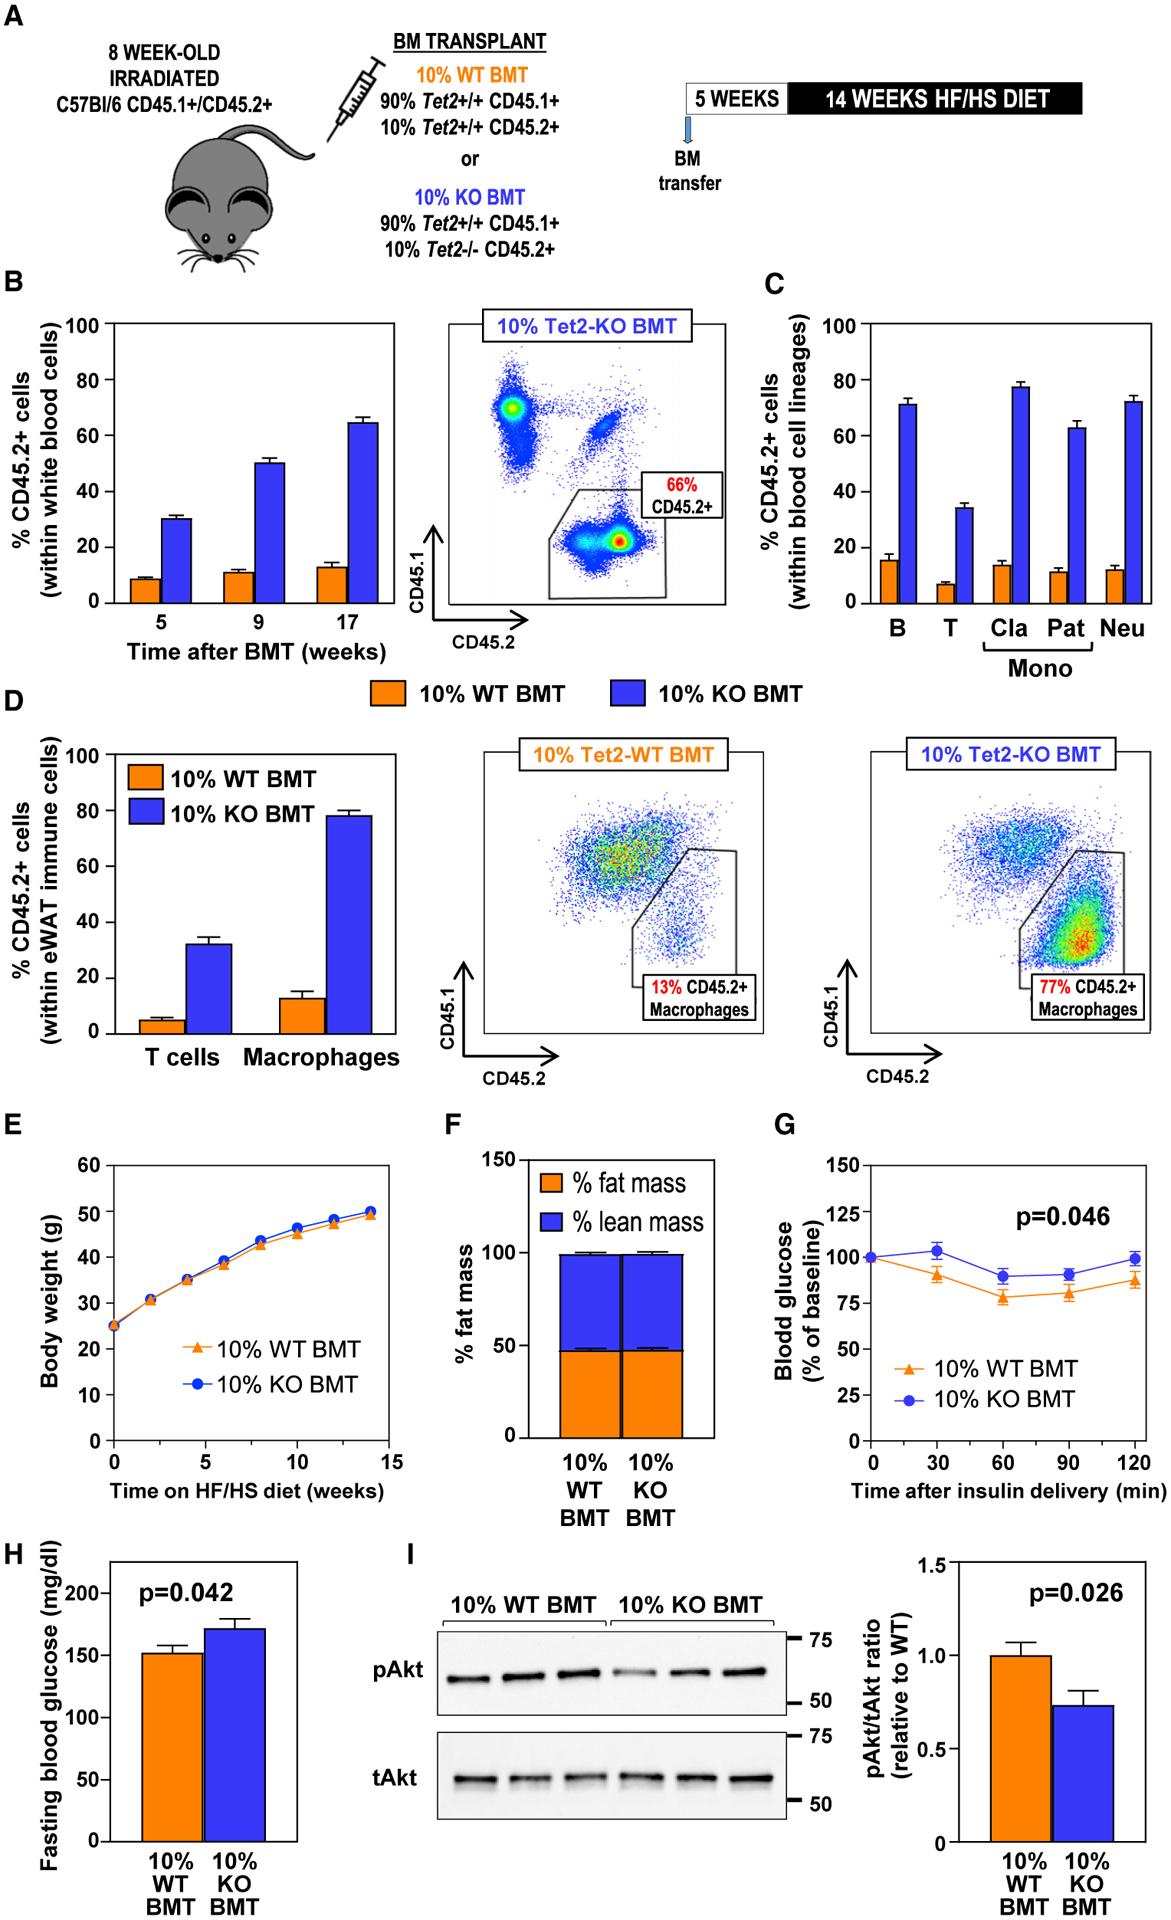
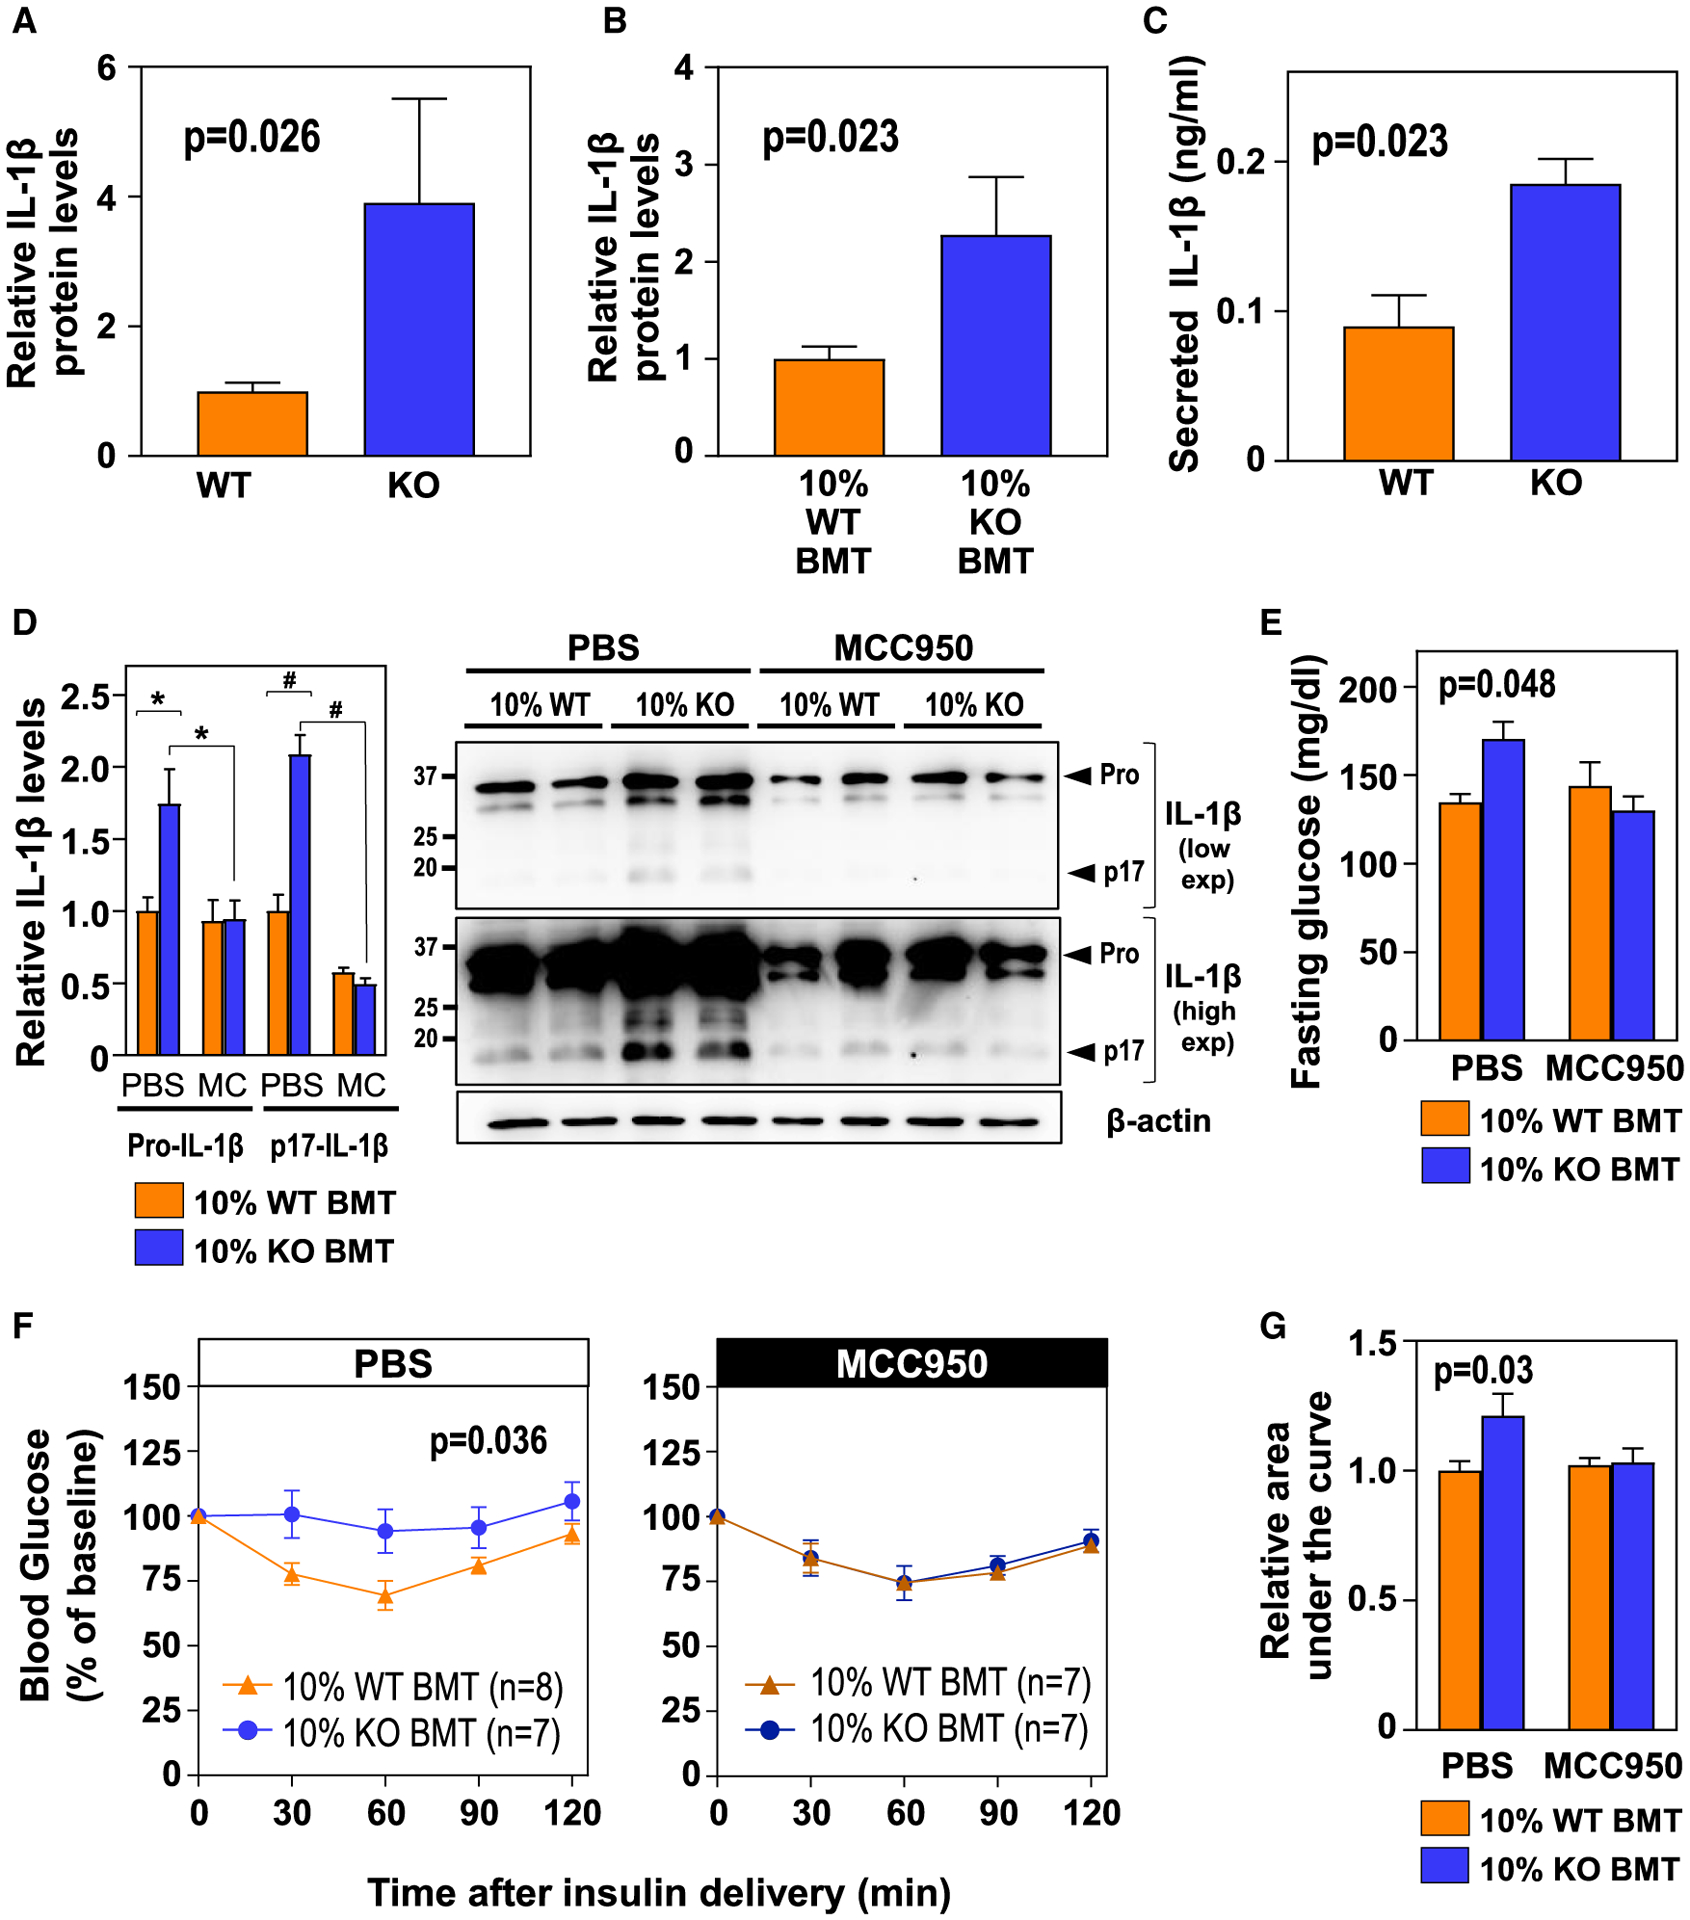
Human aging is frequently accompanied by the acquisition of somatic mutations in the hematopoietic system that induce clonal hematopoiesis, leading to the development of a mutant clone of hematopoietic progenitors and leukocytes. This somatic-mutation-driven clonal hematopoiesis has been associated with an increased incidence of cardiovascular disease and type 2 diabetes, but whether this epidemiological association reflects a direct, causal contribution of mutant hematopoietic and immune cells to age-related metabolic abnormalities remains unexplored. Here, we show that inactivating mutations in the epigenetic regulator TET2, which lead to clonal hematopoiesis, aggravate age- and obesity-related insulin resistance in mice. This metabolic dysfunction is paralleled by increased expression of the pro-inflammatory cytokine IL-1β in white adipose tissue, and it is suppressed by pharmacological inhibition of NLRP3 inflammasome-mediated IL-1β production. These findings support a causal contribution of somatic TET2 mutations to insulin resistance and type 2 diabetes.

Keywords: CHIP; IL-1β; TET2; adipose tissue; aging; clonal hematopoiesis; diabetes; insulin resistance; obesity; somatic mutations.


Conflict of interest statement

Declaration of Interests K.W. and J.J.F. are co-inventors on a patent related to the treatment of cardiometabolic diseases associated with somatic TET2 mutations. M.A.C. is co-founder and chief executive officer of Inflazome, a company developing drugs that target inflammasomes. These authors have no additional conflicts of interest. Other authors declare no competing interests.

Figures

Figure 1.
Figure 1.. TET2-Loss-of-Function-Driven CH Aggravates Insulin Resistance and Hyperglycemia in Aged Mice
Tet2−/− (KO) or +/+ (WT) CD45.1/CD45.2+ bone marrow (BM) cells were delivered via adoptive transfer to non-conditioned 10-week-old CD45.1+/CD45.2 recipient mice, which were then monitored until the age of 84 weeks (~1.6 years). n = 9 WT, 6 KO mice. (A) Summary of the adoptive BM transfer approach in non-conditioned, non-irradiated mice and the timeline of these studies. (B) Percentage of CD45.2+ cells in the WBC population in blood, evaluated by flow cytometry. Representative images of CD45.1/CD45.2 analysis in WBCs are shown. (C) Percentage of CD45.2+ cells within main WBC lineages at 82 weeks of age, measured by flow cytometry. Cla, classical; Pat, patrolling monocytes. (D) Insulin tolerance tests at different ages. (E) Fasting blood glucose levels at 83 weeks of age. (F) Western blot analysis of Akt phosphorylation in eWAT. (G) Percentage of CD45.2+ cells within F4/80+ macrophage and CD3+ T cell populations in eWAT, evaluated by flow cytometry. Representative cytometry dot plots are shown. Data are represented as mean ± SEM. See also Figure S1.
Figure 2.
Figure 2.. TET2-Loss-of-Function-Driven CH Aggravates Insulin Resistance and Hyperglycemia in Obese Mice
BMTs following whole-body irradiation were used to generate mice carrying 10% Tet2−/− (10% KO BMT) or +/+ (10% WT BMT) hematopoietic cells, which were then fed HF/HS diet for 14 weeks. n = 15 mice per BM genotype unless otherwise noted. (A) Summary of the competitive BM transplantation approach and the timeline of these studies. (B) Percentage of CD45.2+ cells in the WBC population in blood, evaluated by flow cytometry. A CD45.1/CD45.2 dot plot representative of 10% KO BMT mice is shown. (C) Percentage of CD45.2+ cells within main WBC lineages after 12 weeks on HF/HS diet (17 weeks post-BMT), measured by flow cytometry. (D) Percentage of CD45.2+ cells within F4/80+ macrophage and CD3+ T cell populations in eWAT after 14 weeks on HF/HS diet (19 weeks post-BMT), measured by flow cytometry (n = 7 for 10% WT BMT, n = 6 for 10% KO BMT mice). Representative dot plots of macrophage populations are shown. (E) Body weight. (F) Percentage of body fat and lean mass, assessed by magnetic resonance imaging (n = 11 mice per BM genotype). (G) Insulin tolerance tests. (H) Fasting blood glucose levels. (I) Western blot analysis of insulin-induced Akt phosphorylation in eWAT (n = 6 mice per BM genotype). Data are represented as mean ± SEM. See also Figure S2.
Figure 3.
Figure 3.. NLRP3-/IL-1β-Driven Inflammation Is Essential for the Effects of TET2-Loss-of-Function-Induced CH on Glucose Homeostasis
(A and B) ELISA analysis of IL-1β protein levels in eWAT in conditions of aging (A) (n = 9 WT, 6 KO BM) and HF/HS diet-induced obesity (B) (n = 11 mice per BM genotype). (C) ELISA analysis of secreted IL-1β protein levels in lipopolysaccharide (LPS)/IFNγ-primed peritoneal macrophages isolated from WT and KO mice (n = 3 biological replicates per genotype) and treated with ceramide for 20 h. (D) Western blot analysis of pro-IL-1β and mature (p17) IL-1β levels in eWAT stromal vascular fractions (n = 4 mice per BM genotype and experimental condition; *p < 0.03; #p < 0.0001, two-way ANOVA with Tukey’s multiple comparisons test). Representative blots after high or low exposure are shown. (E) Fasting blood glucose. (F) Insulin tolerance tests. (G) Area under the curve of insulin tolerance tests. In (D)–(G), HF/HS-diet-fed 10% WT BMT and 10% KO BMT mice received a continuous infusion of MCC950 or vehicle via subcutaneous osmotic pumps (n = 7–8 mice, as indicated in the figure, unless otherwise noted). Data are represented as mean ± SEM. See also Figure S3.

References

    1. Abplanalp WT, Mas-Peiro S, Cremer S, John D, Dimmeler S, and Zeiher AM (2020). Association of Clonal Hematopoiesis of Indeterminate Potential With Inflammatory Gene Expression in Patients With Severe Degenerative Aortic Valve Stenosis or Chronic Postischemic Heart Failure. JAMA Cardiol. Published online July 8, 2020. In press. 10.1001/jamacardio.2020.2468. - DOI - PMC - PubMed
    1. Arends CM, Galan-Sousa J, Hoyer K, Chan W, Jäger M, Yoshida K, Seemann R, Noerenberg D, Waldhueter N, Fleischer-Notter H, et al. (2018). Hematopoietic lineage distribution and evolutionary dynamics of clonal hematopoiesis. Leukemia 32, 1908–1919. - PubMed
    1. Bick AG, Weinstock JS, Nandakumar SK, Fulco CP, Leventhal MJ, Bao EL, Nasser J, Zekavat SM, Szeto MD, Laurie C, et al. (2019). Inherited Causes of Clonal Hematopoiesis of Indeterminate Potential in TOPMed Whole Genomes. bioRxiv. 10.1101/782748. - DOI
    1. Bonnefond A, Skrobek B, Lobbens S, Eury E, Thuillier D, Cauchi S, Lantieri O, Balkau B, Riboli E, Marre M, et al. (2013). Association between large detectable clonal mosaicism and type 2 diabetes with vascular complications. Nat. Genet 45, 1040–1043. - PubMed
    1. Buscarlet M, Provost S, Zada YF, Barhdadi A, Bourgoin V, Lépine G, Mollica L, Szuber N, Dubé MP, and Busque L (2017). DNMT3A and TET2 dominate clonal hematopoiesis and demonstrate benign phenotypes and different genetic predispositions. Blood 130, 753–762. - PubMed

Publication types