. 2020 Oct 23;21(21):7869.
doi: 10.3390/ijms21217869.

Identification of a Reliable Biomarker Profile for the Diagnosis of Gaucher Disease Type 1 Patients Using a Mass Spectrometry-Based Metabolomic Approach

Affiliations

Identification of a Reliable Biomarker Profile for the Diagnosis of Gaucher Disease Type 1 Patients Using a Mass Spectrometry-Based Metabolomic Approach

Iskren Menkovic et al. Int J Mol Sci. .

Abstract

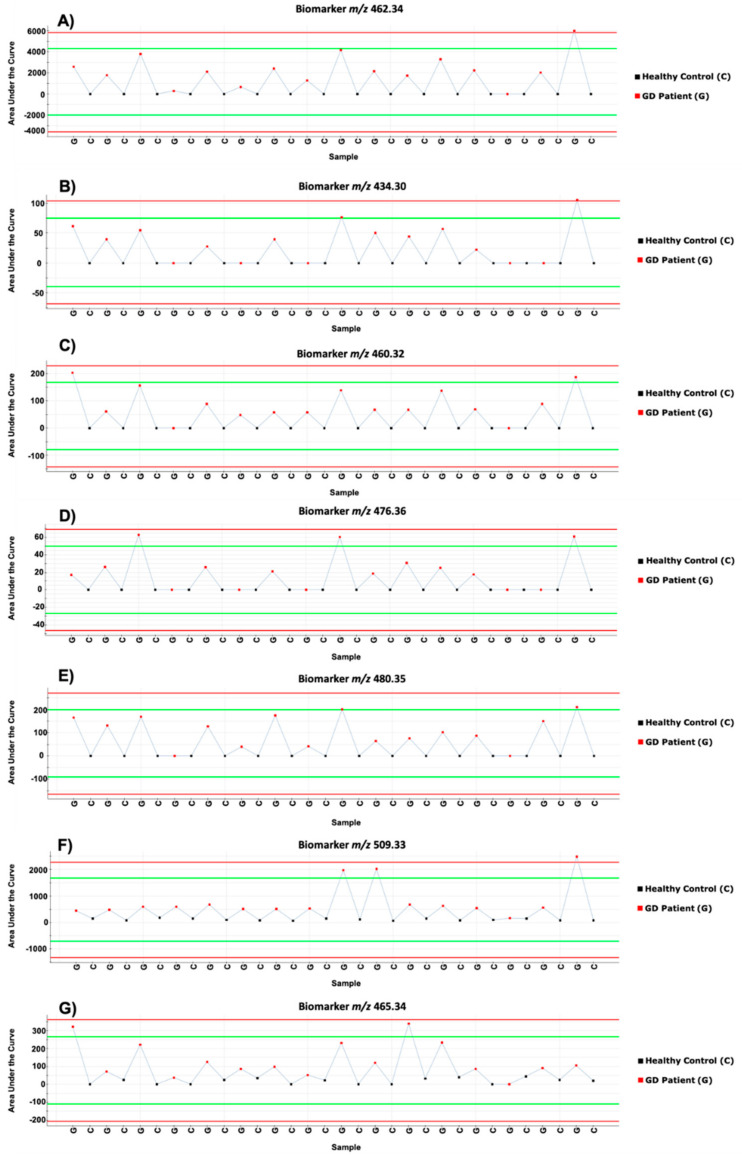
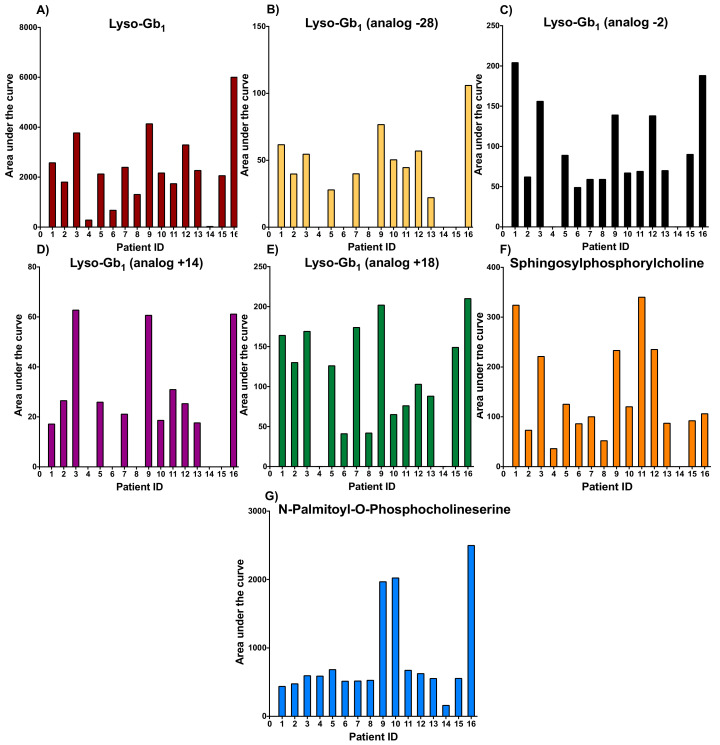
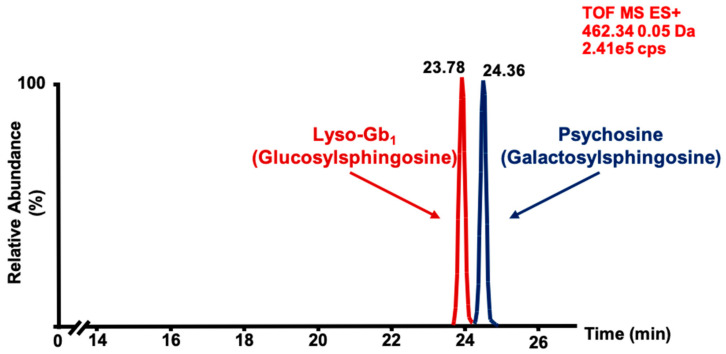
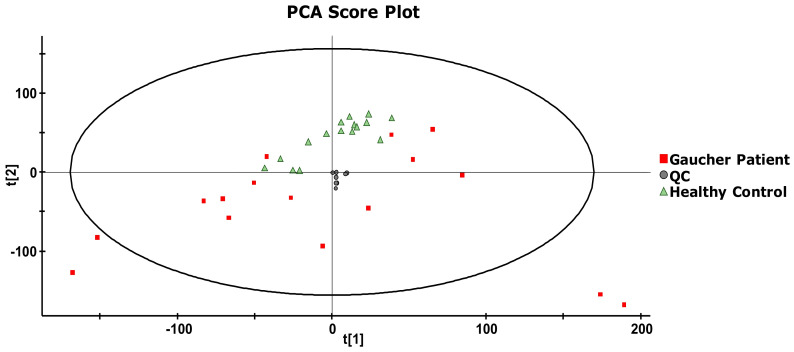
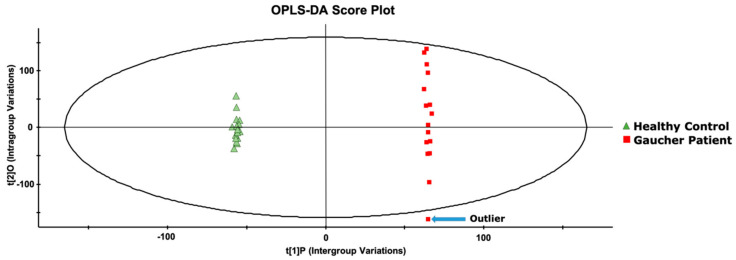
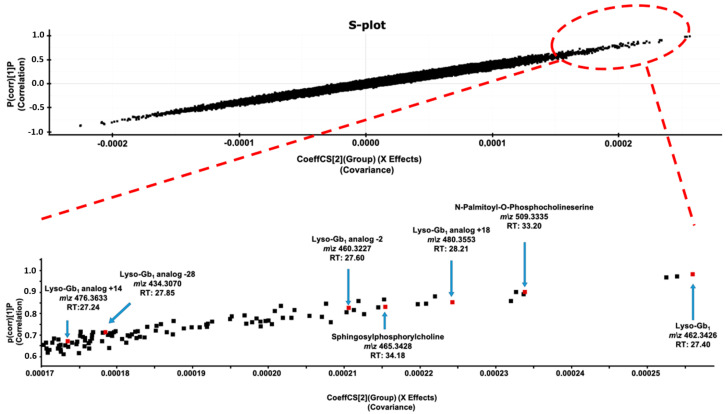
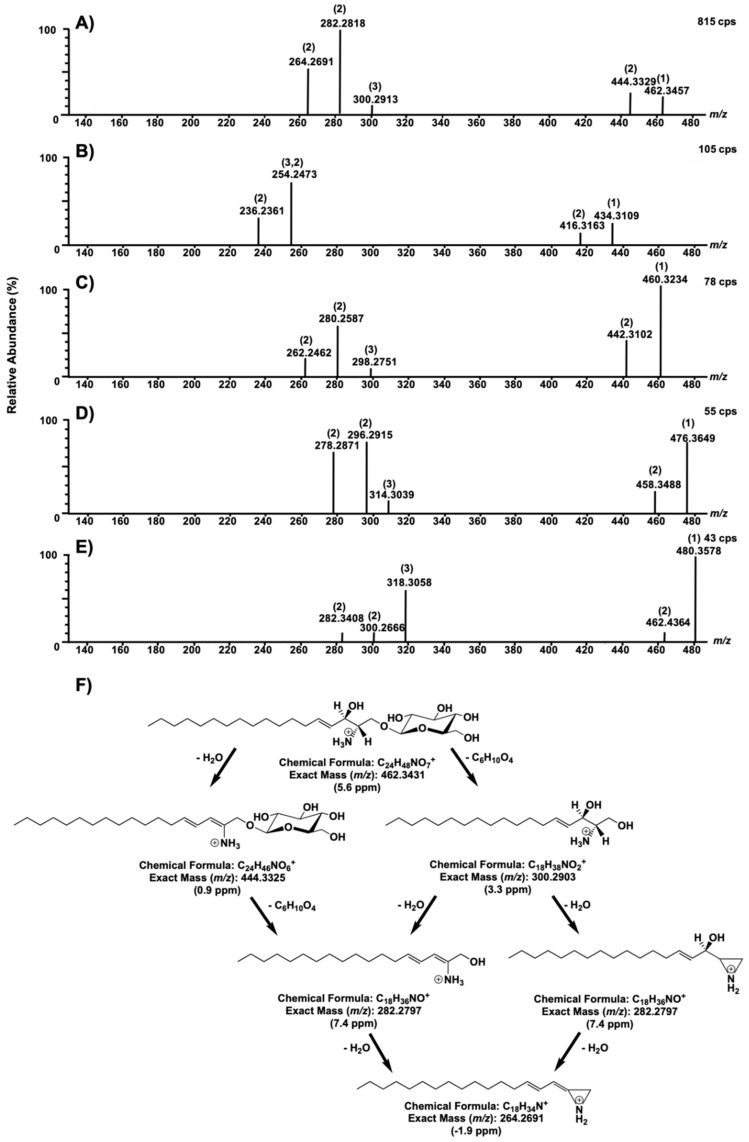
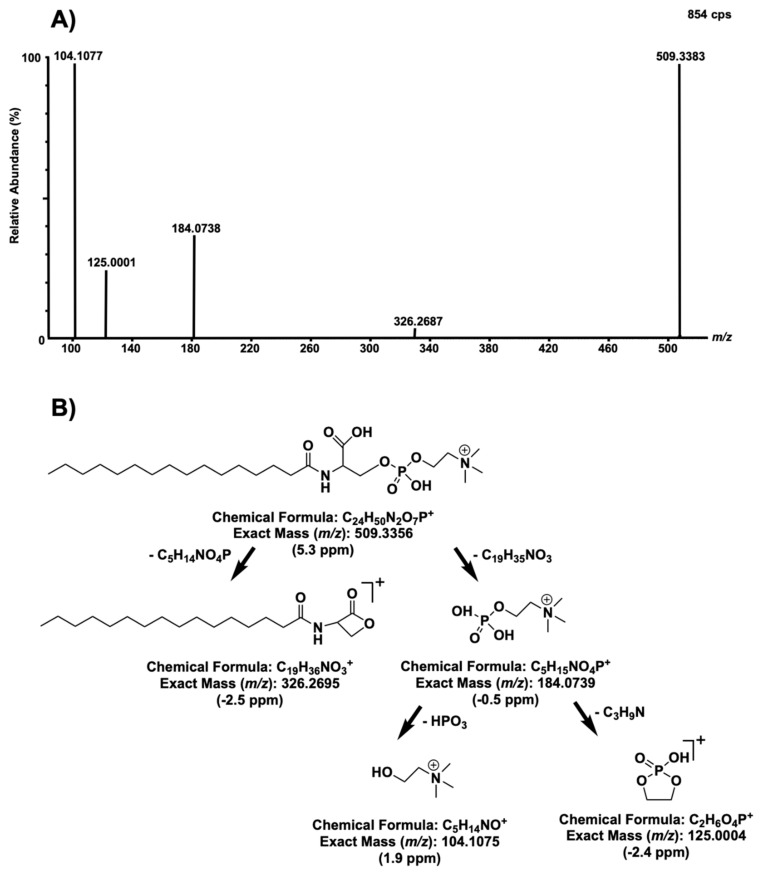
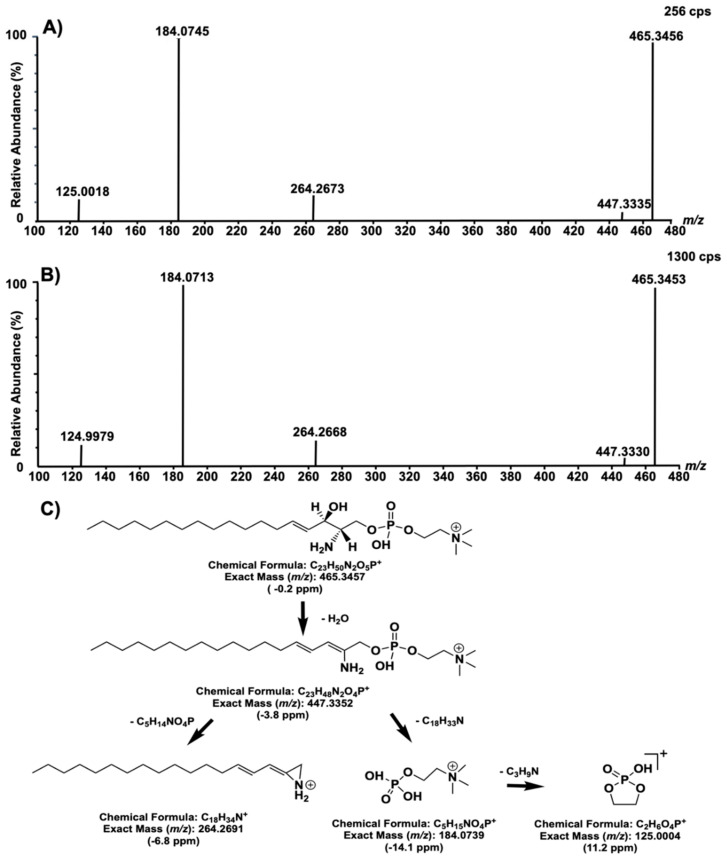
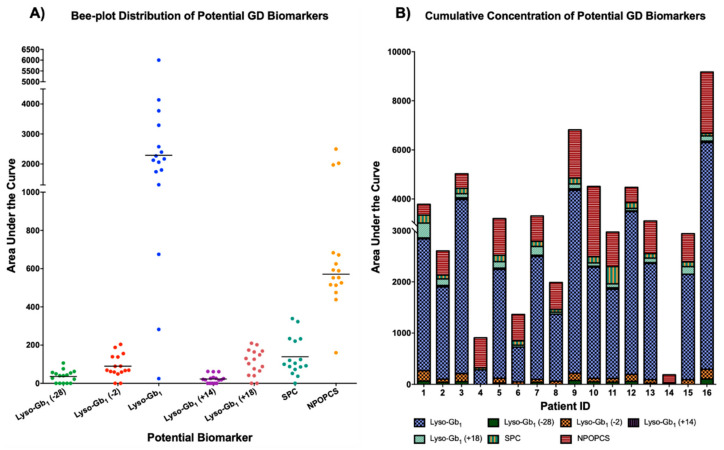
Gaucher disease (GD) is a rare autosomal recessive multisystemic lysosomal storage disorder presenting a marked phenotypic and genotypic variability. GD is caused by a deficiency in the glucocerebrosidase enzyme. The diagnosis of GD remains challenging because of the large clinical spectrum associated with the disease. Moreover, GD biomarkers are often not sensitive enough and can be subject to polymorphic variations. The main objective of this study was to perform a metabolomic study using an ultra-performance liquid chromatography system coupled to a time-of-flight mass spectrometer to identify novel GD biomarkers. Following the analysis of plasma samples from patients with GD, and age- and gender-matched control samples, supervised statistical analyses were used to find the best molecules to differentiate the two groups. Targeted biomarkers were structurally elucidated using accurate mass measurements and tandem mass spectrometry. This metabolomic study was successful in highlighting seven biomarkers associated with GD. Fragmentation tests revealed that these latter biomarkers were lyso-Gb1 (glucosylsphingosine) and four related analogs (with the following modifications on the sphingosine moiety: -C2H4, -H2, -H2+O, and +H2O), sphingosylphosphorylcholine, and N-palmitoyl-O-phosphocholineserine. Based on the plasma biomarker distribution, we suggest the evaluation of this GD biomarker profile, which might facilitate early diagnosis, monitoring, and follow-up of patients.

Keywords: Gaucher disease; N-palmitoyl-O-phosphocholineserine; biomarkers; glucosylsphingosine (lyso-Gb1); lyso-Gb1 analogs; mass spectrometry; metabolomics; plasma; sphingosylphosphorylcholine.


Conflict of interest statement

F.E.M. was paid for an advisory board by Sanofi-Genzyme. A.A. and G.-É.R. declare that they have no conflict of interest. I.M. received a student stipend from Shire/Takeda Pharmaceutical for this project. M.B. received a salary. C.A.-B. received research grants and honoraria from Shire/Takeda Pharmaceutical.

Figures

Figure A1
Figure A1
Trend plot charts for lyso-Gb1 (A), lyso-Gb1 analogs −28 Da (B), −2 Da (C), + 14 Da (D), +18 Da (E), N-palmitoyl-O-phosphocholineserine (F), and sphingosylphosphorylcholine (G). G = Gaucher patient, C = healthy control.
Figure A2
Figure A2
Areas under the curve are shown for lyso-Gb1 (A), lyso-Gb1 analog +18 Da (B), lyso-Gb1 analog −2 Da (C), lyso-Gb1 analog −28 Da (D), lyso-Gb1 analog +14 Da (E), sphingosylphosphorylcholine (F), and N-palmitoyl-O-phosphocholineserine (G). These biomarkers were not detected in control samples.
Figure 1
Figure 1
Chromatographic separation of glucosylsphingosine (lyso-Gb1; 5 μg on column, retention time: 23.78 min) and psychosine (5 μg on column, retention time: 24.36 min) commercial standards analyzed by time-of-flight mass spectrometry (MS-TOF) with a mass window of 0.05 Da. Peaks associated with each compound were confirmed by individual analysis of each standard. ES+ = positive electrospray.
Figure 2
Figure 2
A principal component analysis (PCA) score plot derived from the metabolomic analysis of plasma samples from untreated Gaucher disease (GD) patients (n = 16), age- and gender-matched healthy controls (n = 16), and quality control (QC) replicate injections (n = 8). The ellipse corresponds to the Hotelling T2 range with a significance level of p = 0.05.
Figure 3
Figure 3
An orthogonal partial least-square discriminant analysis (OPLS-DA) score plot, resulting from the metabolomic analysis of plasma samples from untreated GD patients (n = 16) and age- and gender-matched healthy controls (n = 16). The ellipse corresponds to the Hotelling T2 range with a significance level of p = 0.05.
Figure 4
Figure 4
S-plot showing the correlation in function of the covariance for the metabolites used to segregate GD patients and age- and gender-matched healthy controls in the OPLS-DA score plot. Specific positions of biomarkers (lyso-Gb1; lyso-Gb1 analogs −28 Da, −2 Da, +14 Da, and +18 Da; N-palmitoyl-O-phosphocholineserine; and sphingosylphosphorylcholine) are zoomed in the lower part of the figure. Exact positions are indicated by a red square and an arrow. Accurate mass measured, as well as their respective retention times (RTs) in min, are indicated for each biomarker.
Figure 5
Figure 5
Fragmentation test results for compounds with m/z 462.3426 (A), 460.3227 (B), 480.3553 (C), 434.3074 (D), and 76.3633 (E), with a collision energy ramp of 10–30 V. In each spectrum, (1) corresponds to the precursor ion, (2) indicates a loss of a water molecule from the previous fragment, and (3) represents a loss of a molecule of glucose. A fragmentation mechanism for lyso-Gb1 (m/z 462.3227) is proposed in (F).
Figure 6
Figure 6
Fragmentation tests of compounds with m/z 509 with a collision energy ramp of 10–25 V (A) and a fragmentation mechanism previously proposed by Sidhu et al. [30], with theoretical masses and measured mass errors in part per million (ppm) (B).
Figure 7
Figure 7
Fragmentation test results of compounds with m/z 465, with a collision energy ramp of 15–25 V (A). Fragmentation test results of a standard of sphingosylphosphorylcholine (d18:1) (10 μg on column) (B) and a proposed fragmentation mechanism with theoretical and experimental exact mass differences (C).
Figure 8
Figure 8
Bee-plot distribution (A) and cumulative concentrations (B) of potential GD biomarkers highlighted in the current metabolomic study. Sphingosylphosphorylcholine (SPC) and N-palmitoyl-O-phosphocholineserine (NPOPCS). The line in (A) represents the median value for each potential biomarker. All potential GD biomarkers were not observed in healthy controls.

References

    1. Smith L., Mullin S., Schapira A. Insights into the structural biology of Gaucher disease. Pt BExp. Neurol. 2017;298:180–190. doi: 10.1016/j.expneurol.2017.09.010. - DOI - PubMed
    1. Aerts J.M., Kuo C.L., Lelieveld L.T., Boer D.E., Lienden M.J.V.D., Overkleeft H.S., Artola M. Glycosphingolipids and lysosomal storage disorders as illustrated by Gaucher disease. Curr. Opin. Chem. Biol. 2019;53:204–215. doi: 10.1016/j.cbpa.2019.10.006. - DOI - PubMed
    1. Andrade-Campos M., Alfonso P., Irun P., Armstrong J., Calvo C., Dalmau J., Domingo M.R., Barbera J.L., Cano H., Fernandez-Galán M.A., et al. Diagnosis features of pediatric Gaucher disease patients in the era of enzymatic therapy, a national-base study from the Spanish Registry of Gaucher disease. Orphanet. J. Rare Dis. 2017;12 doi: 10.1186/s13023-017-0627-z. - DOI - PMC - PubMed
    1. Zeid N., Stauffer C., Yang A., Naik H., Fierro L., Ganesh J., Balwani M. The N370S/R496H genotype in type 1 Gaucher disease—Natural history and implications for pre-symptomatic diagnosis and counseling. Mol. Genet. Metab. Rep. 2020;22:100567. doi: 10.1016/j.ymgmr.2020.100567. - DOI - PMC - PubMed
    1. Stirnemann J., Belmatoug N., Camou F., Serratrice C., Froissart R., Caillaud C., Levade T., Astudillo L., Serratrice J., Brassier A., et al. Review of Gaucher disease pathophysiology, clinical presentation and treatments. Int. J. Mol. Sci. 2017;18:441. doi: 10.3390/ijms18020441. - DOI - PMC - PubMed

MeSH terms