. 2020 Oct 23;2(4):442-465.
doi: 10.3390/clockssleep2040033.

Differential Gene Expression in Brain and Liver Tissue of Wistar Rats after Rapid Eye Movement Sleep Deprivation

Affiliations

Differential Gene Expression in Brain and Liver Tissue of Wistar Rats after Rapid Eye Movement Sleep Deprivation

Atul Pandey et al. Clocks Sleep. .

Abstract

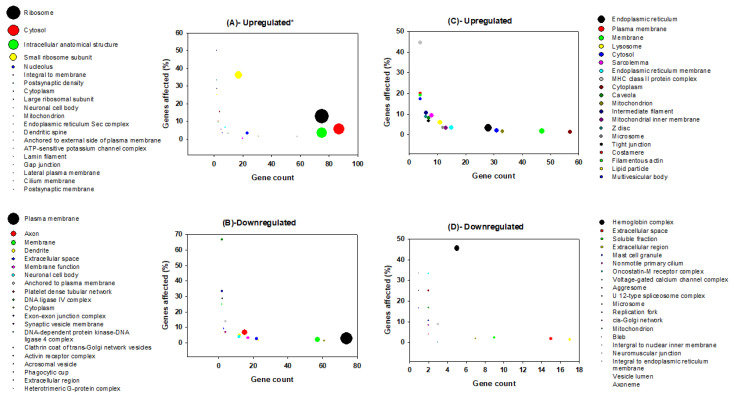
Sleep is essential for the survival of most living beings. Numerous researchers have identified a series of genes that are thought to regulate "sleep-state" or the "deprived state". As sleep has a significant effect on physiology, we believe that lack of total sleep, or particularly rapid eye movement (REM) sleep, for a prolonged period would have a profound impact on various body tissues. Therefore, using the microarray method, we sought to determine which genes and processes are affected in the brain and liver of rats following nine days of REM sleep deprivation. Our findings showed that REM sleep deprivation affected a total of 652 genes in the brain and 426 genes in the liver. Only 23 genes were affected commonly, 10 oppositely, and 13 similarly across brain and liver tissue. Our results suggest that nine-day REM sleep deprivation differentially affects genes and processes in the brain and liver of rats.

Keywords: differential gene expression in brain and liver tissue; microarray analysis; rapid eye movement sleep deprivation.


Conflict of interest statement

The authors have no conflict of interest and all funding and scientific contributions are fully recognized.

Figures

Figure 1
Figure 1
Relative expression of six candidate genes from the brain and liver tissue using real-time PCR and Microarray: (A) the comparative expression of genes in the brain; (B) the comparative expression of genes in the liver. Relative gene expressions were normalized by comparison with the expression of the Glyceraldehyde 3-phosphate dehydrogenase (GAPDH) gene, while results were analyzed using the 2−ΔΔCT method. For each gene, all RT-qPCRs used five biological replicates, with three technological replicates per experiment. The non-parametric Mann–Whitney U test was used to compare the pairwise expression of the microarray and the RT-PCR expression for the respective genes. We evaluated the normality of the data using the Kolmogorov–Smirnov normality test. Error bars indicate a ±SE value. * p < 0.05, ** p < 0.001, ns = non-significant.
Figure 2
Figure 2
Venn diagram of the differentially expressed genes in the liver and brain after rapid eye movement sleep deprivation for nine days in rats. The Venn diagram shows overlapping genes of the UR_Liver (up-regulated liver); UR_Brain (up-regulated brain); DR_Liver (down-regulated liver); and DR_Brain (down-regulated brain). Numbers in separate shaded panels reflects the genes typically affected in both tissues, in a similar or opposite direction.
Figure 3
Figure 3
Graphical representation of GO terms from biological processes for genes that are up-regulated in the brain (A), down-regulated in the brain (B), up-regulated in the liver (C), and down-regulated in the liver (D) following rapid eye movements sleep deprivation in rats. The x-axis shows gene count, and the y-axis shows the percentage of genes affected for respective node. The bubble size represents the log transformed p-value [Y = −0.5*log(Y)] of the respective biological processes. A bigger bubble size indicates a more significantly affected given process, and thus, a lower p-value. The top 20 terms are displayed for each category.
Figure 4
Figure 4
Graphical representation of molecular function terms for genes that are up-regulated in the brain (A), down-regulated in the brain (B), up-regulated in the liver (C), and down-regulated in the liver (D) following rapid eye movements sleep deprivation in rats. The x-axis shows gene count, and the y-axis shows the percentage of genes affected. The bubble size represents the log transformed p-value [Y = −0.5*log(Y)] of the respective molecular function. A bigger bubble size indicates a more significantly affected given process, and thus, a lower p-value. The top 20 terms are displayed for each category.
Figure 5
Figure 5
Graphical representation of cellular component terms for genes that are up-regulated in the brain (A), down-regulated in the brain (B), up-regulated in the liver (C), and down-regulated in the liver (D) following rapid eye movement sleep deprivation in rats. The x-axis shows gene count, and the y-axis shows the percentage of genes affected. The bubble size represents the log transformed p-value [Y = −0.5*log(Y)] of the respective cellular component. To fit the bubble size, the p-value in 5A* was normalized with formula [Y = −0.5*log(Y)/2]. A bigger bubble size indicates a more significantly affected given process, and thus, a lower p-value. The top 20 terms are displayed for each category.
Figure 6
Figure 6
Kyoto Encyclopedia of Genes and Genomes (KEGG) pathways affected by rapid eye movement sleep deprivation in rats in the brain. The x-axis depicts the number of nodes affected and the y-axis shows the p-value (p < 0.05). Color coding indicates the total number of database nodes evaluated. The size of the circle indicates the direction of change.
Figure 7
Figure 7
KEGG pathways affected by rapid eye movement sleep deprivation in rats in the liver: (A) up-regulated, (B) down-regulated. The x-axis depicts the number of nodes affected and the y-axis shows the * p-value (p < 0.05). Color coding reflects the total number of associated nodes.
Figure 8
Figure 8
Network view of GO term association. Network plots of the top filtered GO terms, depicting the degree of connectivity within and between terms of enriched genes that are up-regulated in the brain, up-regulated in the liver, down-regulated in the brain, and down-regulated in the liver. The circles-legend at the bottom of each left-hand corner indicates the number of genes that are enriched for a given term. Connecting lines indicate a significant degree of semantic similarity between terms. Biological process (A), cellular component (B), and molecular function (C). GO terms were filtered (level = 3) to reduce redundancy and capture major categorical themes prior to visualization of connectivity in network plots, which were designed in R using the cluster Profiler package. Plots of filtered GO terms contained the top 20 significant categories, respectively, per subject cluster.

Similar articles

Cited by

References

    1. Kelly M.L., Collin S.P., Hemmi J.M., Lesku J.A. Evidence for Sleep in Sharks and Rays: Behavioural, Physiological, and Evolutionary Considerations. Brain Behav. Evol. 2020 doi: 10.1159/000504123. - DOI - PubMed
    1. Hendricks J.C., Finn S.M., Panckeri K.A., Chavkin J., Williams J.A., Sehgal A., Pack A.I. Rest in Drosophila is a sleep-like state. Neuron. 2000;25:129–138. doi: 10.1016/S0896-6273(00)80877-6. - DOI - PubMed
    1. Shaw P.J., Cirelli C., Greensoan R.J., Tononi G. Correlates of sleep and waking in Drosophila melanogaster. Science. 2000;287:1834–1837. doi: 10.1126/science.287.5459.1834. - DOI - PubMed
    1. Zimmerman J.E., Naidoo N., Raizen D.M., Pack A.I. Conservation of sleep: Insights from non-mammalian model systems. Trends Neurosci. 2008;31:371–376. doi: 10.1016/j.tins.2008.05.001. - DOI - PMC - PubMed
    1. Yokogawa T., Marin W., Faraco J., Pézeron G., Appelbaum L., Zhang J., Rosa F., Mourrain F., Mignot E. Characterization of sleep in zebrafish and insomnia in hypocretin receptor mutants. PLoS Biol. 2007;5:2379–2397. doi: 10.1371/journal.pbio.0050277. - DOI - PMC - PubMed