. 2020 Oct 24;18(11):527.
doi: 10.3390/md18110527.

Disulfides from the Brown Alga Dictyopteris membranacea Suppress M1 Macrophage Activation by Inducing AKT and Suppressing MAPK/ERK Signaling Pathways

Affiliations

Disulfides from the Brown Alga Dictyopteris membranacea Suppress M1 Macrophage Activation by Inducing AKT and Suppressing MAPK/ERK Signaling Pathways

Maria G Daskalaki et al. Mar Drugs. .

Abstract

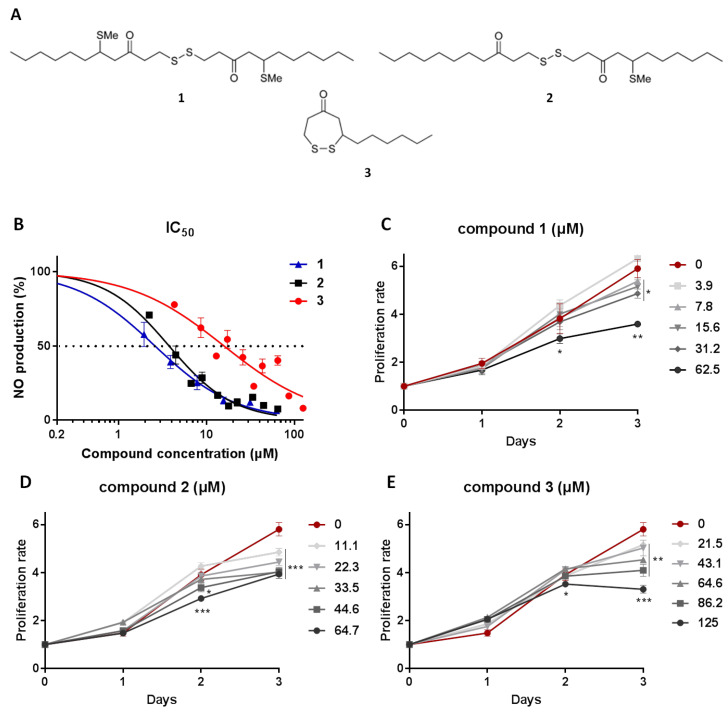
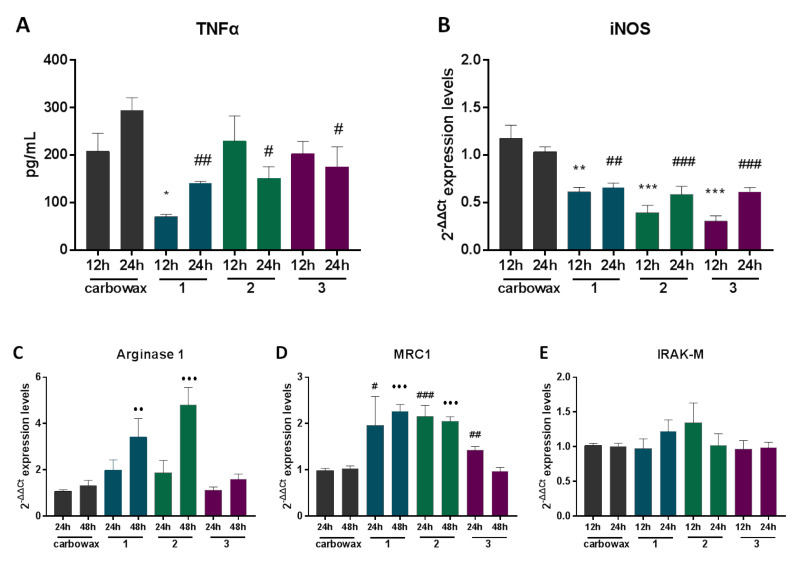
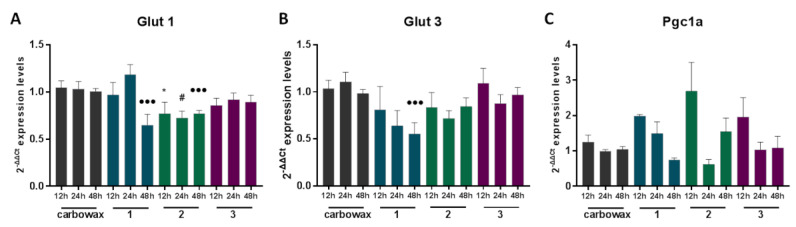
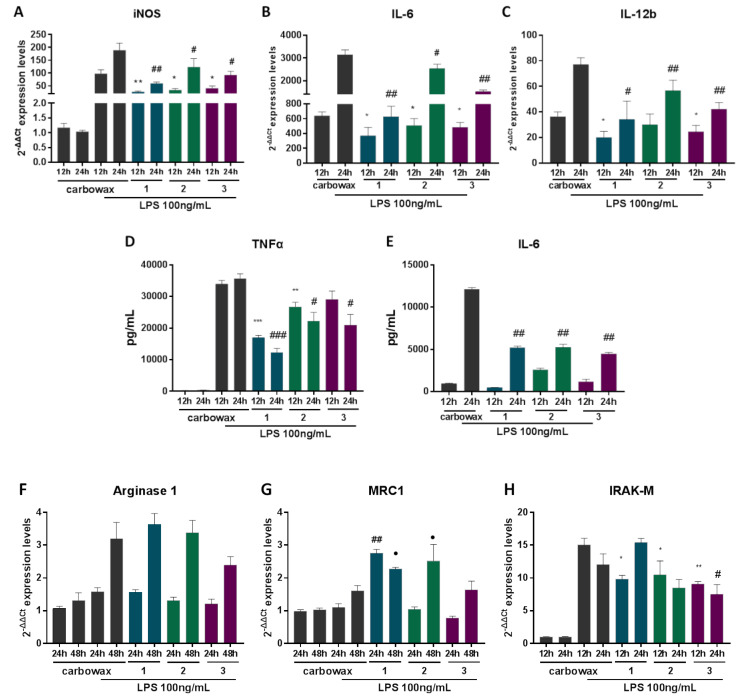
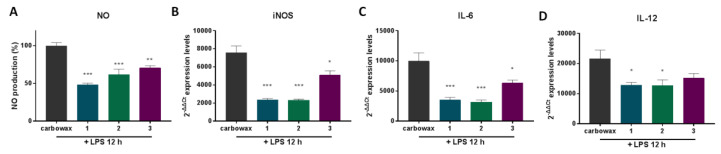
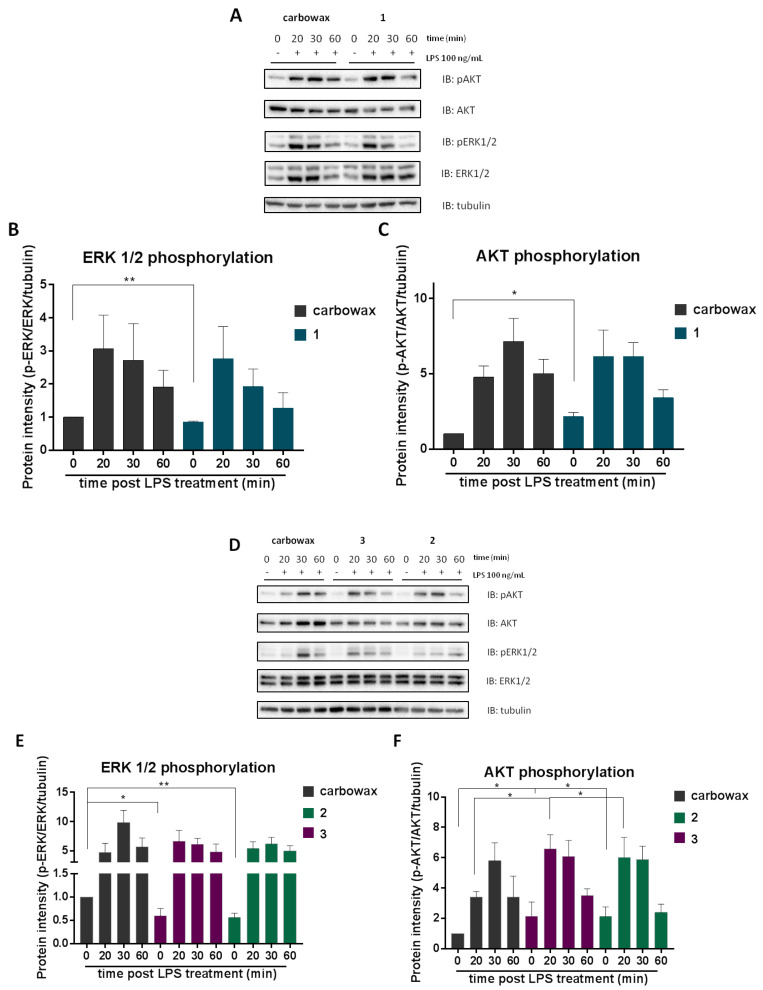
Inflammation is part of the organism's response to deleterious stimuli, such as pathogens, damaged cells, or irritants. Macrophages orchestrate the inflammatory response obtaining different activation phenotypes broadly defined as M1 (pro-inflammatory) or M2 (homeostatic) phenotypes, which contribute to pathogen elimination or disease pathogenesis. The type and magnitude of the response of macrophages are shaped by endogenous and exogenous factors and can be affected by nutrients or therapeutic agents. Multiple studies have shown that natural products possess immunomodulatory properties and that marine algae contain products with such action. We have previously shown that disulfides isolated from Dictyopteris membranacea suppress nitric oxide (NO) production from activated macrophages, suggesting potential anti-inflammatory actions. In this study, we investigated the anti-inflammatory mechanism of action of bis(5-methylthio-3-oxo-undecyl) disulfide (1), 5-methylthio-1-(3-oxo-undecyl) disulfanylundecan-3-one (2) and 3-hexyl-4,5-dithiocycloheptanone (3). Our results showed that all three compounds inhibited M1 activation of macrophages by down regulating the production of pro-inflammatory cytokines TNFα, IL-6 and IL-12, suppressed the expression of the NO converting enzyme iNOS, and enhanced expression of the M2 activation markers Arginase1 and MRC1. Moreover, disulfides 1 and 2 suppressed the expression of glucose transporters GLUT1 and GLUT3, suggesting that compounds 1 and 2 may affect cell metabolism. We showed that this was due to AKT/MAPK/ERK signaling pathway modulation and specifically by elevated AKT phosphorylation and MAPK/ERK signal transduction reduction. Hence, disulfides 1-3 can be considered as potent candidates for the development of novel anti-inflammatory molecules with homeostatic properties.

Keywords: AKT; Dictyopteris membranacea; ERK1/2; IL-6; TNFα; disulfides; iNOS; inflammation; macrophages.


Conflict of interest statement

The authors declare no conflict of interest.

Figures

Figure 1
Figure 1
(A) Chemical structures of bis(5-methylthio-3-oxo-undecyl) disulfide (1), 5-methylthio-1-(3-oxo-undecyl)disulfanylundecan-3-one (2) and 3-hexyl-4,5-dithiocycloheptanone (3) isolated from D. membranacea. (B) IC50 values of 13; measuring compound concentration resulting in 50% inhibition of NO production in RAW 264.7 cells. (C–E) Cytostatic activity of 13; evaluating compound effect on the proliferation rate of RAW 264.7 cells. Proliferation rate was measured using MTT tetrazolium dye, it was normalized to initial cells plated and compared to cells treated with carbowax 400 0.1% v/v + 0.01% ethanol. Statistical analysis was carried out using a Mann–Whitney unpaired t-test in Graphpad Prism 7.0 and graphs represent mean ± SEM (* indicates p < 0.05, ** indicates p < 0.01, *** indicates p < 0.001).
Figure 2
Figure 2
The effect of metabolites 13 on the expression of inflammatory markers in RAW 264.7 cells post 12, 24 and 48 h incubation with the indicated compound. (A) TNFα production was measured using ELISA in cell culture supernatants and (B) inducible nitric oxide synthase (iNOS) (C) Arginase 1 (D) MRC1 and (E) IRAK-M mRNA levels were identified using real time PCR. All treatments have been compared to carbowax 400 0.1% v/v + 0.01% ethanol treated cells in each timepoint indicated. Disulfide concentration used for 1 and 2 treatments was 15.62 μΜ and for 3 it was 31.25 μΜ. Statistical analysis was carried out using a Mann–Whitney unpaired t-test in Graphpad Prism 7.0 and graphs represent mean ± SEM and (* indicates p < 0.05, ** indicates p < 0.01, *** indicates p < 0.001 compared to carbowax 12 h, # indicates p < 0.05, ## indicates p < 0.01, ### indicates p < 0.001 compared to carbowax 24 h, ● indicates p < 0.05, ●● indicates p < 0.01, ●●● indicates p < 0.001 compared to carbowax 48 h).
Figure 3
Figure 3
The effect of metabolites 13 on the expression of metabolic genes in RAW 264.7 macrophages following 12, 24 h and 48 h incubation with the indicated disulfide. (A) Glut 1, (B) Glut 3 and (C) Pgc1a expression was measured using real time PCR. All treatments have been compared to carbowax 400 0.1% v/v + 0.01% ethanol treated cells in each timepoint indicated. Disulfide concentration used for 1 and 2 treatments was 15.62 μΜ and for 3 it was 31.25 μΜ. Statistical analysis was carried out using a Mann–Whitney unpaired t-test in Graphpad Prism 7.0, and the graphs represent mean ± SEM (* indicates p < 0.05, ** indicates p < 0.01, *** indicates p < 0.001 compared to carbowax 12 h, # indicates p < 0.05, ## indicates p < 0.01, ### indicates p < 0.001 compared to carbowax 24 h, ● indicates p < 0.05, ●● indicates p < 0.01, ●●● indicates p < 0.001 compared to carbowax 48 h).
Figure 4
Figure 4
The effect of metabolites 13 on the expression of inflammatory genes in RAW 264.7 macrophages post LPS stimulation for 12, 24 and 48 h and simultaneous incubation with the respective disulfide. Pro-inflammatory markers (A) iNOS, (B) IL-6, (C) IL-12 mRNA expression levels were measured using real time PCR. (D) TNFα and (E) IL-6 production was determined using ELISA in cell culture supernatant. Markers of M2 macrophages (F) Arginase 1, (G) MRC1 and (H) IRAK-M expression levels were determined using real time PCR. All treatments have been compared to carbowax 400 0.1% v/v + 0.01% ethanol treated cells in each time point indicated. Disulfide concentration used for 1 and 2 treatments was 15.62 μΜ and for 3 it was 31.25 μΜ. Statistical analysis was carried out using a Mann–Whitney unpaired t-test in Graphpad Prism 7.0 and graphs represent mean ± SEM (* indicates p < 0.05, ** indicates p < 0.01, *** indicates p < 0.001 compared to carbowax 12 h, # indicates p < 0.05, ## indicates p < 0.01, ### indicates p < 0.001 compared to carbowax 24 h, ● indicates p < 0.05, ●● indicates p < 0.01, ●●● indicates p < 0.001 compared to carbowax 48 h).
Figure 5
Figure 5
The effect of metabolites 13 on the expression of pro-inflammatory genes in primary thioglacolate-elicited macrophages post LPS stimulation for 12 h and simultaneous stimulation with the respective disulfide. (A) NO release in cell culture supernatant was measured using Griess reaction, (B) iNOS, (C) IL-6 and (D) IL-12 mRNA levels were quantified using real-time PCR. All treatments have been compared to carbowax 400 0.1% v/v + 0.01% ethanol treated cells in each time point indicated. Disulfide concentration used for 1 and 2 treatments was 15.62 μΜ and for 3 it was 31.25 μΜ. Statistical analysis was carried out using a Mann–Whitney unpaired t-test in Graphpad Prism 7.0 and graphs represent mean ± SEM (* indicates p < 0.05, ** indicates p < 0.01, *** indicates p < 0.001 compared to carbowax 12 h).
Figure 6
Figure 6
Monitoring the effect of metabolites 13 on AKT/ERK/MAPK signaling. RAW 264.7 macrophages were pre-incubated for 1 h with the respective disulfide and then activated for 20, 30 or 60 min with 100 ng/mL LPS. Cell lysates were electrophoresed in Western blot (A,D). Analysis of band intensity was quantified using Image Lab and compared to carbowax 400 0.1% v/v + 0.01% ethanol treated cells (B,C) and (E,F). Disulfide concentrations used for 1 and 2 treatments was 15.62 μΜ and for 3 it was 31.25 μΜ. Statistical analysis was carried out using a Mann–Whitney unpaired t-test in Graphpad Prism 7.0 and graphs represent mean ± SEM (* indicates p < 0.05, ** indicates p < 0.01, *** indicates p < 0.001 compared to carbowax 400).

References

    1. Lim J.J., Grinstein S., Roth Z. Diversity and Versatility of Phagocytosis: Roles in Innate Immunity, Tissue Remodeling, and Homeostasis. Front. Cell. Infect. Microbiol. 2017;7:191. doi: 10.3389/fcimb.2017.00191. - DOI - PMC - PubMed
    1. Hirayama D., Iida T., Nakase H. The Phagocytic Function of Macrophage-Enforcing Innate Immunity and Tissue Homeostasis. Int. J. Mol. Sci. 2017;19:92. doi: 10.3390/ijms19010092. - DOI - PMC - PubMed
    1. Murray P.J., Allen J.E., Biswas S.K., Fisher E.A., Gilroy D.W., Goerdt S., Gordon S., Hamilton J.A., Ivashkiv L.B., Lawrence T., et al. Macrophage Activation and Polarization: Nomenclature and Experimental Guidelines. Immunity. 2014;41:14–20. doi: 10.1016/j.immuni.2014.06.008. - DOI - PMC - PubMed
    1. Vergadi E., Ieronymaki E., Lyroni K., Vaporidi K., Tsatsanis C. Akt signaling pathway in macrophage activation and m1/m2 polarization. J. Immunol. 2017;198:1006–1014. doi: 10.4049/jimmunol.1601515. - DOI - PubMed
    1. Sarbassov D.D., Ali S.M., Sengupta S., Sheen J.-H., Hsu P.P., Bagley A.F., Markhard A.L., Sabatini D.M. Prolonged Rapamycin Treatment Inhibits mTORC2 Assembly and Akt/PKB. Mol. Cell. 2006;22:159–168. doi: 10.1016/j.molcel.2006.03.029. - DOI - PubMed

MeSH terms

Substances

LinkOut - more resources