
Household paired design reduces variance and increases power in multi-city gut microbiome study in multiple sclerosis

The iMSMS Consortium. Mult Scler. .

Abstract

Background: Evidence for a role of human gut microbiota in multiple sclerosis (MS) risk is mounting, yet large variability is seen across studies. This is, in part, due to the lack of standardization of study protocols, sample collection methods, and sequencing approaches.

Objective: This study aims to address the effect of a household experimental design, sample collection, and sequencing approaches in a gut microbiome study in MS subjects from a multi-city study population.

Methods: We analyzed 128 MS patient and cohabiting healthy control pairs from the International MS Microbiome Study (iMSMS). A total of 1005 snap-frozen or desiccated Q-tip stool samples were collected and evaluated using 16S and shallow whole-metagenome shotgun sequencing.

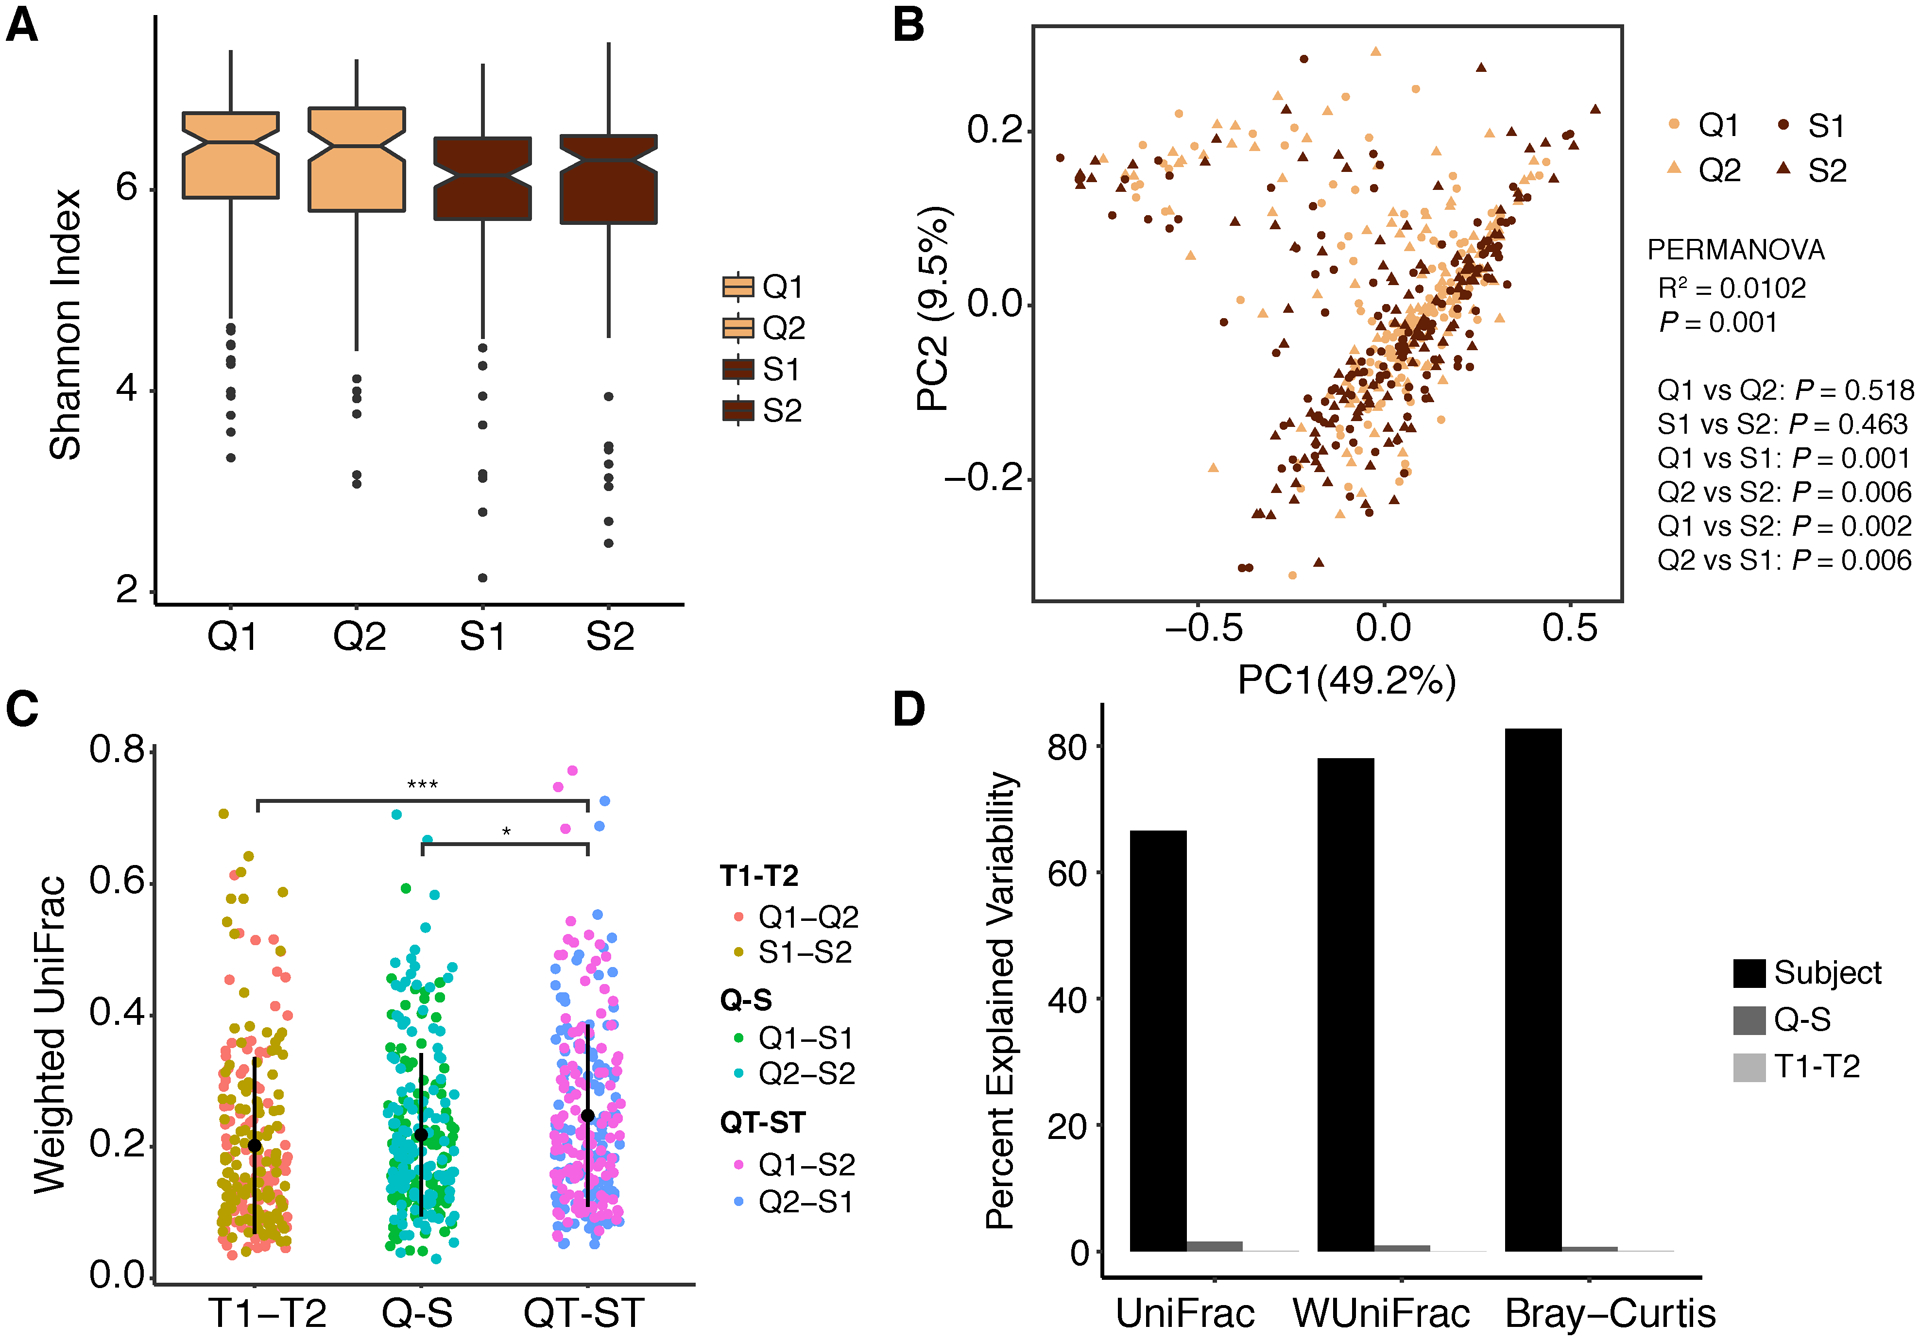
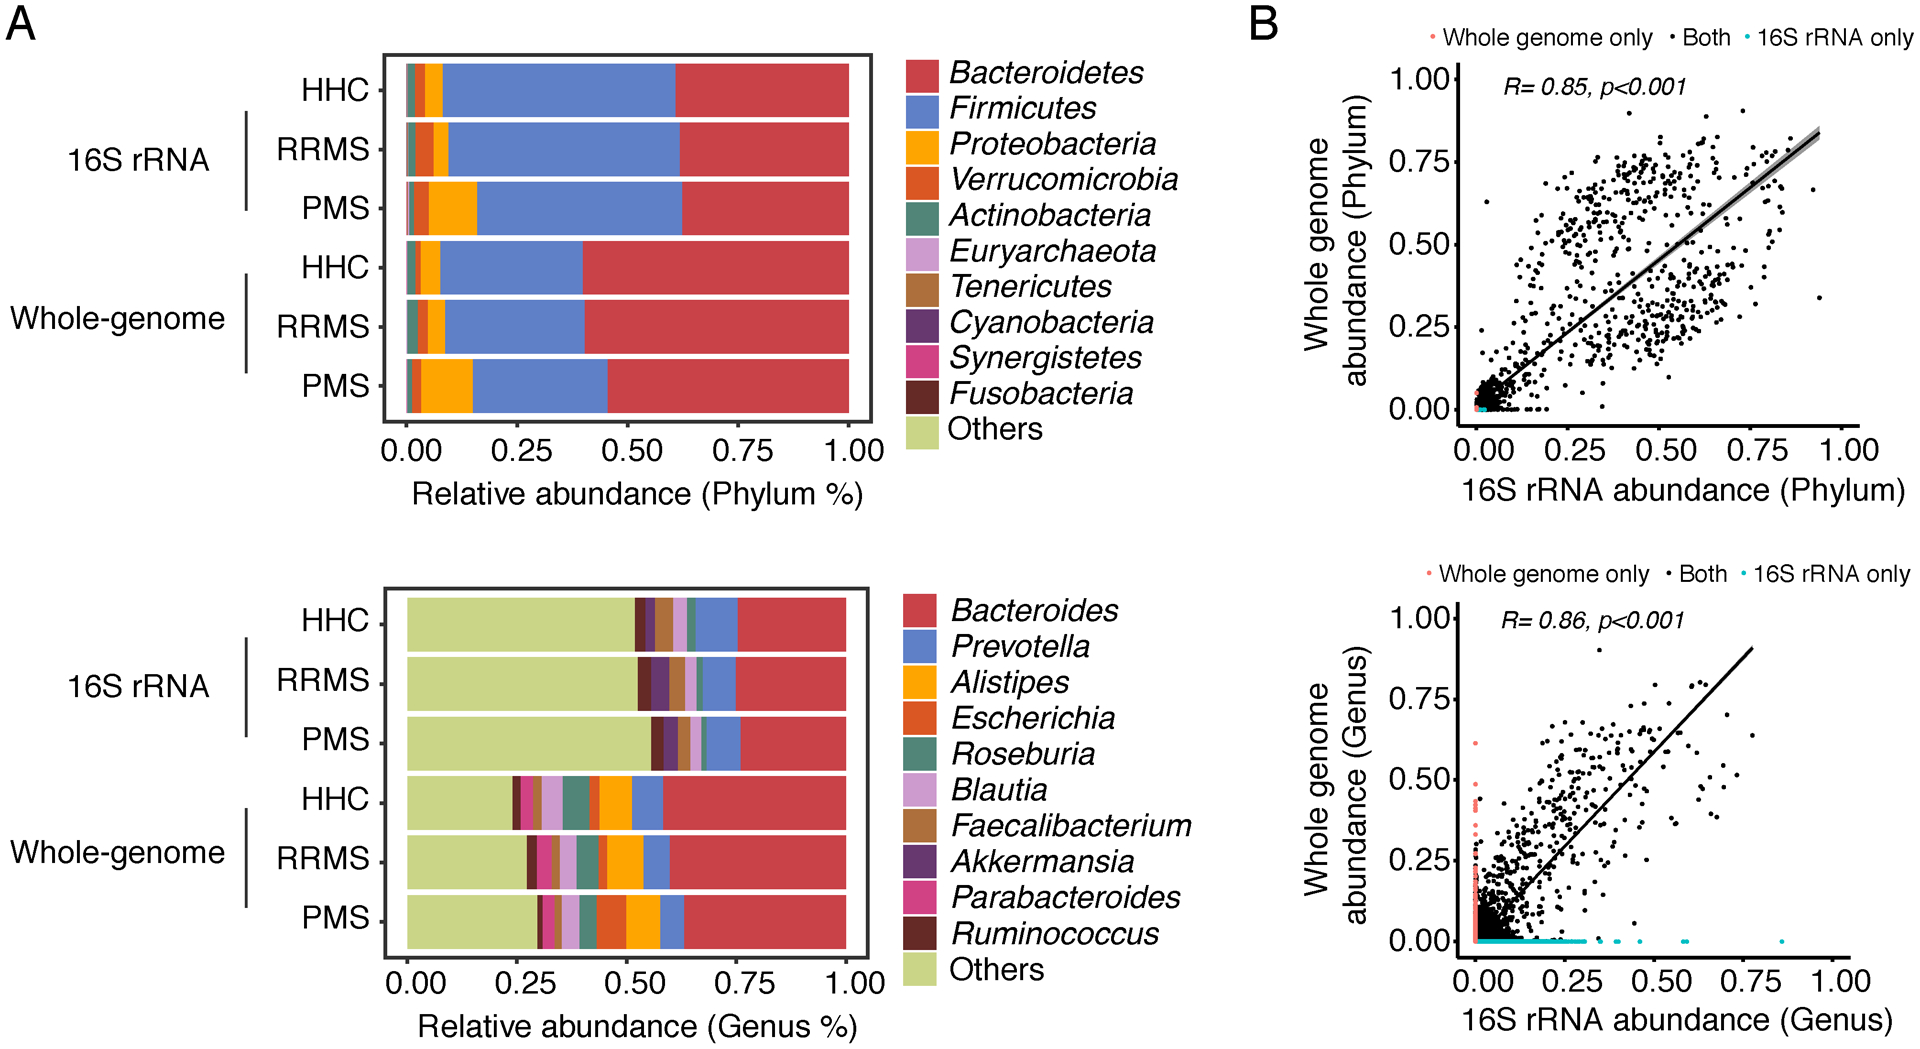
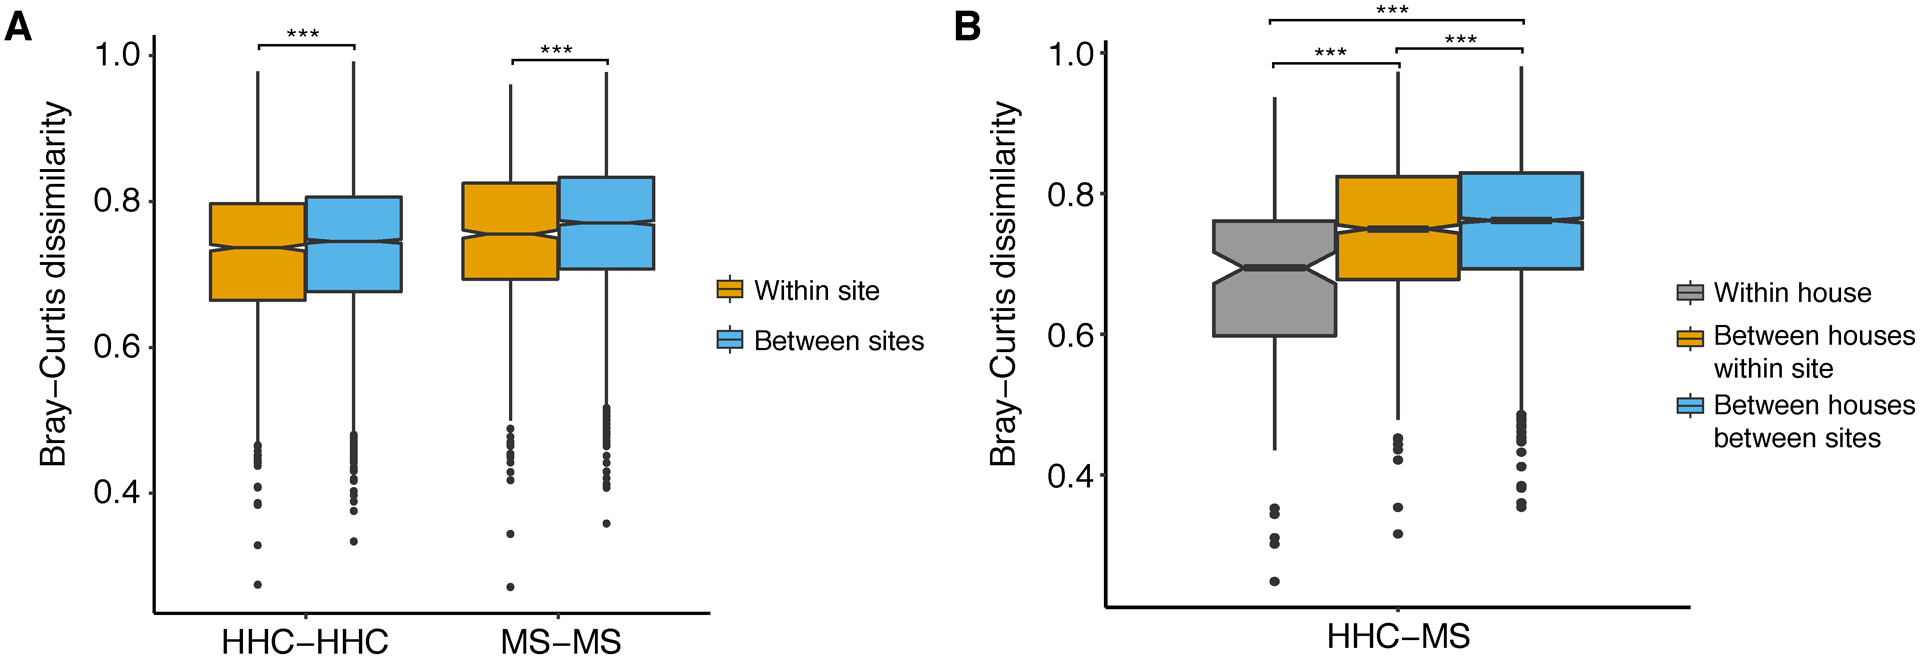
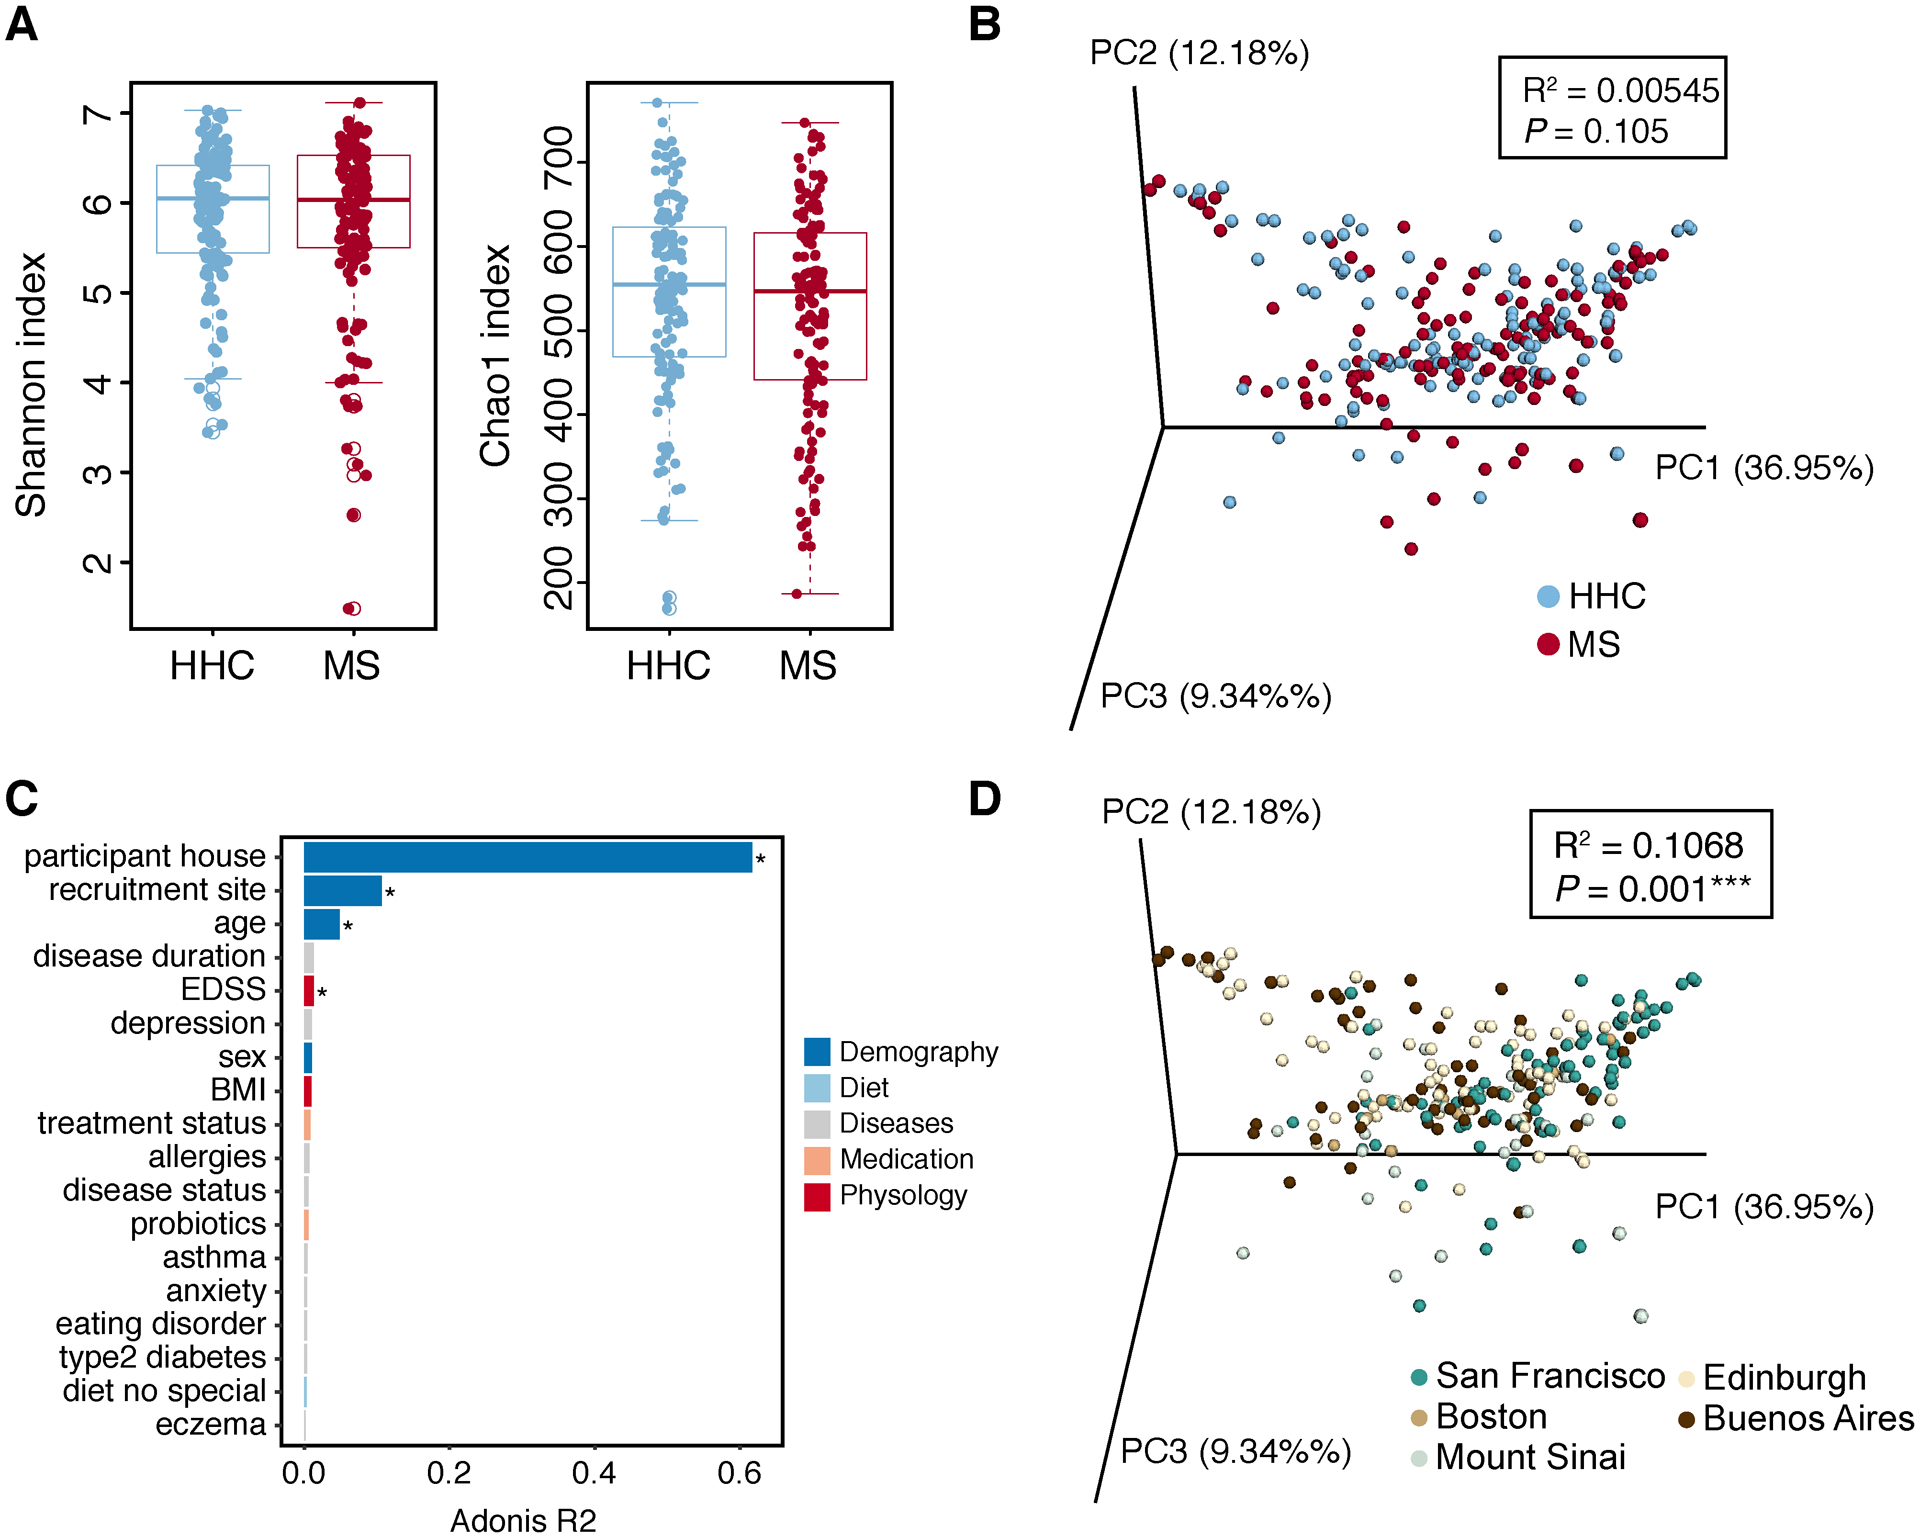
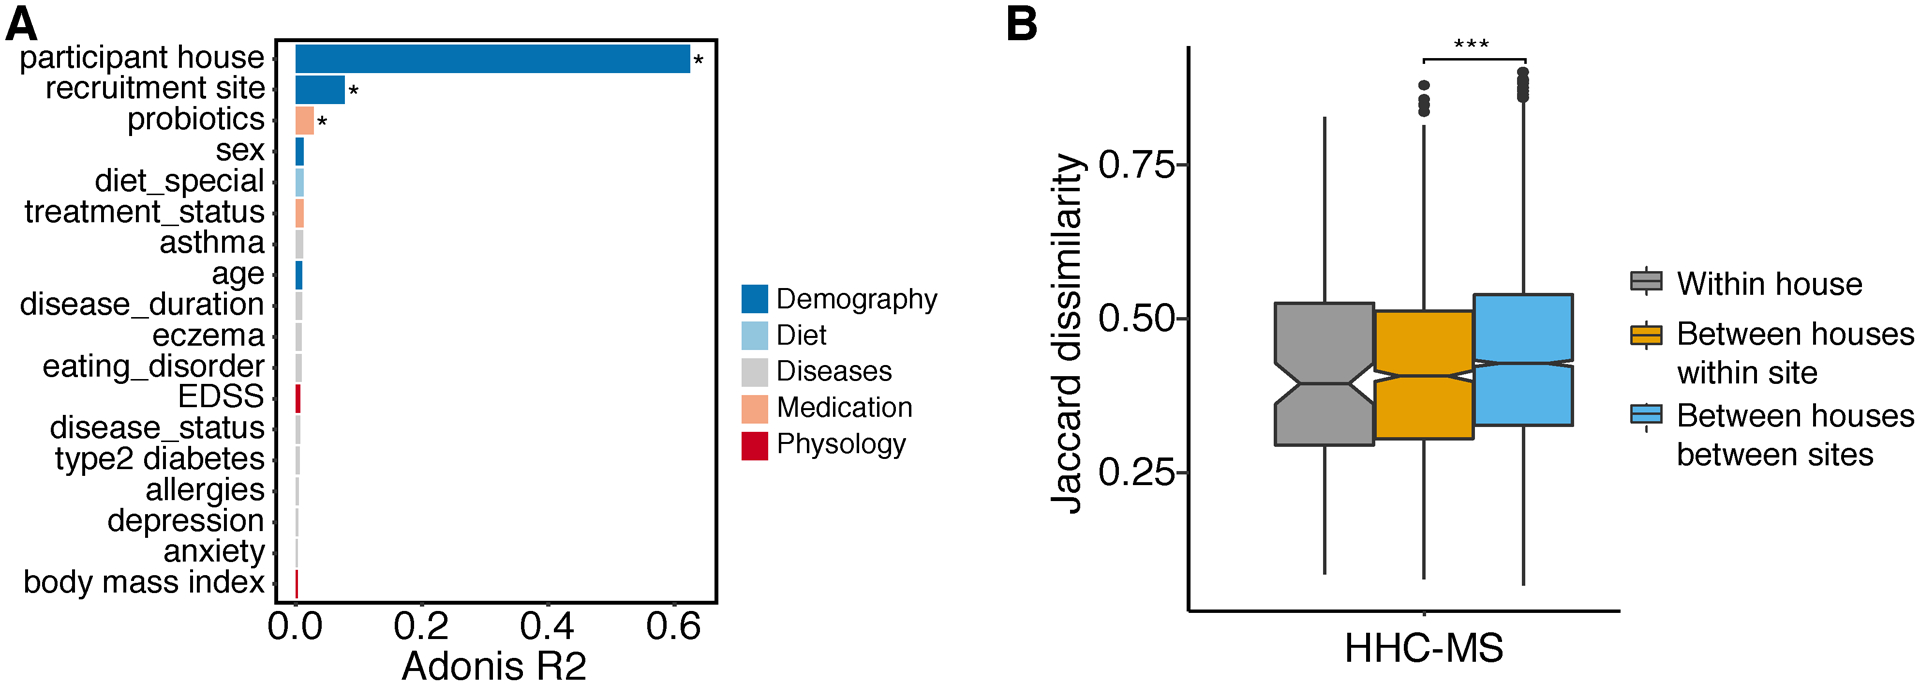
Results: The intra-individual variance observed by different collection strategies was dramatically lower than inter-individual variance. Shallow shotgun highly correlated with 16S sequencing. Participant house and recruitment site accounted for the two largest sources of microbial variance, while higher microbial similarity was seen in household-matched participants as hypothesized. A significant proportion of the variance in dietary intake was also dominated by geographic distance.

Conclusion: A household pair study largely overcomes common inherent limitations and increases statistical power in population-based microbiome studies.

Keywords: 16S rRNA sequencing; Multiple sclerosis; diet; gut microbiome; shallow whole-metagenome sequencing.


Conflict of interest statement

Declaration of Conflicting Interests

The authors declared no potential conflict of interest.

Figures

Figure 1.
Figure 1.
Study summary. (A) Geographic distribution of samples collected from five recruiting centers, and the percentile of each disease course among all samples. (B) Workflow of microbiome study in MS patients and household healthy controls (HHC).
Figure 2.
Figure 2.
Intra-individual diversity. (A) Microbiome α-diversity measured by Shannon index was compared by stool collection method (Q, S) across consecutive two (1,2) days (ANOVA, not significant). (B) Principal Coordinates Analysis (PCoA) of weighted UniFrac distance compared by collection methods and times. Statistical significance was determined by PERMANOVA, multiple testing corrected P value. (C) Microbial dissimilarity (weighted UniFrac) compared between samples by controlling collection method, time, or cross methods and times (ANOVA, multiple testing corrected P value, *P ≤ 0.05, **P ≤ 0.01, ***P ≤ 0.001). (D) Percent explained variability (PERMANOVA R2) by each variable of participating subject, collection method and collection time. S, wet samples by snap freezing; Q, dry samples by Q-tip; T1, T2, sample collection time point 1 and continuous time point 2, respectively; S1, S2, S samples collected at time point 1 and 2, respectively; Q1, Q2, Q samples collected at time point 1 and 2, respectively.
Figure 3.
Figure 3.
Microbial community compared between 16S rRNA and shallow whole-metagenome sequencing techniques (WMGS). (A) Average relative abundance of top 10 most abundant bacteria (phylum and genus level from top to bottom) in healthy control, RRMS and progressive MS. (B) Pearson’s correlation of bacteria (phylum and genus level from top to bottom) classified by 16S rRNA (x-axis) and shallow WMGS (y-axis).
Figure 4.
Figure 4.
Microbial dissimilarity by geography. (A) Bray-Curtis dissimilarity of microbes measured between individuals in the same disease status within the same site (recruiting center) and in different sites. (B) Bray-Curtis dissimilarity of microbes measured between healthy control and MS within the same house, between different houses in the same time and between different houses in different sites. Random comparisons of healthy control and MS were female-male matched only to control sex effect. Statistical significance was determined by ANOVA (multiple testing corrected P value, ***P ≤ 0.001).
Figure 5.
Figure 5.
Microbial diversity. (A) Microbiome α-diversity measured by Shannon and Chao1 index was compared by disease status. Data are presented as mean ± SEM (ANOVA, not significant). (B) PCoA of weighted UniFrac community distance by disease status. (C) Bar plot showing the size effect (Adonis R2) of confounders associated with gut microbial variations (weighted UniFrac distance). Confounders showing significant impact on gut microbiome were labeled. EDSS, expanded disability status scale. (D) PCoA of weighted UniFrac community distance by recruitment sites. Statistical significance was determined by PERMANOVA (multiple testing corrected P value, * P ≤ 0.05, ***P ≤ 0.001).
Figure 6.
Figure 6.
Sample size estimation. (A) The number of observed OTUs in each recruitment site by randomly sampling samples from total samples (100 permutations with replacement). (B) Statistical power of PERMANOVA testing on Bray-Curtis distance to detect the group-level effect in each recruitment site, based on bootstrap sampling. ω2, corrected coefficient of determination. (C) Within-group and between-group dissimilarity measured in each site.
Figure 7.
Figure 7.
Dietary dissimilarity. (A) Bar plot showing the size effect (Adonis R2) of confounders associated with dietary variations (Jaccard dissimilarity). Confounders showing significant impact on gut microbiome were labeled (PERMANOVA, multiple testing corrected P value, *P ≤ 0.05). (B) Jaccard dissimilarity of dietary intakes measured between healthy control and MS within the same house, between different houses in the same time and between different houses in different sites. Random comparisons of healthy control and MS were female-male matched only to control sex effect. Statistical significance was determined by ANOVA (multiple testing corrected P value, ***P ≤ 0.001).

References

    1. Berer K, Gerdes LA, Cekanaviciute E, et al. Gut microbiota from multiple sclerosis patients enables spontaneous autoimmune encephalomyelitis in mice. Proc Natl Acad Sci U S A 2017; 114: 10719–10724. DOI: 10.1073/pnas.1711233114. - DOI - PMC - PubMed
    1. Alfredsson L and Olsson T. Lifestyle and Environmental Factors in Multiple Sclerosis. Cold Spring Harbor perspectives in medicine 2019; 9. DOI: 10.1101/cshperspect.a028944. - DOI - PMC - PubMed
    1. Ochoa-Reparaz J, Kirby TO and Kasper LH. The Gut Microbiome and Multiple Sclerosis. Cold Spring Harbor perspectives in medicine 2018; 8. DOI: 10.1101/cshperspect.a029017. - DOI - PMC - PubMed
    1. De Luca F and Shoenfeld Y. The microbiome in autoimmune diseases. Clinical and experimental immunology 2019; 195: 74–85. DOI: 10.1111/cei.13158. - DOI - PMC - PubMed
    1. Cekanaviciute E, Yoo BB, Runia TF, et al. Gut bacteria from multiple sclerosis patients modulate human T cells and exacerbate symptoms in mouse models. Proc Natl Acad Sci U S A 2017; 114: 10713–10718. DOI: 10.1073/pnas.1711235114. - DOI - PMC - PubMed