

Early recognition and response to increases in surgical site infections using optimized statistical process control charts-the Early 2RIS Trial: a multicenter cluster randomized controlled trial with stepped wedge design
- PMID: 33115527
- PMCID: PMC7594266
- DOI: 10.1186/s13063-020-04802-4
Early recognition and response to increases in surgical site infections using optimized statistical process control charts-the Early 2RIS Trial: a multicenter cluster randomized controlled trial with stepped wedge design
Abstract
Background: Surgical site infections (SSIs) cause significant patient suffering. Surveillance and feedback of SSI rates is an evidence-based strategy to reduce SSIs, but traditional surveillance methods are slow and prone to bias. The objective of this cluster randomized controlled trial (RCT) is to determine if using optimized statistical process control (SPC) charts for SSI surveillance and feedback lead to a reduction in SSI rates compared to traditional surveillance.
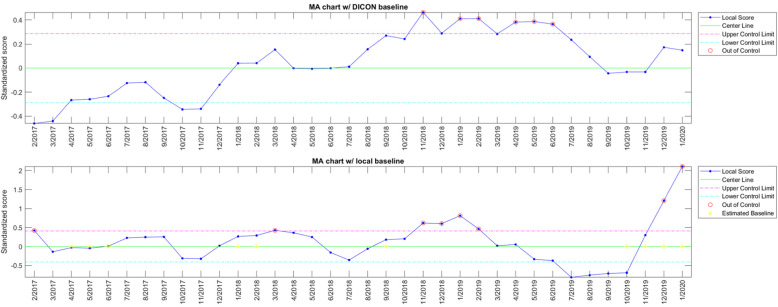
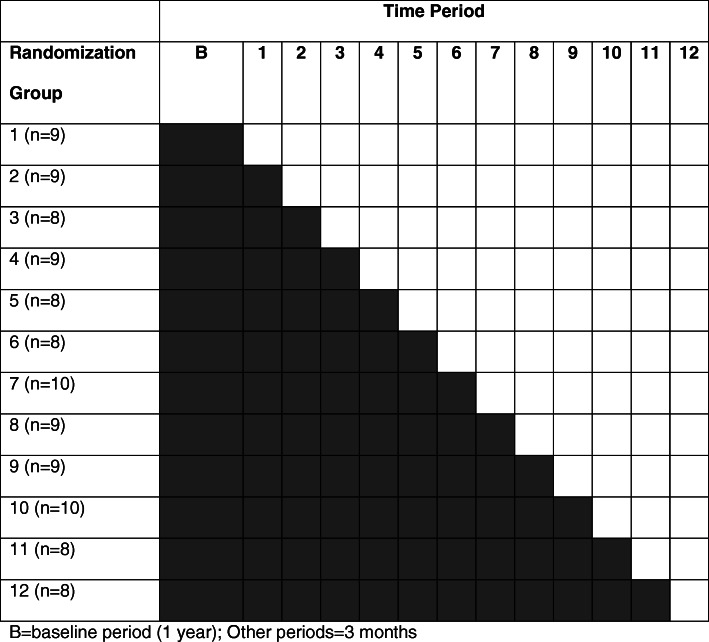
Methods: The Early 2RIS Trial is a prospective, multicenter cluster RCT using a stepped wedge design. The trial will be performed in 29 hospitals in the Duke Infection Control Outreach Network (DICON) and 105 clusters over 4 years, from March 2016 through February 2020; year one represents a baseline period; thereafter, 8-9 clusters will be randomized to intervention every 3 months over a 3-year period using a stepped wedge randomization design. All patients who undergo one of 13 targeted procedures at study hospitals will be included in the analysis; these procedures will be included in one of six clusters: cardiac, orthopedic, gastrointestinal, OB-GYN, vascular, and spinal. All clusters will undergo traditional surveillance for SSIs; once randomized to intervention, clusters will also undergo surveillance and feedback using optimized SPC charts. Feedback on surveillance data will be provided to all clusters, regardless of allocation or type of surveillance. The primary endpoint is the difference in rates of SSI between the SPC intervention compared to traditional surveillance and feedback alone.
Discussion: The traditional approach for SSI surveillance and feedback has several major deficiencies because SSIs are rare events. First, traditional statistical methods require aggregation of measurements over time, which delays analysis until enough data accumulate. Second, traditional statistical tests and resulting p values are difficult to interpret. Third, analyses based on average SSI rates during predefined time periods have limited ability to rapidly identify important, real-time trends. Thus, standard analytic methods that compare average SSI rates between arbitrarily designated time intervals may not identify an important SSI rate increase on time unless the "signal" is very strong. Therefore, novel strategies for early identification and investigation of SSI rate increases are needed to decrease SSI rates. While SPC charts are used throughout industry and healthcare to improve and optimize processes, including other types of healthcare-associated infections, they have not been evaluated as a tool for SSI surveillance and feedback in a randomized trial.
Trial registration: ClinicalTrials.gov NCT03075813 , Registered March 9, 2017.
Keywords: Feedback; Outbreak detection; Statistical process control; Surgical site infection; Surveillance.
Figures
References
-
- Anderson DJ, Pyatt DG, Weber DJ, Rutala WA. North Carolina Department of Public Health and Human Services. Statewide costs of health care-associated infections: estimates for acute care hospitals in North Carolina. Am J Infect Control. 2013;41(9):764–768. doi: 10.1016/j.ajic.2012.11.022. - DOI - PMC - PubMed
-
- Agency for Healthcare Research and Quality (AHRQ) Healthcare cost and utilization project - statistics on hospital stays. 2013.
Publication types
MeSH terms
Associated data
Grants and funding
LinkOut - more resources
Full Text Sources
Medical
Miscellaneous
