

Numbers, graphs and words - do we really understand the lab test results accessible via the patient portals?
- PMID: 33115536
- PMCID: PMC7592036
- DOI: 10.1186/s13584-020-00415-z
Numbers, graphs and words - do we really understand the lab test results accessible via the patient portals?
Abstract
Background: The heavy reliance on remote patient care (RPC) during the COVID-19 health crisis may have expedited the emergence of digital health tools that can contribute to safely and effectively moving the locus of care from the hospital to the community. Understanding how laypersons interpret the personal health information accessible to them via electronic patient records (EPRs) is crucial to healthcare planning and the design of services. Yet we still know little about how the format in which personal medical information is presented in the EPR (numerically, verbally, or graphically) affects individuals' understanding of the information, their assessment of its gravity, and the course of action they choose in response.
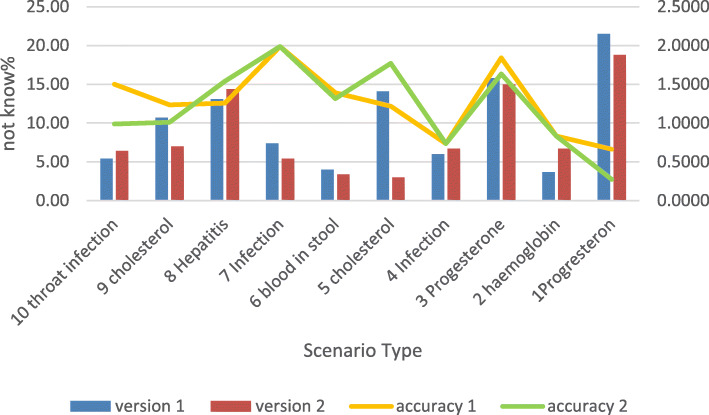
Methods: We employed an online questionnaire to assess respondents' reactions to 10 medical decision-making scenarios, where the same information was presented using different formats. In each scenario, respondents were presented with real (anonymized) patient lab results using either numeric expressions, graphs, or verbal expressions. Participants were asked to assess the gravity of the hypothetical patient's condition and the course of action they would follow if they were that patient. The questionnaire was distributed to more than 300 participants, of whom 225 submitted usable responses.
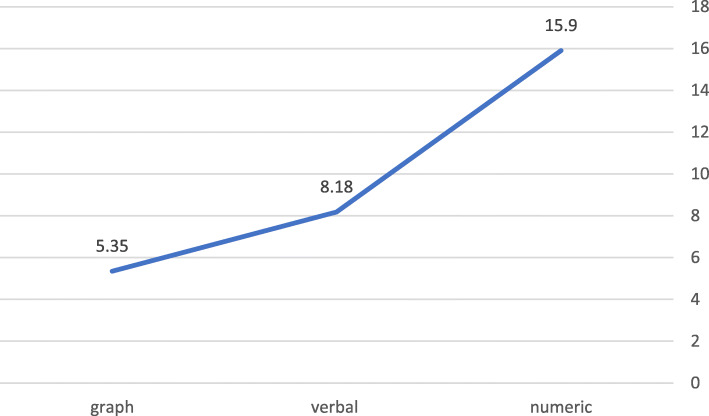
Results: Laypersons were more likely to overestimate the gravity of the information when it was presented either numerically or graphically compared to the narrative format. High perceived gravity was most likely to produce an inclination to actively seek medical attention, even when unwarranted. "Don't know" responses were most likely to produce an inclination to either search the Internet or wait for the doctor to call.
Policy recommendations: We discuss the study's implications for the effective design of lab results in the patient portals. We suggest (1) that graphs, tables, and charts would be easier to interpret if coupled with a brief verbal explanation; (2) that highlighting an overall level of urgency may be more helpful than indicating a diversion from the norm; and (3) that statements of results should include the type of follow-up required.
Keywords: Care seeking; Health information technology; Information format; Patient engagement.
Conflict of interest statement
The study was not funded by any Funding organizations. To the best of our knowledge, there are no competing interests.
Figures


References
-
- Hollander JE, Carr BG. Virtually perfect? Telemedicine for COVID-19. NEJM. 2020;382(18):1679–1681. - PubMed
-
- Kellermann AL, Jones SS. What it will take to achieve the as-yet-unfulfilled promises of health information technology. Health Aff. 2013;32(1):63–68. - PubMed
-
- Office of the National Coordinator for Health Information Technology. Health IT: Advancing America’s Health Care (fact sheet). https://www.healthit.gov/sites/default/files/pdf/health-information-tech....
Publication types
MeSH terms
LinkOut - more resources
Full Text Sources
Medical
Miscellaneous
