. 2021 Jan:102:254-259.
doi: 10.1016/j.ijid.2020.10.046. Epub 2020 Oct 25.

The role of case importation in explaining differences in early SARS-CoV-2 transmission dynamics in Canada-A mathematical modeling study of surveillance data

Affiliations

The role of case importation in explaining differences in early SARS-CoV-2 transmission dynamics in Canada-A mathematical modeling study of surveillance data

Arnaud Godin et al. Int J Infect Dis. 2021 Jan.

Abstract

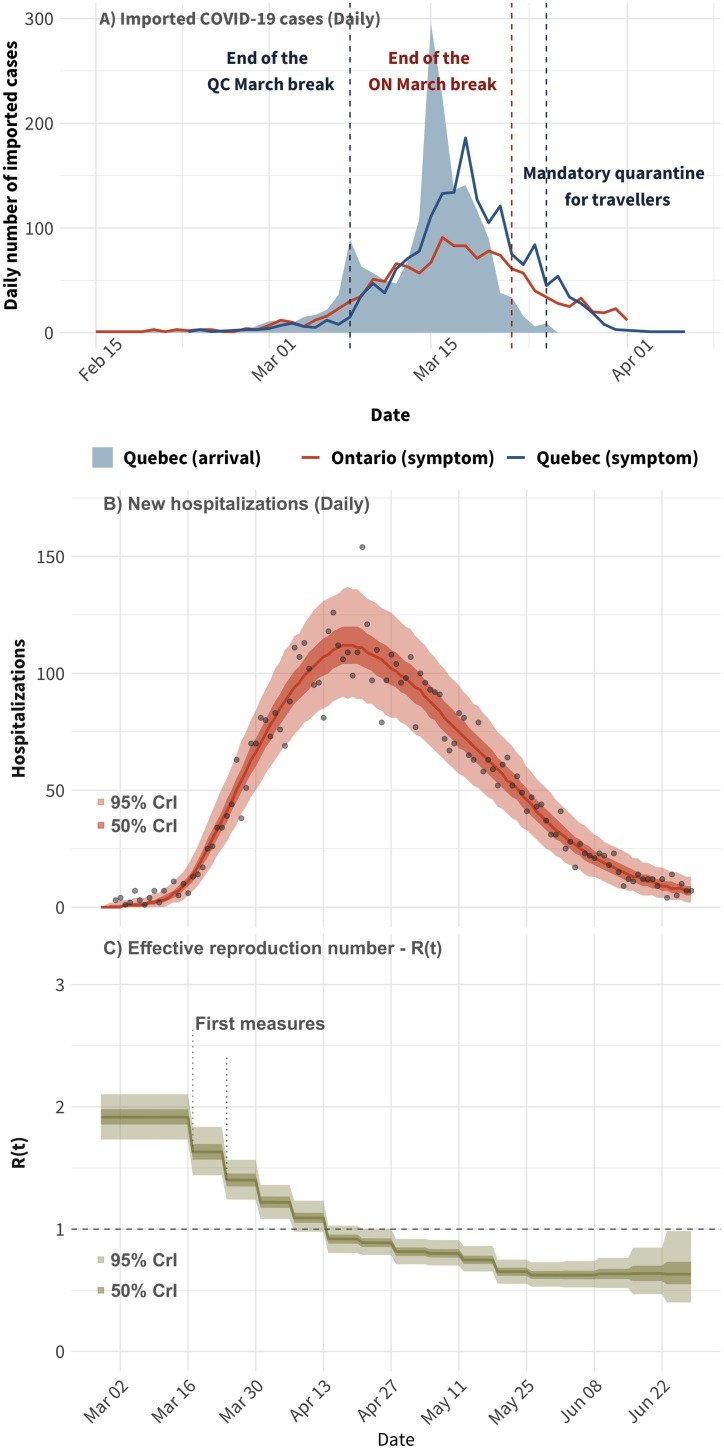
Objective: The North American coronavirus disease-2019 (COVID-19) epidemic exhibited distinct early trajectories. In Canada, Quebec had the highest COVID-19 burden and its earlier March school break, taking place two weeks before those in other provinces, could have shaped early transmission dynamics.

Methods: We combined a semi-mechanistic model of SARS-CoV-2 transmission with detailed surveillance data from Quebec and Ontario (initially accounting for 85% of Canadian cases) to explore the impact of case importation and timing of control measures on cumulative hospitalizations.

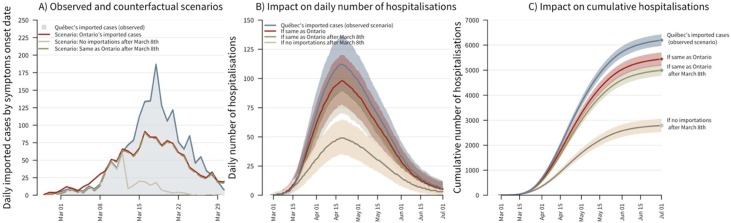
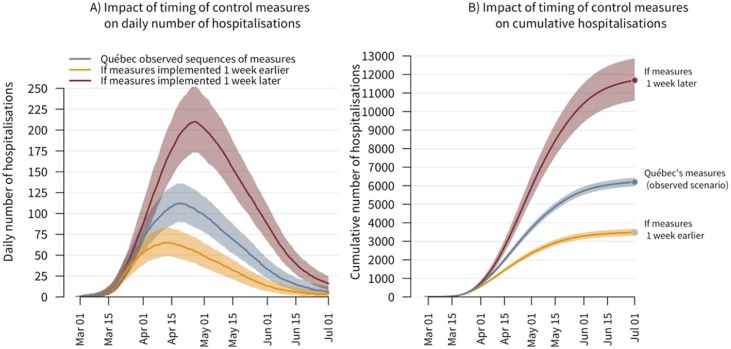
Results: A total of 1544 and 1150 cases among returning travelers were laboratory-confirmed in Quebec and Ontario, respectively (symptoms onset ≤03-25-2020). Hospitalizations could have been reduced by 55% (95% CrI: 51%-59%) if no cases had been imported after Quebec's March break. However, if Quebec had experienced Ontario's number of introductions, hospitalizations would have only been reduced by 12% (95% CrI: 8%-16%). Early public health measures mitigated the epidemic spread as a one-week delay could have resulted in twice as many hospitalizations (95% CrI: 1.7-2.1).

Conclusion: Beyond introductions, factors such as public health preparedness, responses and capacity could play a role in explaining interprovincial differences. In a context where regions are considering lifting travel restrictions, coordinated strategies and proactive measures are to be considered.

Keywords: Case introductions; Epidemiology; Infectious diseases; Public health; Travel.


Conflict of interest statement

Declaration of Competing Interest The authors report no declarations of interest.

Figures

Figure 1
Figure 1
Panel (A): Number of daily imported COVID-19 cases by the date of return travel (shaded area; Quebec only) and imported cases by the date of symptoms onset in Quebec and Ontario (lines). Panel (B): Model fit to the time series of daily hospitalizations in Quebec. Panel (C): the estimated time-varying effective reproduction number. The points in panel (A) correspond to the observed number of hospitalizations. In both panels, the solid lines correspond to the median of the model posterior distribution for that outcome and the shaded areas to the 50% and 95% credible intervals.
Figure 2
Figure 2
The impact of case importation on incident and cumulative hospitalizations. Panel (A): The observed number of imported cases by date of symptom onsets in Quebec (shaded area) and three counterfactual scenarios corresponding to: (1) Ontario’s daily number of imported cases, (2) no case importation after March 8th (cases imported before that date can still become infectious later on), and (3) Quebec’s observed daily imported cases up to March 8th, after which, Ontario’s daily imported cases are used. For all scenarios, imported cases are assumed to become infectious 1 day prior to symptom onset. Panel (B): The daily number of COVID-19 hospitalizations in Quebec for the observed scenario and the three counterfactual scenarios. Panel (C): The cumulative number of COVID-19 hospitalizations in Quebec for the observed scenarios and the three counterfactual scenarios. The solid lines correspond to the median estimates and the shaded areas to the model’s 95% credible intervals.
Figure 3
Figure 3
The impact of earlier or delayed implementation of control measures on incident and cumulative hospitalizations (with Quebec’s observed number/timing of imported cases). Panel (A): The daily number of incident COVID-19 hospitalizations in Quebec under (1) the observed scenario with first measures announced on March 13th, (2) if the whole sequence of measures would have been implemented one week earlier, and (3) if the sequence of measures would have been delayed by one week. Panel (B): The cumulative number of COVID-19 hospitalizations in Quebec for the observed scenario and the two alternative ones, where control measures would have been implemented earlier or delayed. The solid lines correspond to the median estimates and the shaded areas to the model’s 95% credible intervals.

References

    1. CIHI . 2020. COVID-19 Intervention Timeline in Canada. Available at:https://www.cihi.ca/en/covid-19-intervention-timeline-in-canada[Accessed 13 October 2020]
    1. Davies N., Kucharski A., Eggo R., Gimma A., Group CMMID COVIDW, Edmunds W. Centre for Mathematical Modelling of Infectious Diseases. LSHTM; 2020. The Effect of Non-Pharmaceutical Interventions on COVID-19 Cases, Deaths and Demand for Hospital Services in the UK: a Modelling Study. - PMC - PubMed
    1. Dong E., Du H., Gardner L. An interactive web-based dashboard to track COVID-19 in real time. Lancet Infect Dis. 2020;20:533–534. - PMC - PubMed
    1. Groupe de surveillance provinciale de la C. Institut national de santé publique du Québec; 2020. Vigie Quotidienne de la COVID-19 au Québec: Épidémiologie Descriptive Rapport du 14 juin 2020; p. 53.
    1. Guyon A., Perreault R. Public health systems under attack in Canada: evidence on public health system performance challenges arbitrary reform. Can J Public Health. 2016;107:e326–e329. - PMC - PubMed