. 2020 Dec 1;80(23):5245-5256.
doi: 10.1158/0008-5472.CAN-19-2306. Epub 2020 Oct 28.

Hypoxia Induces Transcriptional and Translational Downregulation of the Type I IFN Pathway in Multiple Cancer Cell Types

Affiliations

Hypoxia Induces Transcriptional and Translational Downregulation of the Type I IFN Pathway in Multiple Cancer Cell Types

Ana Miar et al. Cancer Res. .

Abstract

Hypoxia is a common phenomenon in solid tumors and is strongly linked to hallmarks of cancer. Recent evidence has shown that hypoxia promotes local immune suppression. Type I IFN supports cytotoxic T lymphocytes by stimulating the maturation of dendritic cells and enhancing their capacity to process and present antigens. However, little is known about the relationship between hypoxia and the type I IFN pathway, which comprises the sensing of double-stranded RNA and DNA (dsRNA/dsDNA) followed by IFNα/β secretion and transcriptional activation of IFN-stimulated genes (ISG). In this study, we determined the effects of hypoxia on the type I IFN pathway in breast cancer and the mechanisms involved. In cancer cell lines and xenograft models, mRNA and protein expressions of the type I IFN pathway were downregulated under hypoxic conditions. This pathway was suppressed at each level of signaling, from the dsRNA sensors RIG-I and MDA5, the adaptor MAVS, transcription factors IRF3, IRF7, and STAT1, and several ISG including RIG-I, IRF7, STAT1, and ADAR-p150. Importantly, IFN secretion was reduced under hypoxic conditions. HIF1α- and HIF2α-mediated regulation of gene expression did not explain most of the effects. However, ATAC-seq data revealed in hypoxia that peaks with STAT1 and IRF3 motifs had decreased accessibility. Collectively, these results indicate that hypoxia leads to an overall downregulation of the type I IFN pathway due to repressed transcription and lower chromatin accessibility in an HIF1/2α-independent manner, which could contribute to immunosuppression in hypoxic tumors. SIGNIFICANCE: These findings characterize a new mechanism of immunosuppression by hypoxia via downregulation of the type I IFN pathway and its autocrine/paracrine effects on tumor growth.


Conflict of interest statement

Disclosure statement: Authors have nothing to declare.

Figures

Figure 1
Figure 1. Type I interferon (IFN) pathway expression in breast cancer cells.
A) Western-blot showing protein levels of different genes involved in the pathway in MCF7 cells cultured in normoxia, 0.1% and 1% hypoxia for 48h. B) qPCR data showing mRNA expression of genes involved in the pathway in the same experiment (n=10). C) mRNA expression of genes in the type IFN pathway in different breast cancer cell lines cultured in normoxia or 0.1% hypoxia for 24h (n=3). * p<0.05, ** p<0.01, *** p<0.001.
Figure 2
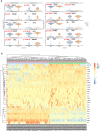
Figure 2. Single-cell analysis of type I IFN pathway in MCF7.
A) Violin plots showing expression (log counts) of type IFN genes in normoxia (orange) and 0.1% hypoxia (blue) after 72h. B) Heatmap correlating mRNA expression type I IFN genes previously published with hypoxia target genes.
Figure 3
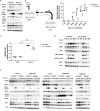
Figure 3. Type I IFN over time and during reoxygenation in MCF7 cells.
A) Western-blot showing protein levels of different genes involved in the pathway in MCF7 cells cultured in normoxia for 48h or 0.1% hypoxia for 4h, 8h, 16h, 24h and 48h. B) qPCR data showing mRNA expression of genes involved in the pathway in the same experiment (n=3). C) Western-blot showing protein changes in MCF7 when exposed to normoxia or 0.1% hypoxia for 48h and after reoxygenation for 8h, 16h and 24h. D) qPCR data showing mRNA expression changes for the same experiment (n=3). * p<0.05, ** p<0.01, *** p<0.001.
Figure 4
Figure 4. Type I IFN activation by poly I:C in breast cancer cells.
A) Western-blot showing protein levels of MCF7 cells cultured in normoxia or 0.1% hypoxia for 48h and transfected with poly I:C in the last 6h. B) IFN bioassay showing Interferon Stimulated Response Element (ISRE) activation via luciferase activity in HEK293 cells using supernatants of MCF7 cells previously treated with normoxia or 0.1% hypoxia for 24h and transfected with different concentrations of poly I:C (n=3). C) ADAR-p150 expression in THP-1 cells after treatment with normoxic or hypoxic conditioned supernatant from MCF7 cells. D) Time course of 0.1% hypoxia treatment for 6h, 24h and 48h and transfected with 20ug/ml poly I:C in the last 6h of the treatment. E) Western-blot showing protein changes in different breast cancer cells when exposed to normoxia or 0.1% hypoxia for 48h and transfected with 20ug/ml poly I:C in the last 6h of the treatment. * p<0.05, ** p<0.01, *** p<0.001 in normoxia and normoxia vs hypoxia, # p<0.05, ## p<0.01, ### p<0.001 in hypoxia samples.
Figure 5
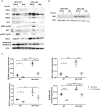
Figure 5. HIF1α-independency of type I IFN downregulation in hypoxia.
A) Western-blot showing protein changes in different MCF7-WT vs MCF7-HIF1α-KO cells when exposed to normoxia or 0.1% hypoxia for 48h and transfected with 0.5ug/ml poly I:C in the last 6h of the treatment B) IRF9 protein levels in MCF7-WT and MCF7-HIF1α-KO cells in the same as experiment as in A). C) mRNA expression in MCF7-WT and MCF7-HIF1α-KO cells cultured in normoxia or 0.1% hypoxia for 48h. * p<0.05, ** p<0.01, *** p<0.001 n=3
Figure 6
Figure 6. Downregulation of the type I IFN staining in hypoxic tumours in vivo.
A) IRF3, IRF7, ADAR, CA9 and PIMO staining in MCF7 xenografts from control and Avastin-treated mice and their respective quantification. B) IRF3, IRF7, ADARCA9 and PIMO staining in MDA-MB-231 xenografts from control and Avastin-treated mice and their respective quantification. n=5 per group, ** p<0.01, *** p<0.001.
Figure 7
Figure 7. ATAC-seq reveals dynamics of chromatin accessibility during hypoxia.
A) MA plot of differentially accessible peaks during hypoxia with peaks significantly more (red) or less (blue) accessible during hypoxia. B) Annotation of all ATAC-seq peaks, and peaks with significant changes in accessibility. C) Percent of ATAC-seq peaks containing HIF1, STAT1, IRF3, FOXA1 and GATA3 transcription factor binding motifs. Peaks are divided into transcription start site (TSS) associated and TSS-distal peaks (all other categories in B). The number of peaks that are unchanged, decreased and increased in A) are shown graphically and following the same colour-code in C). Number of differentially accessible peaks in each class is shown in the HIF-1 graph and are identical for the others. P-values are for a Fisher’s exact test with Bonferroni multiple test correction. D) Schematic representation of the hypoxia-dependent and HIF1α-independent mechanism by which hypoxia downregulates the type I IFN pathway.

References

    1. Ruan K, Song G, Ouyang G. Role of hypoxia in the hallmarks of human cancer. J Cell Biochem. 2009;107:1053–62. - PubMed
    1. Semenza GL. Hypoxia-inducible factors in physiology and medicine. Cell. 2012;148:399–408. - PMC - PubMed
    1. Kaelin WG, Jr, Ratcliffe PJ. Oxygen sensing by metazoans: the central role of the HIF hydroxylase pathway. Mol Cell. 2008;30:393–402. - PubMed
    1. Epstein AC, Gleadle JM, McNeill LA, Hewitson KS, O’Rourke J, Mole DR, et al. C. elegans EGL-9 and mammalian homologs define a family of dioxygenases that regulate HIF by prolyl hydroxylation. Cell. 2001;107:43–54. - PubMed
    1. Lewis C, Murdoch C. Macrophage responses to hypoxia: implications for tumor progression and anti-cancer therapies. Am J Pathol. 2005;167:627–35. - PMC - PubMed

MeSH terms