

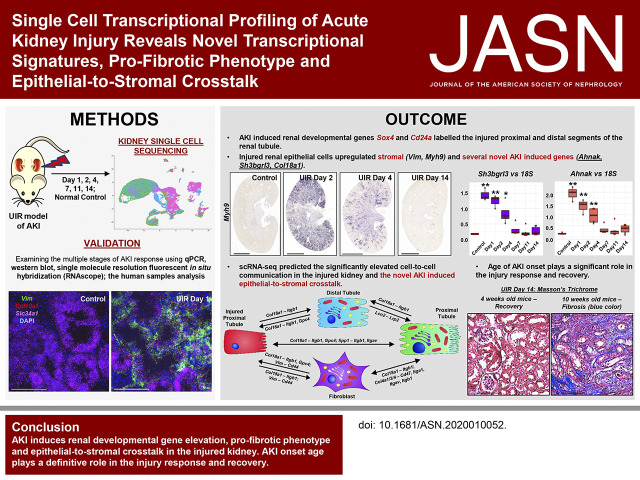
Single-Cell Profiling of AKI in a Murine Model Reveals Novel Transcriptional Signatures, Profibrotic Phenotype, and Epithelial-to-Stromal Crosstalk
- PMID: 33115917
- PMCID: PMC7790221
- DOI: 10.1681/ASN.2020010052
Single-Cell Profiling of AKI in a Murine Model Reveals Novel Transcriptional Signatures, Profibrotic Phenotype, and Epithelial-to-Stromal Crosstalk
Abstract
Background: Current management of AKI, a potentially fatal disorder that can also initiate or exacerbate CKD, is merely supportive. Therefore, deeper understanding of the molecular pathways perturbed in AKI is needed to identify targets with potential to lead to improved treatment.
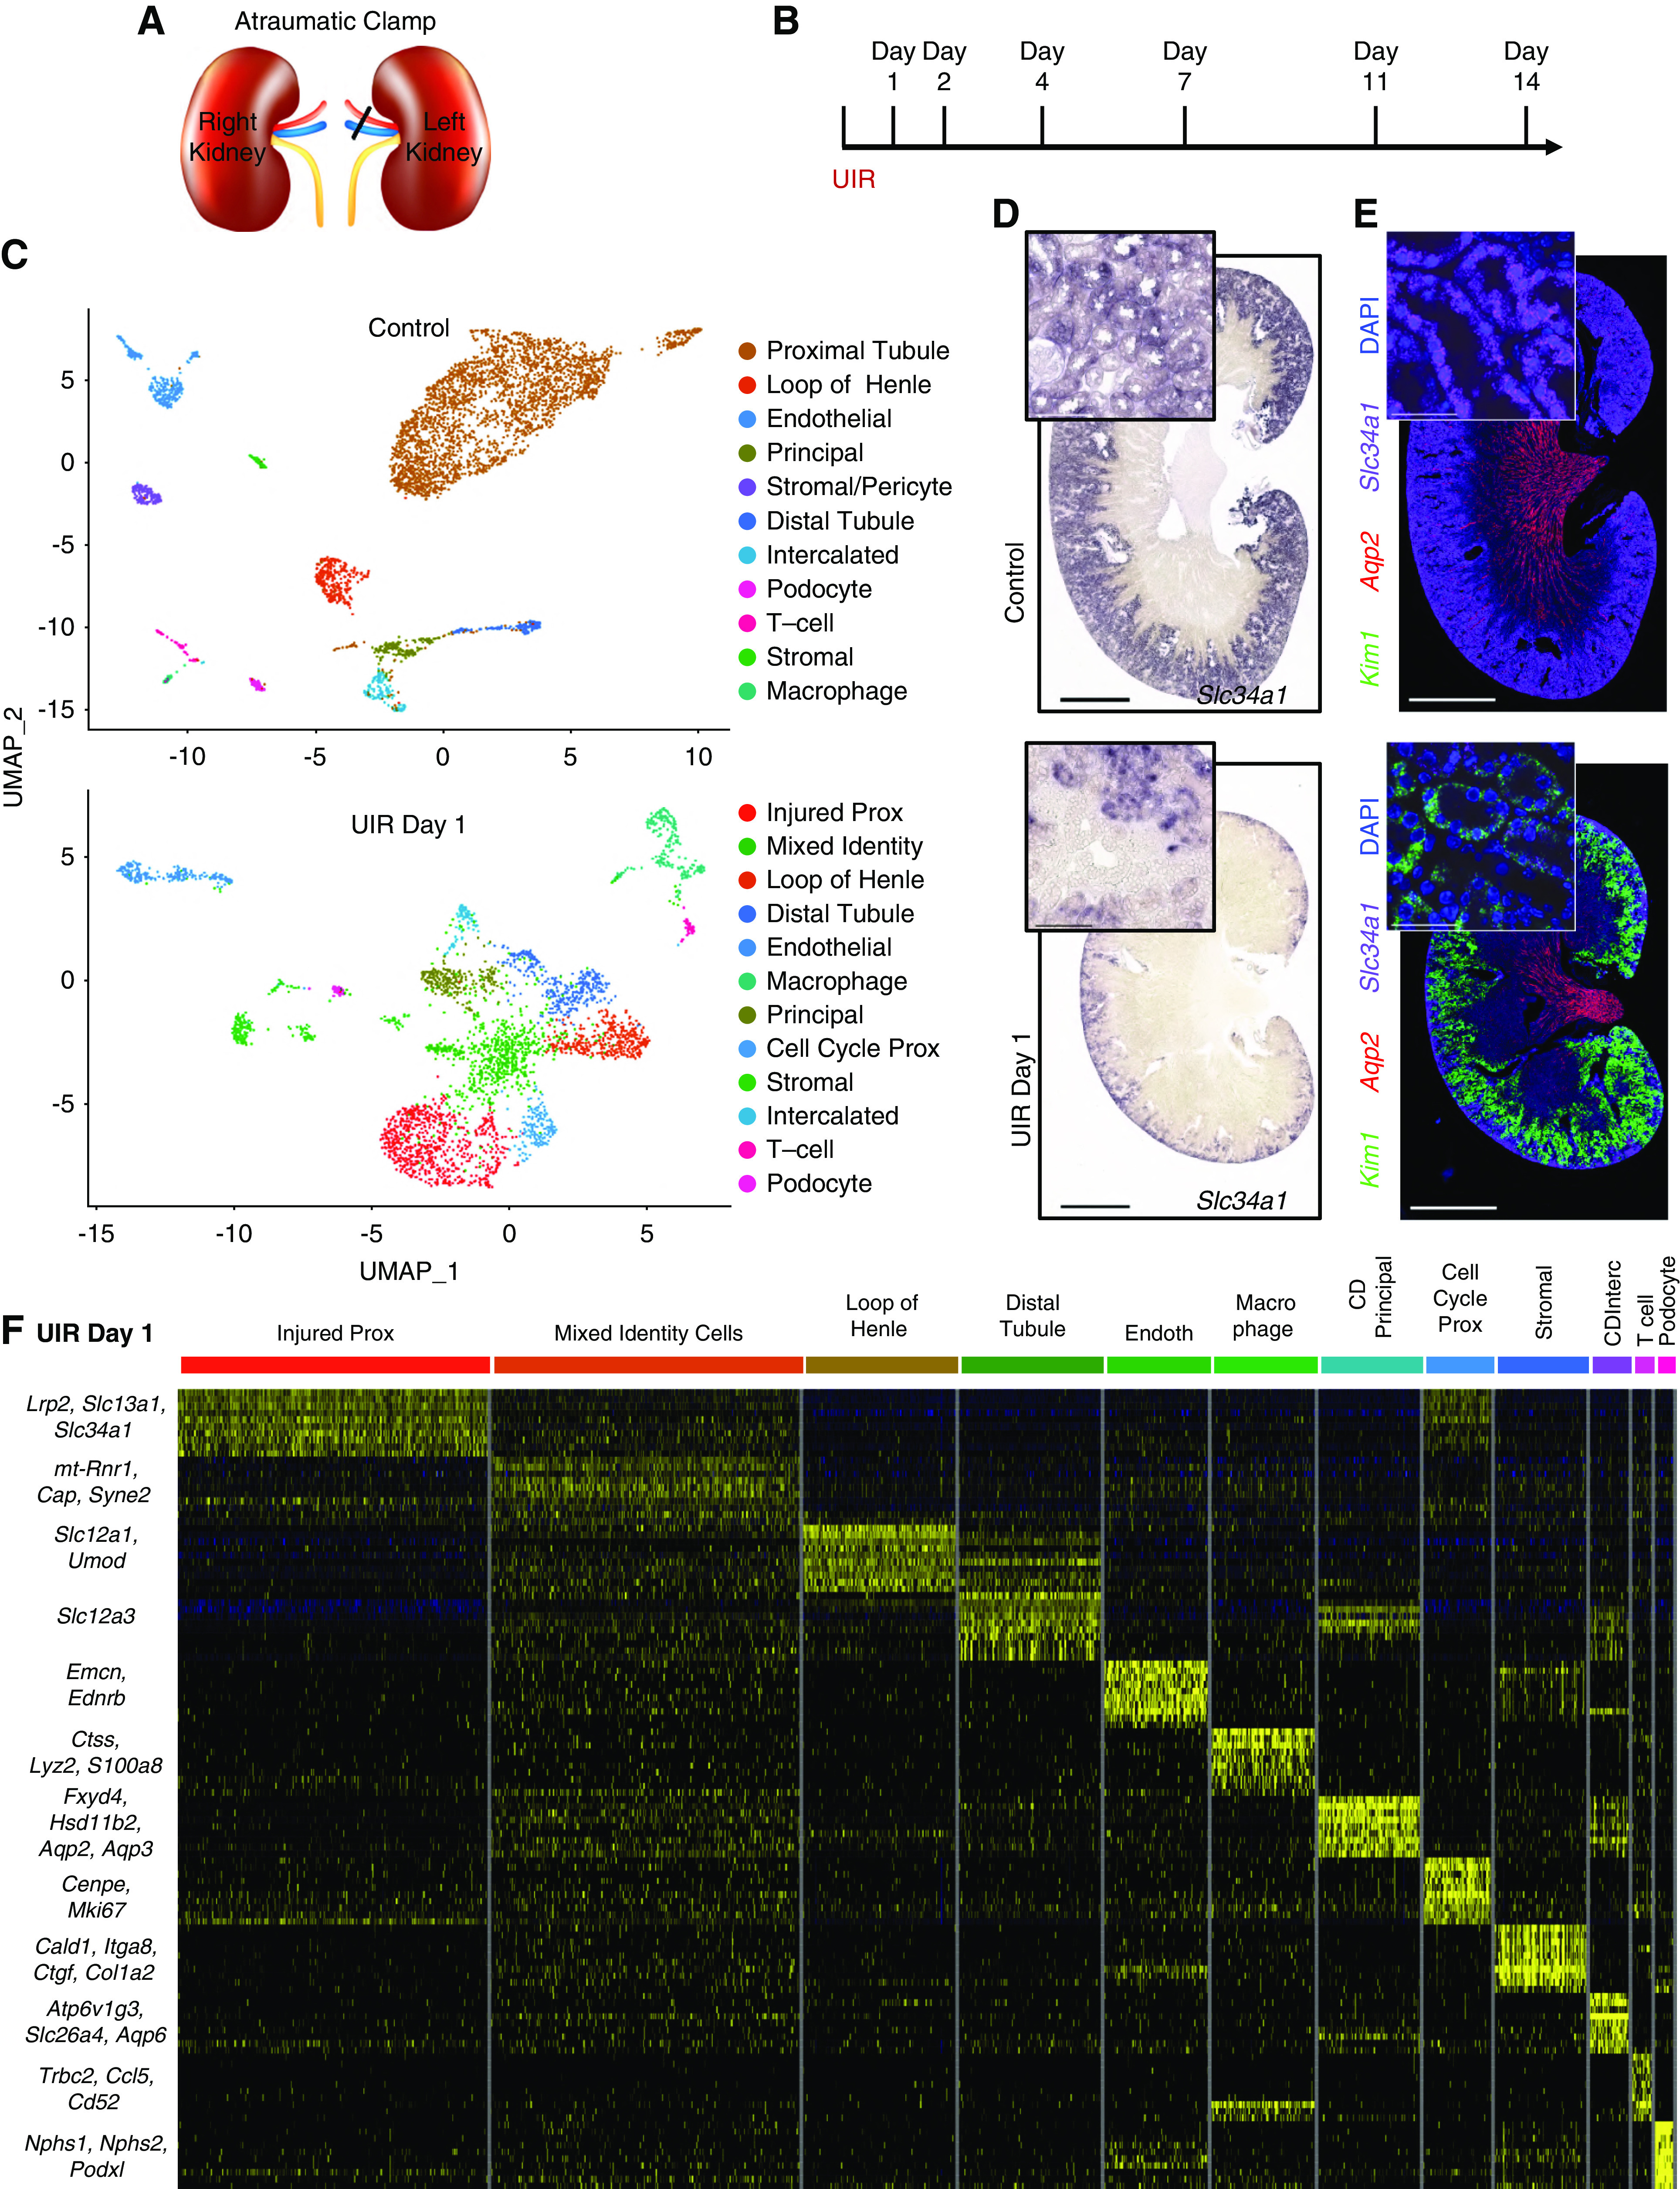
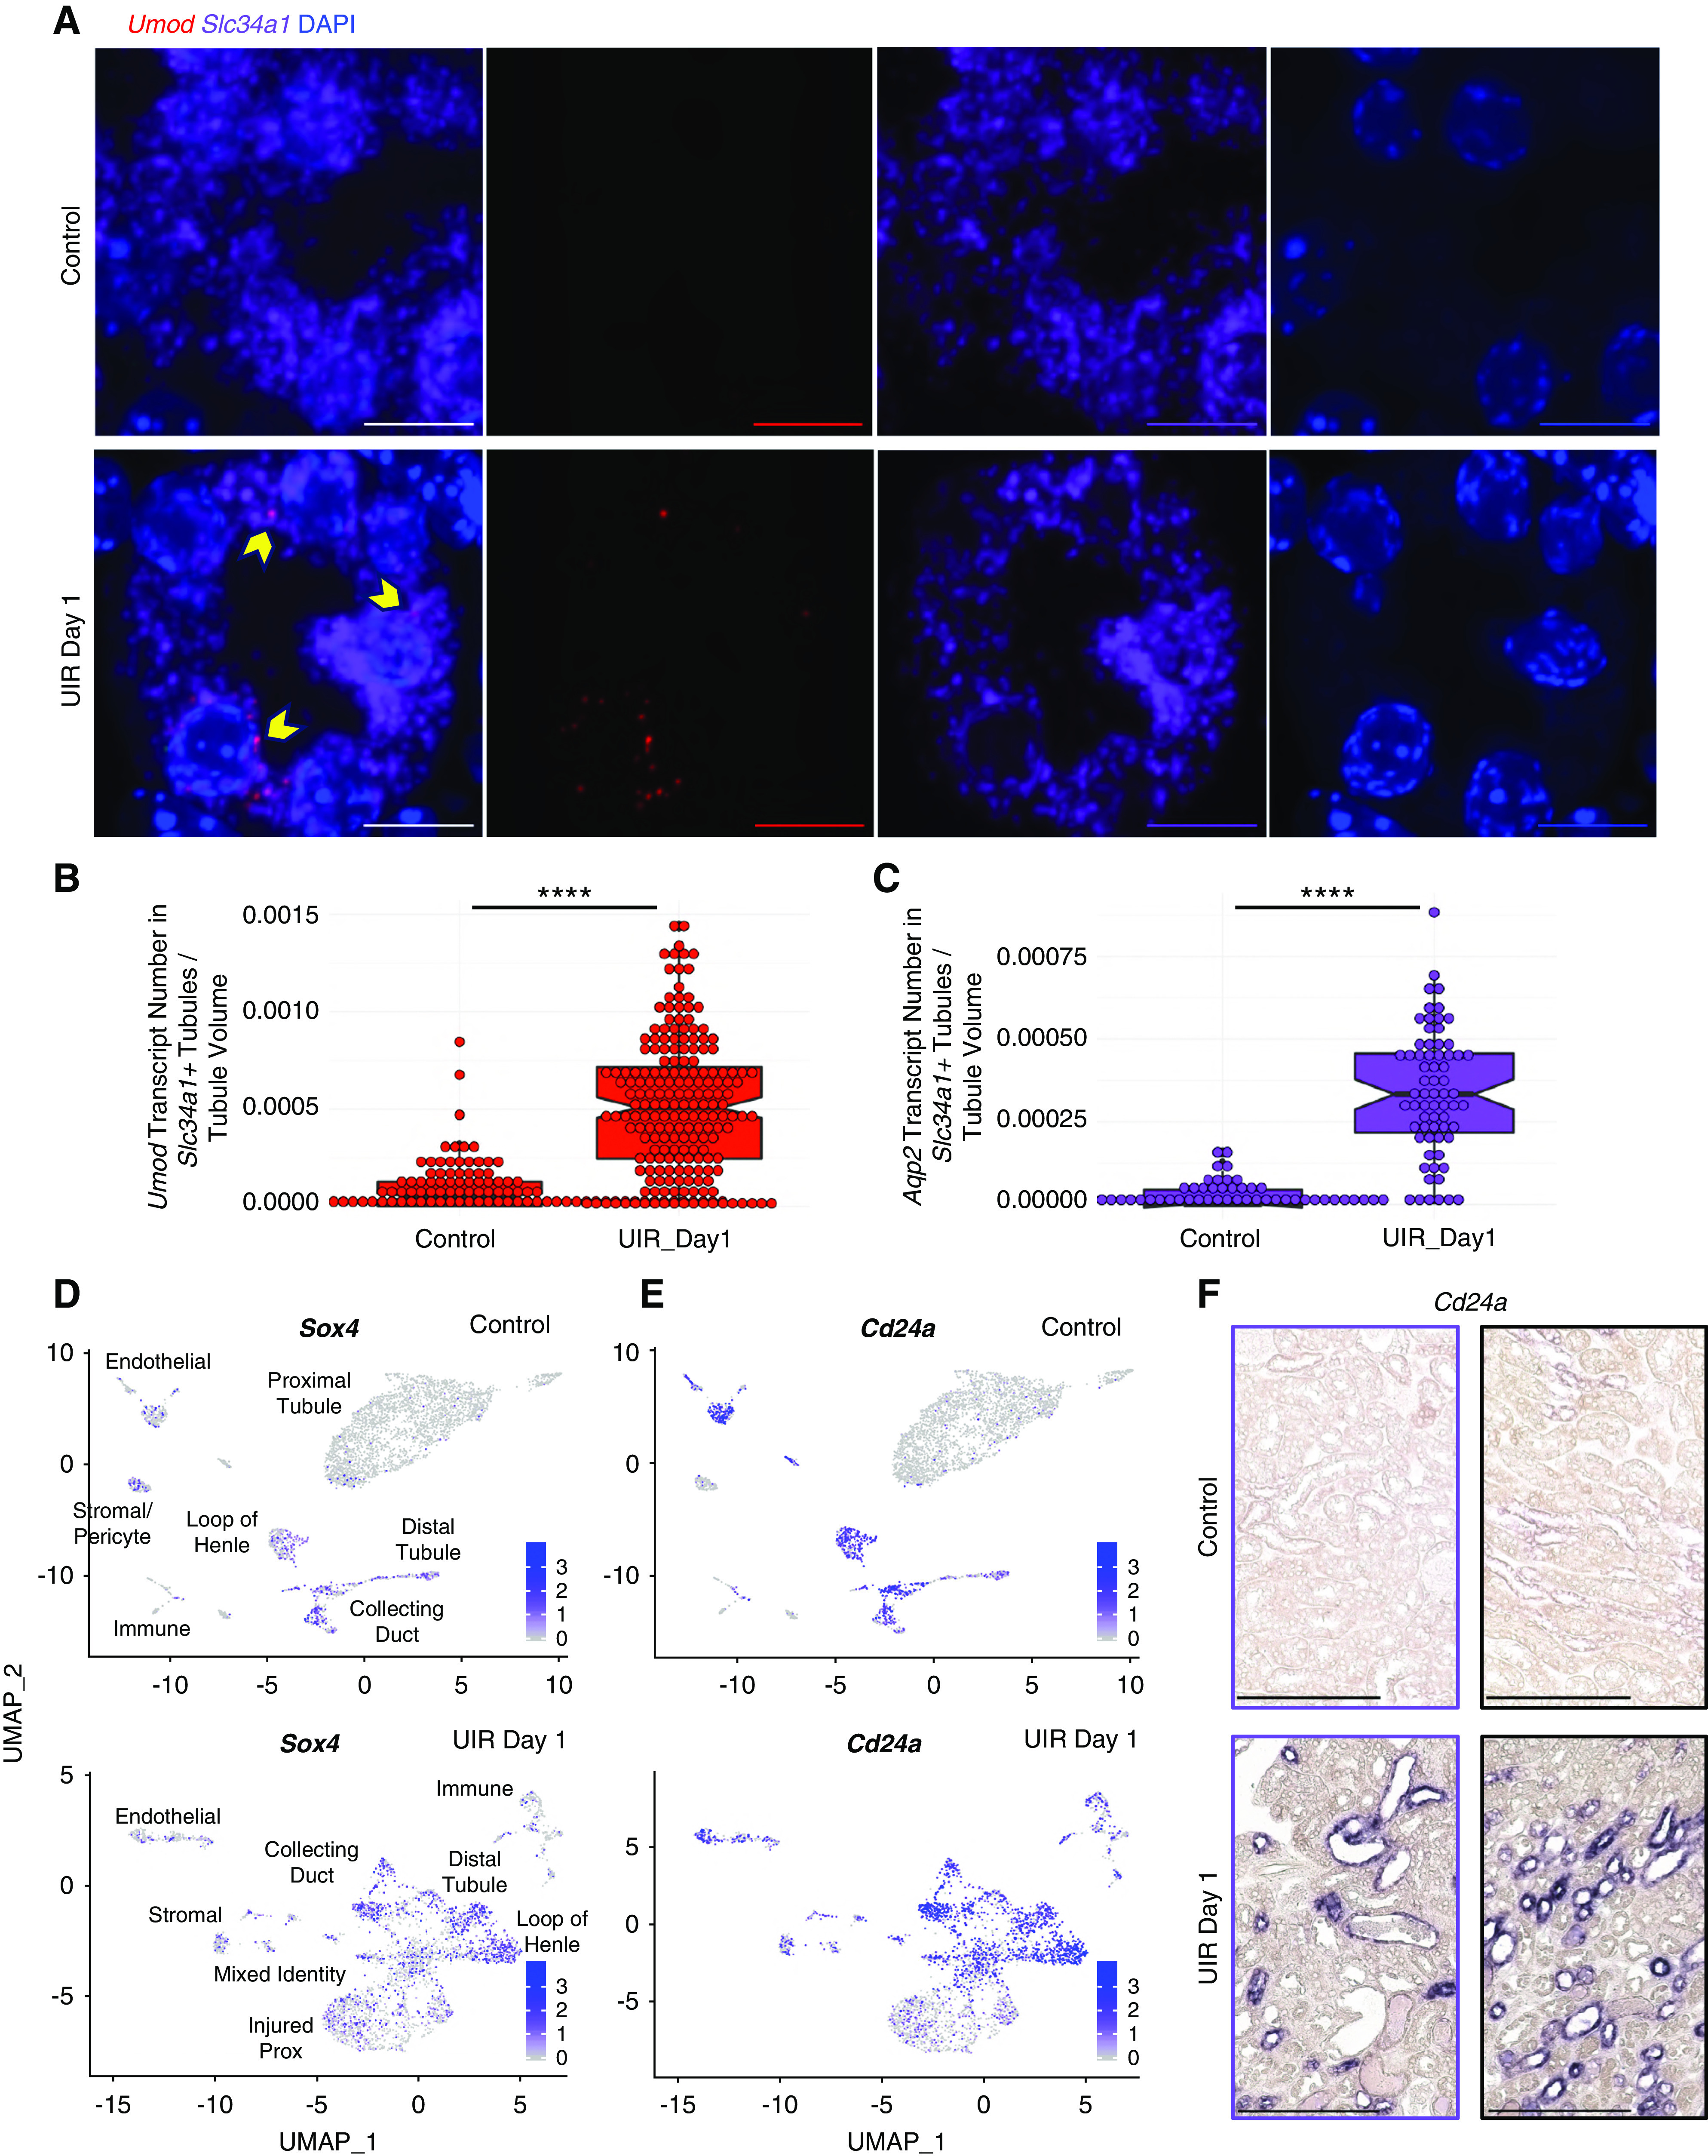
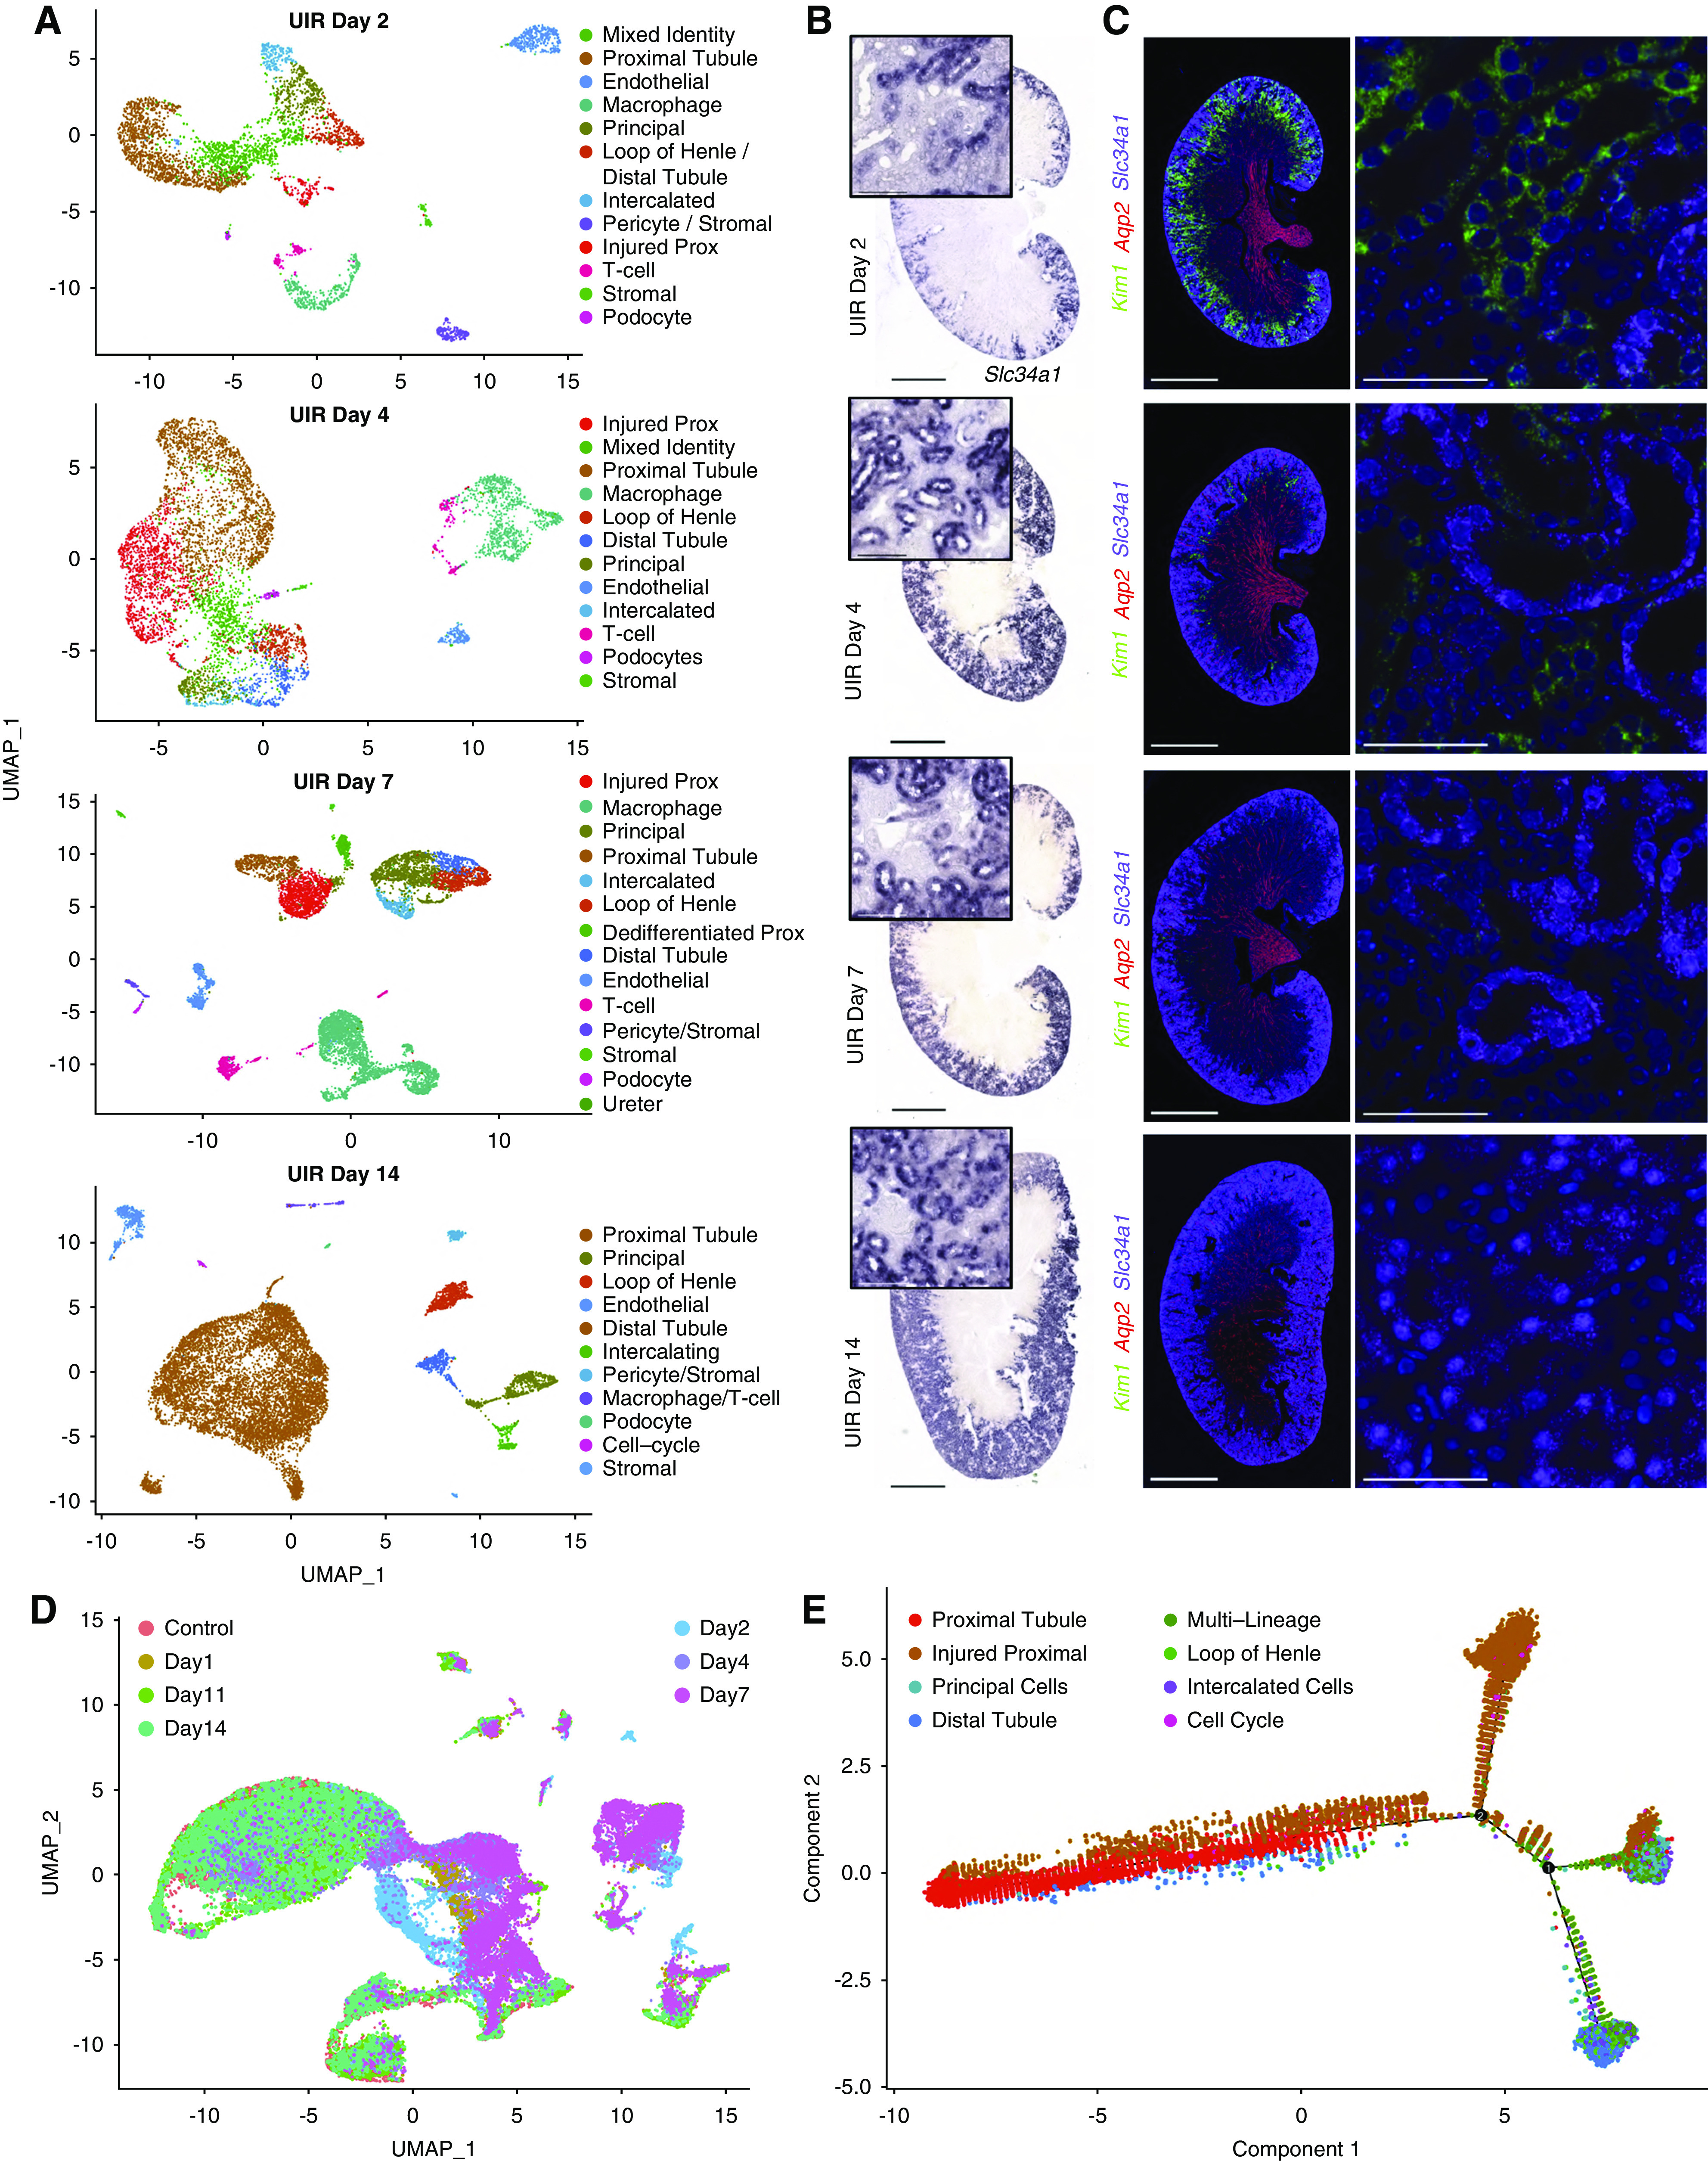
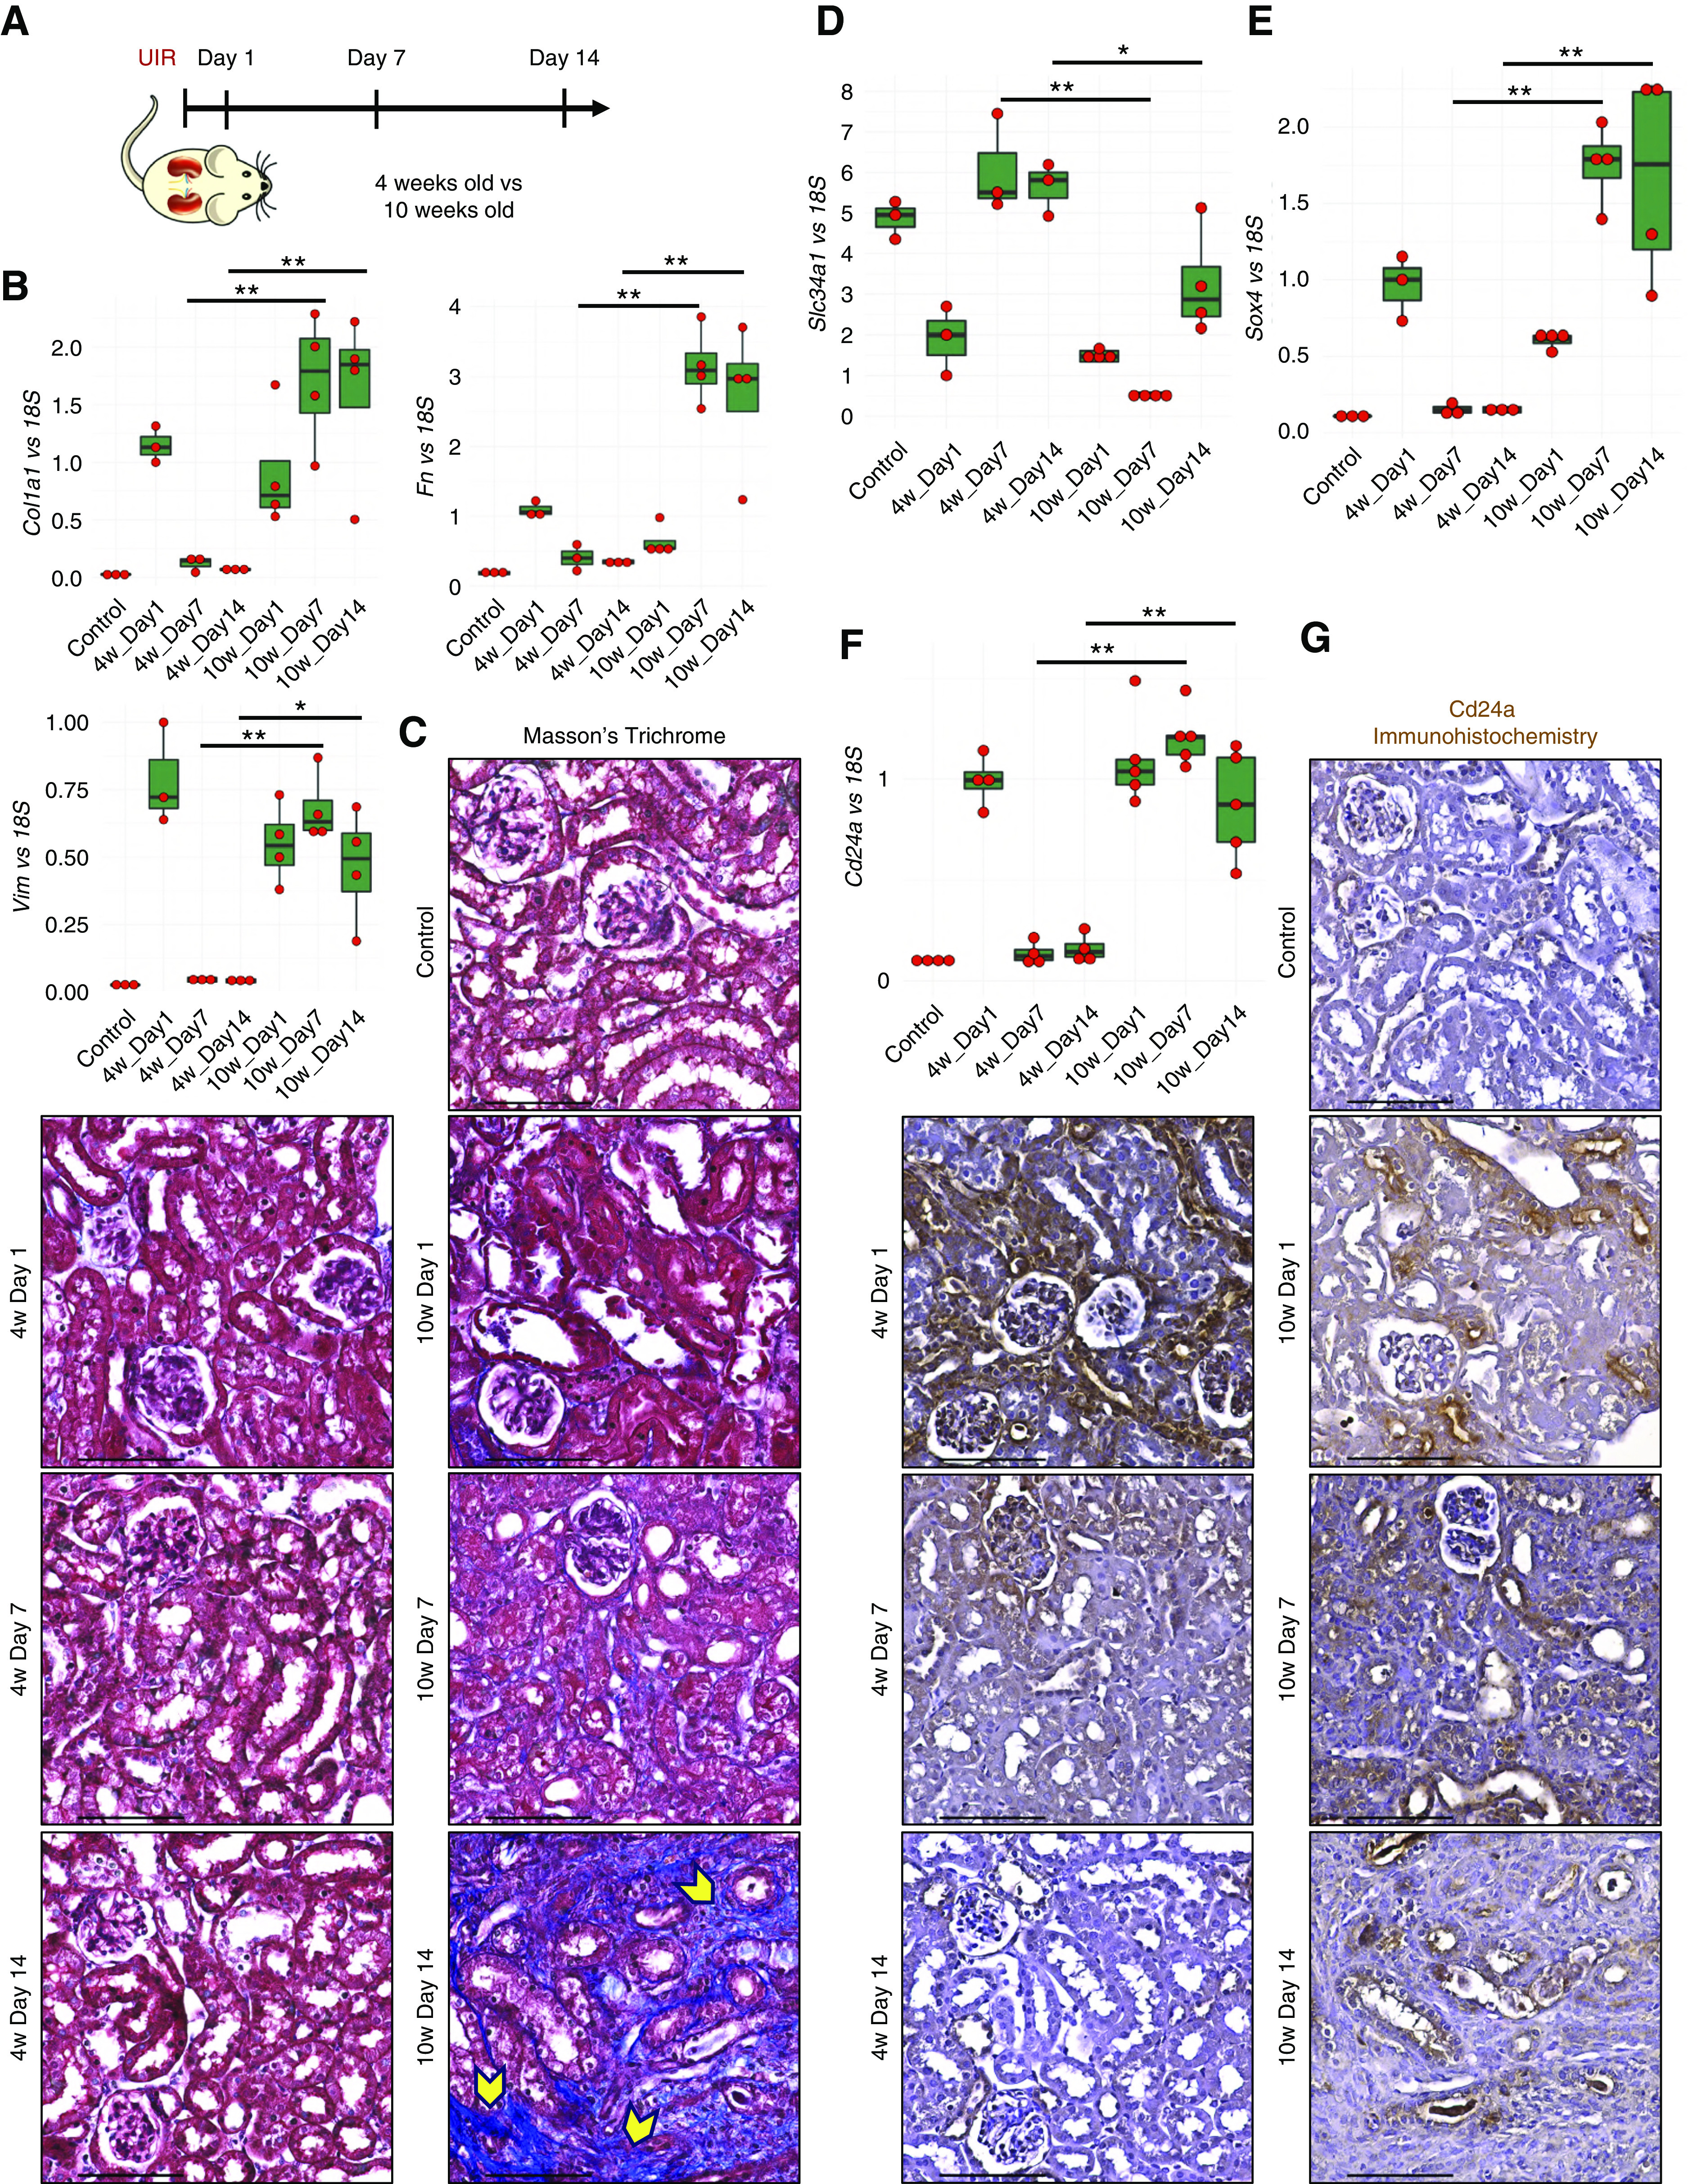
Methods: We performed single-cell RNA sequencing (scRNA-seq) with the clinically relevant unilateral ischemia-reperfusion murine model of AKI at days 1, 2, 4, 7, 11, and 14 after AKI onset. Using real-time quantitative PCR, immunofluorescence, Western blotting, and both chromogenic and single-molecule in situ hybridizations, we validated AKI signatures in multiple experiments.
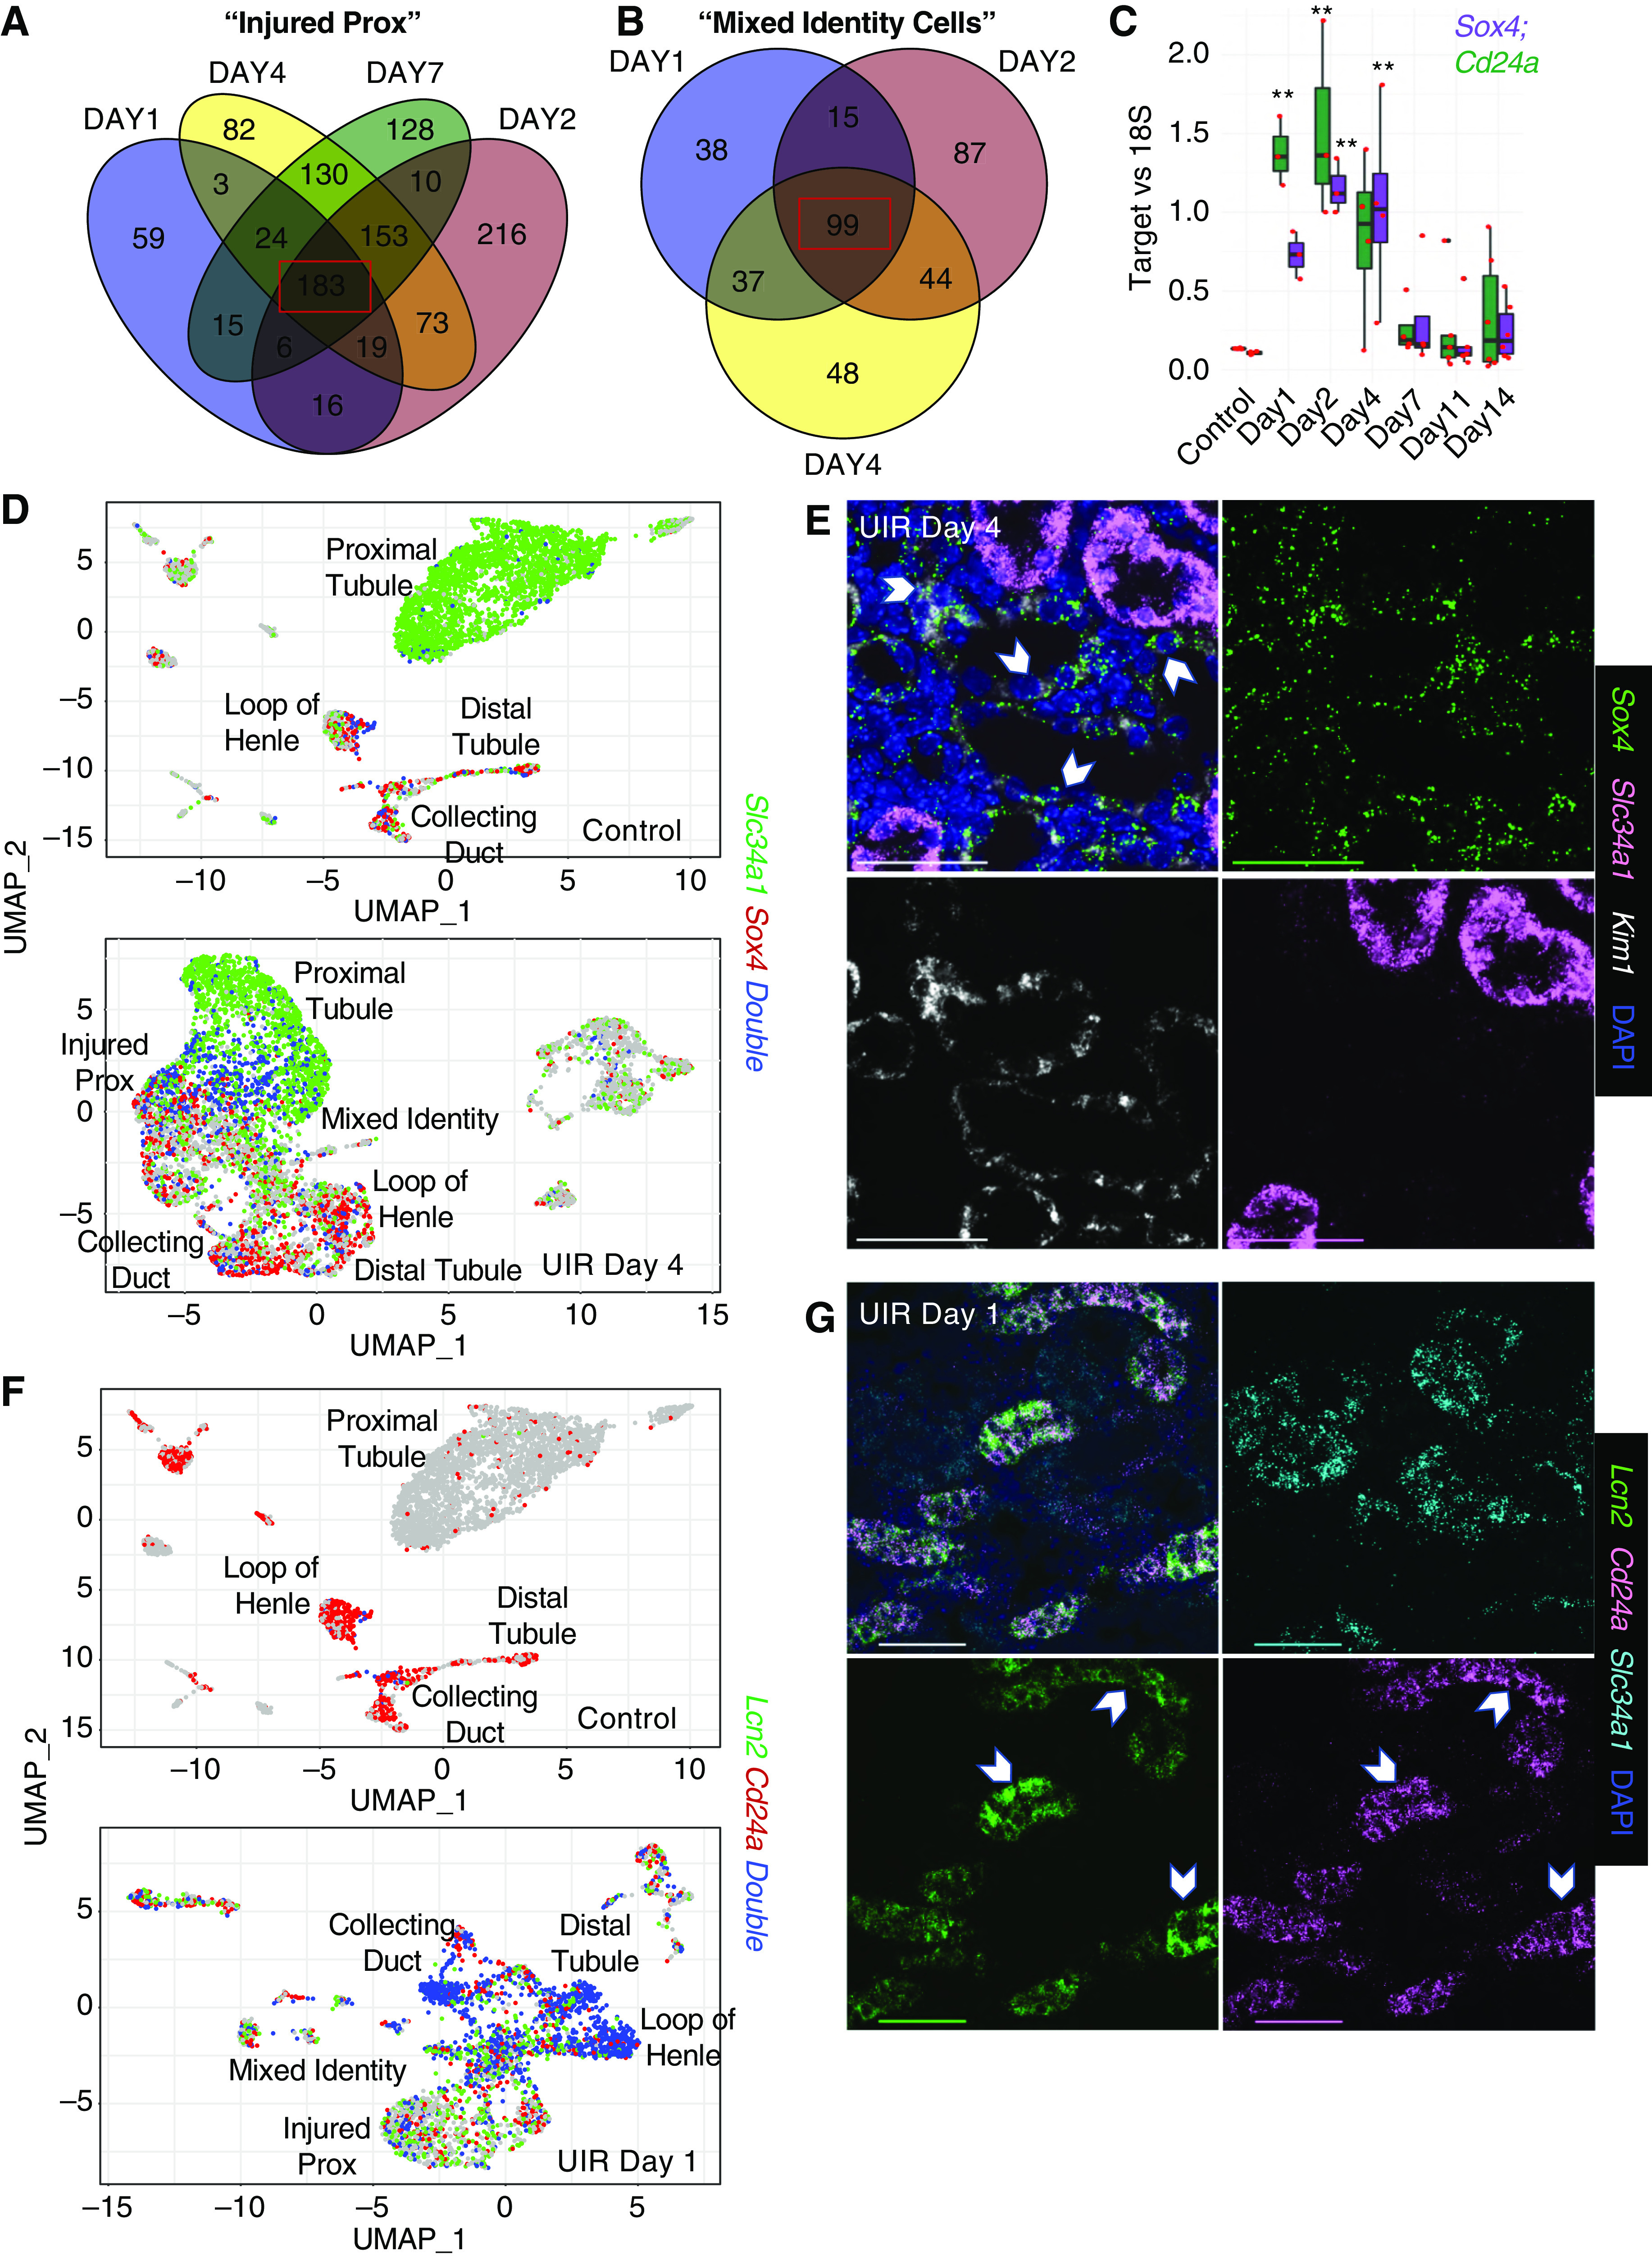
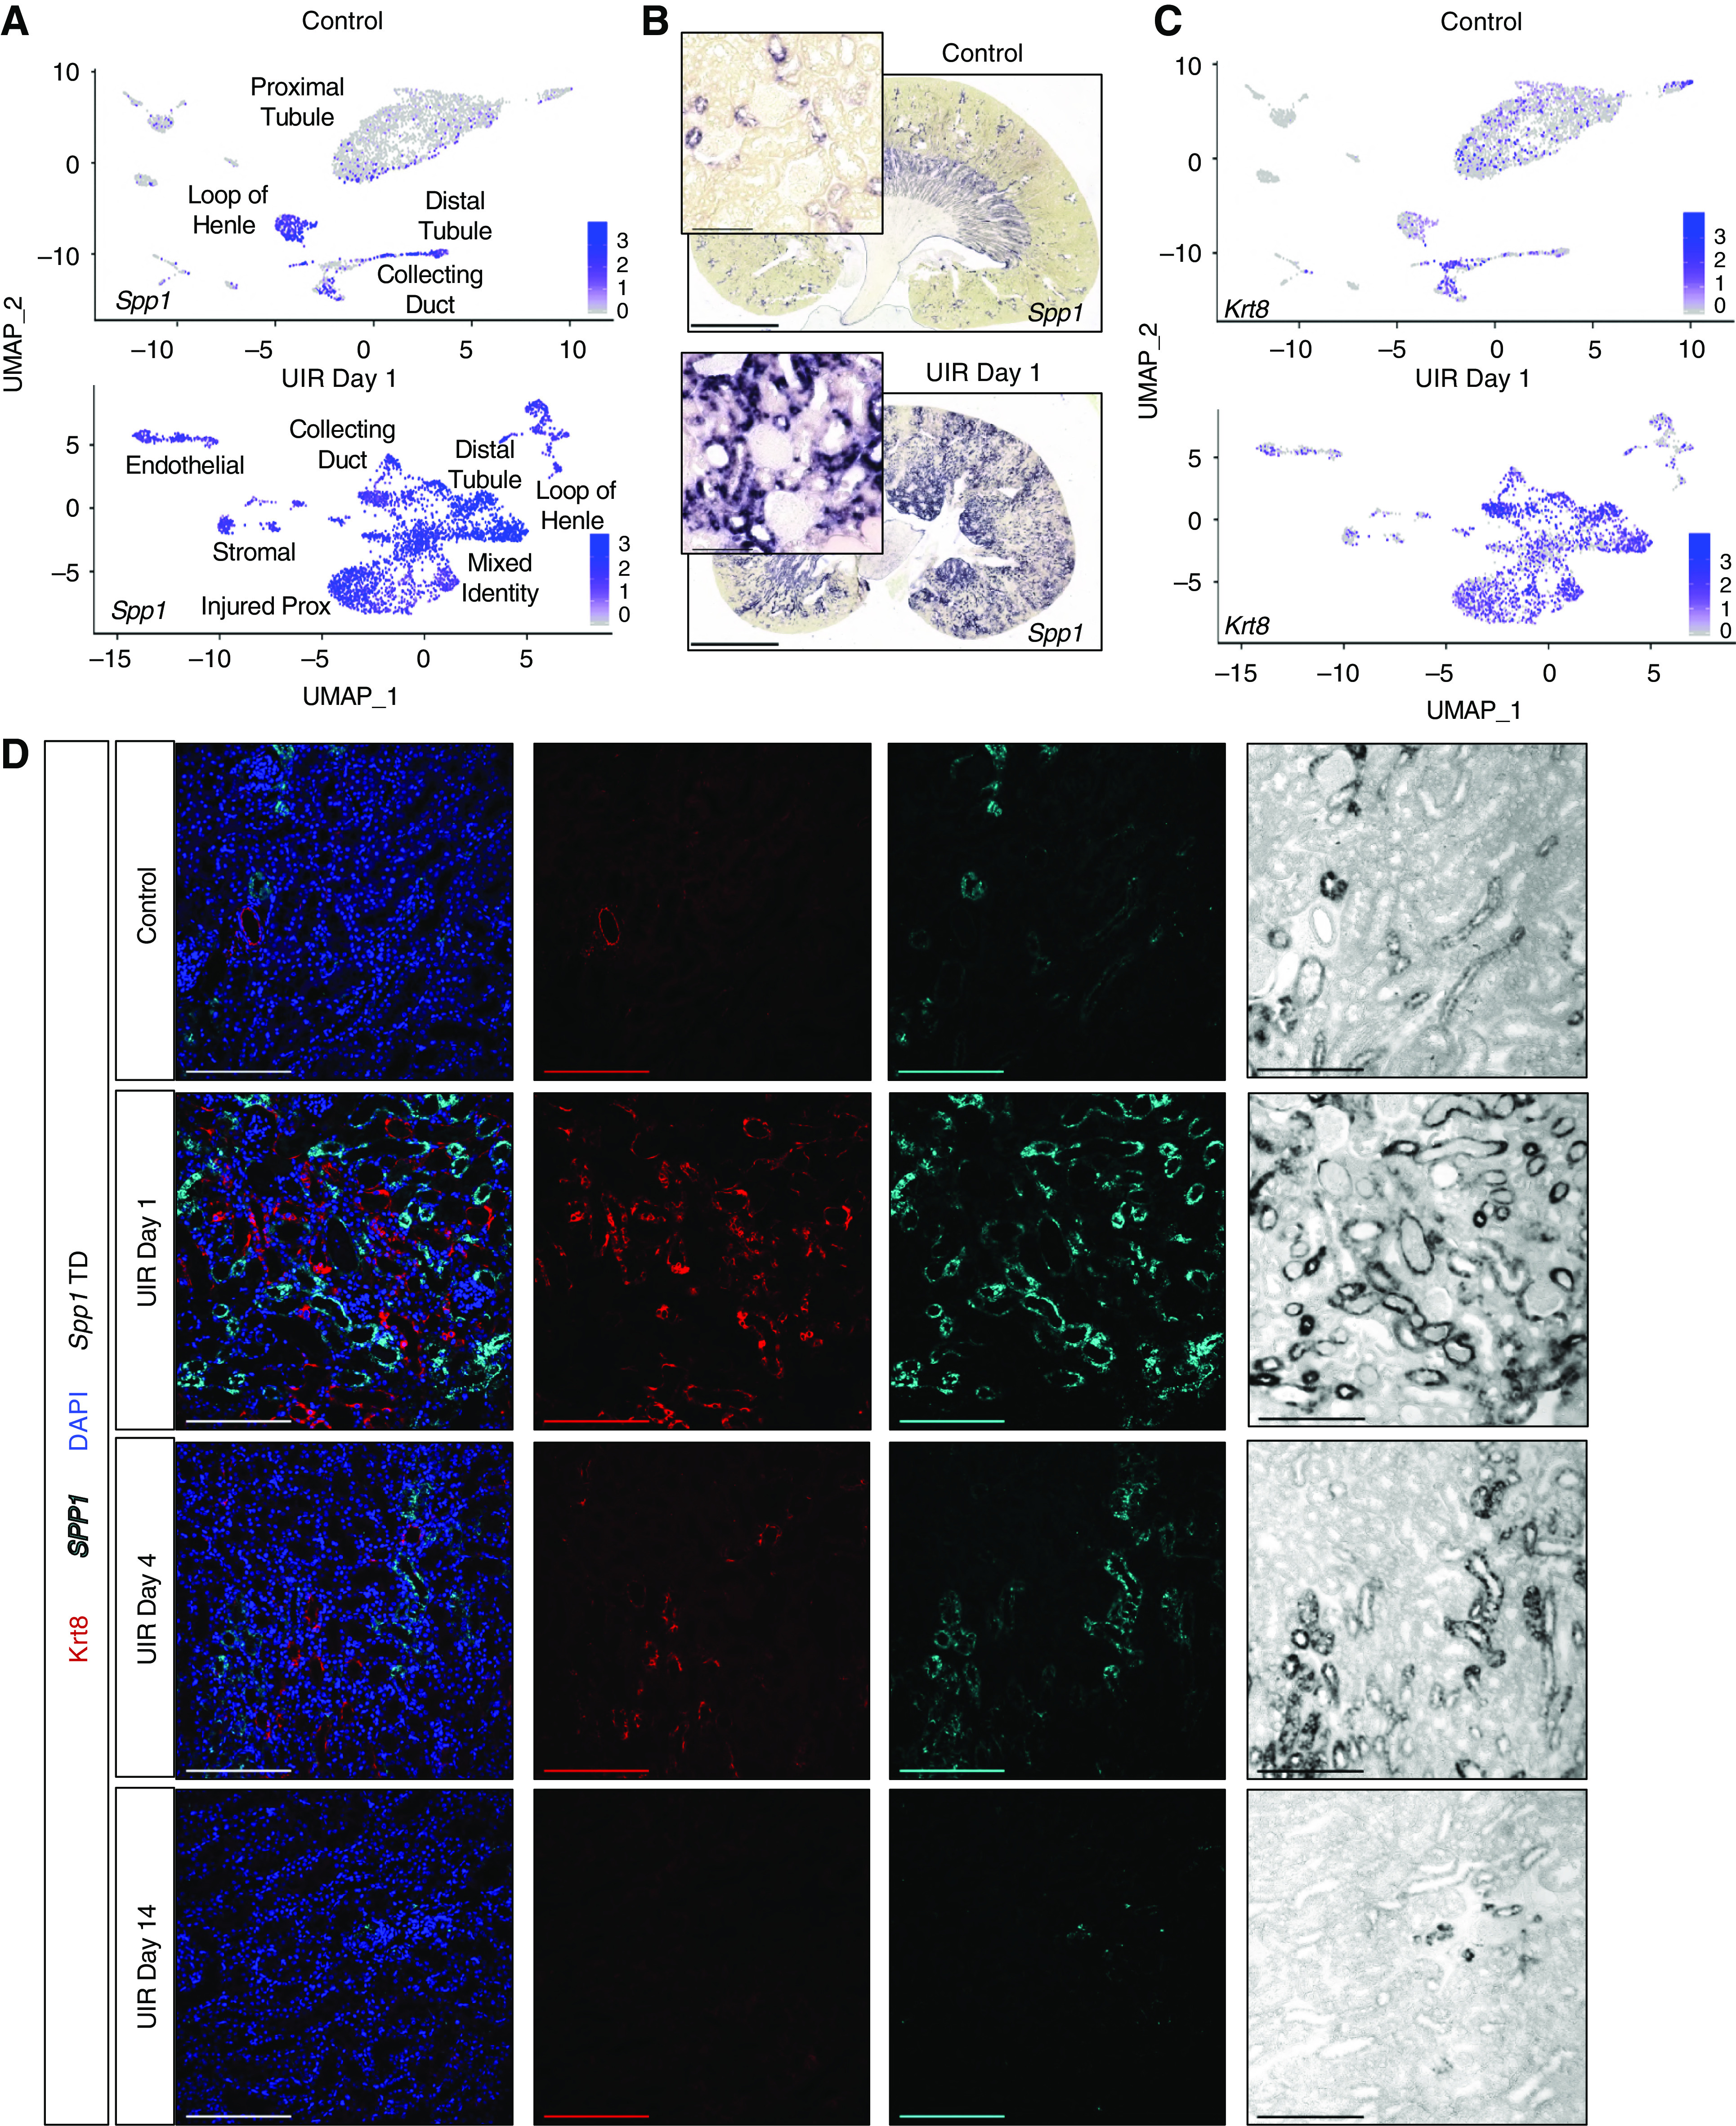
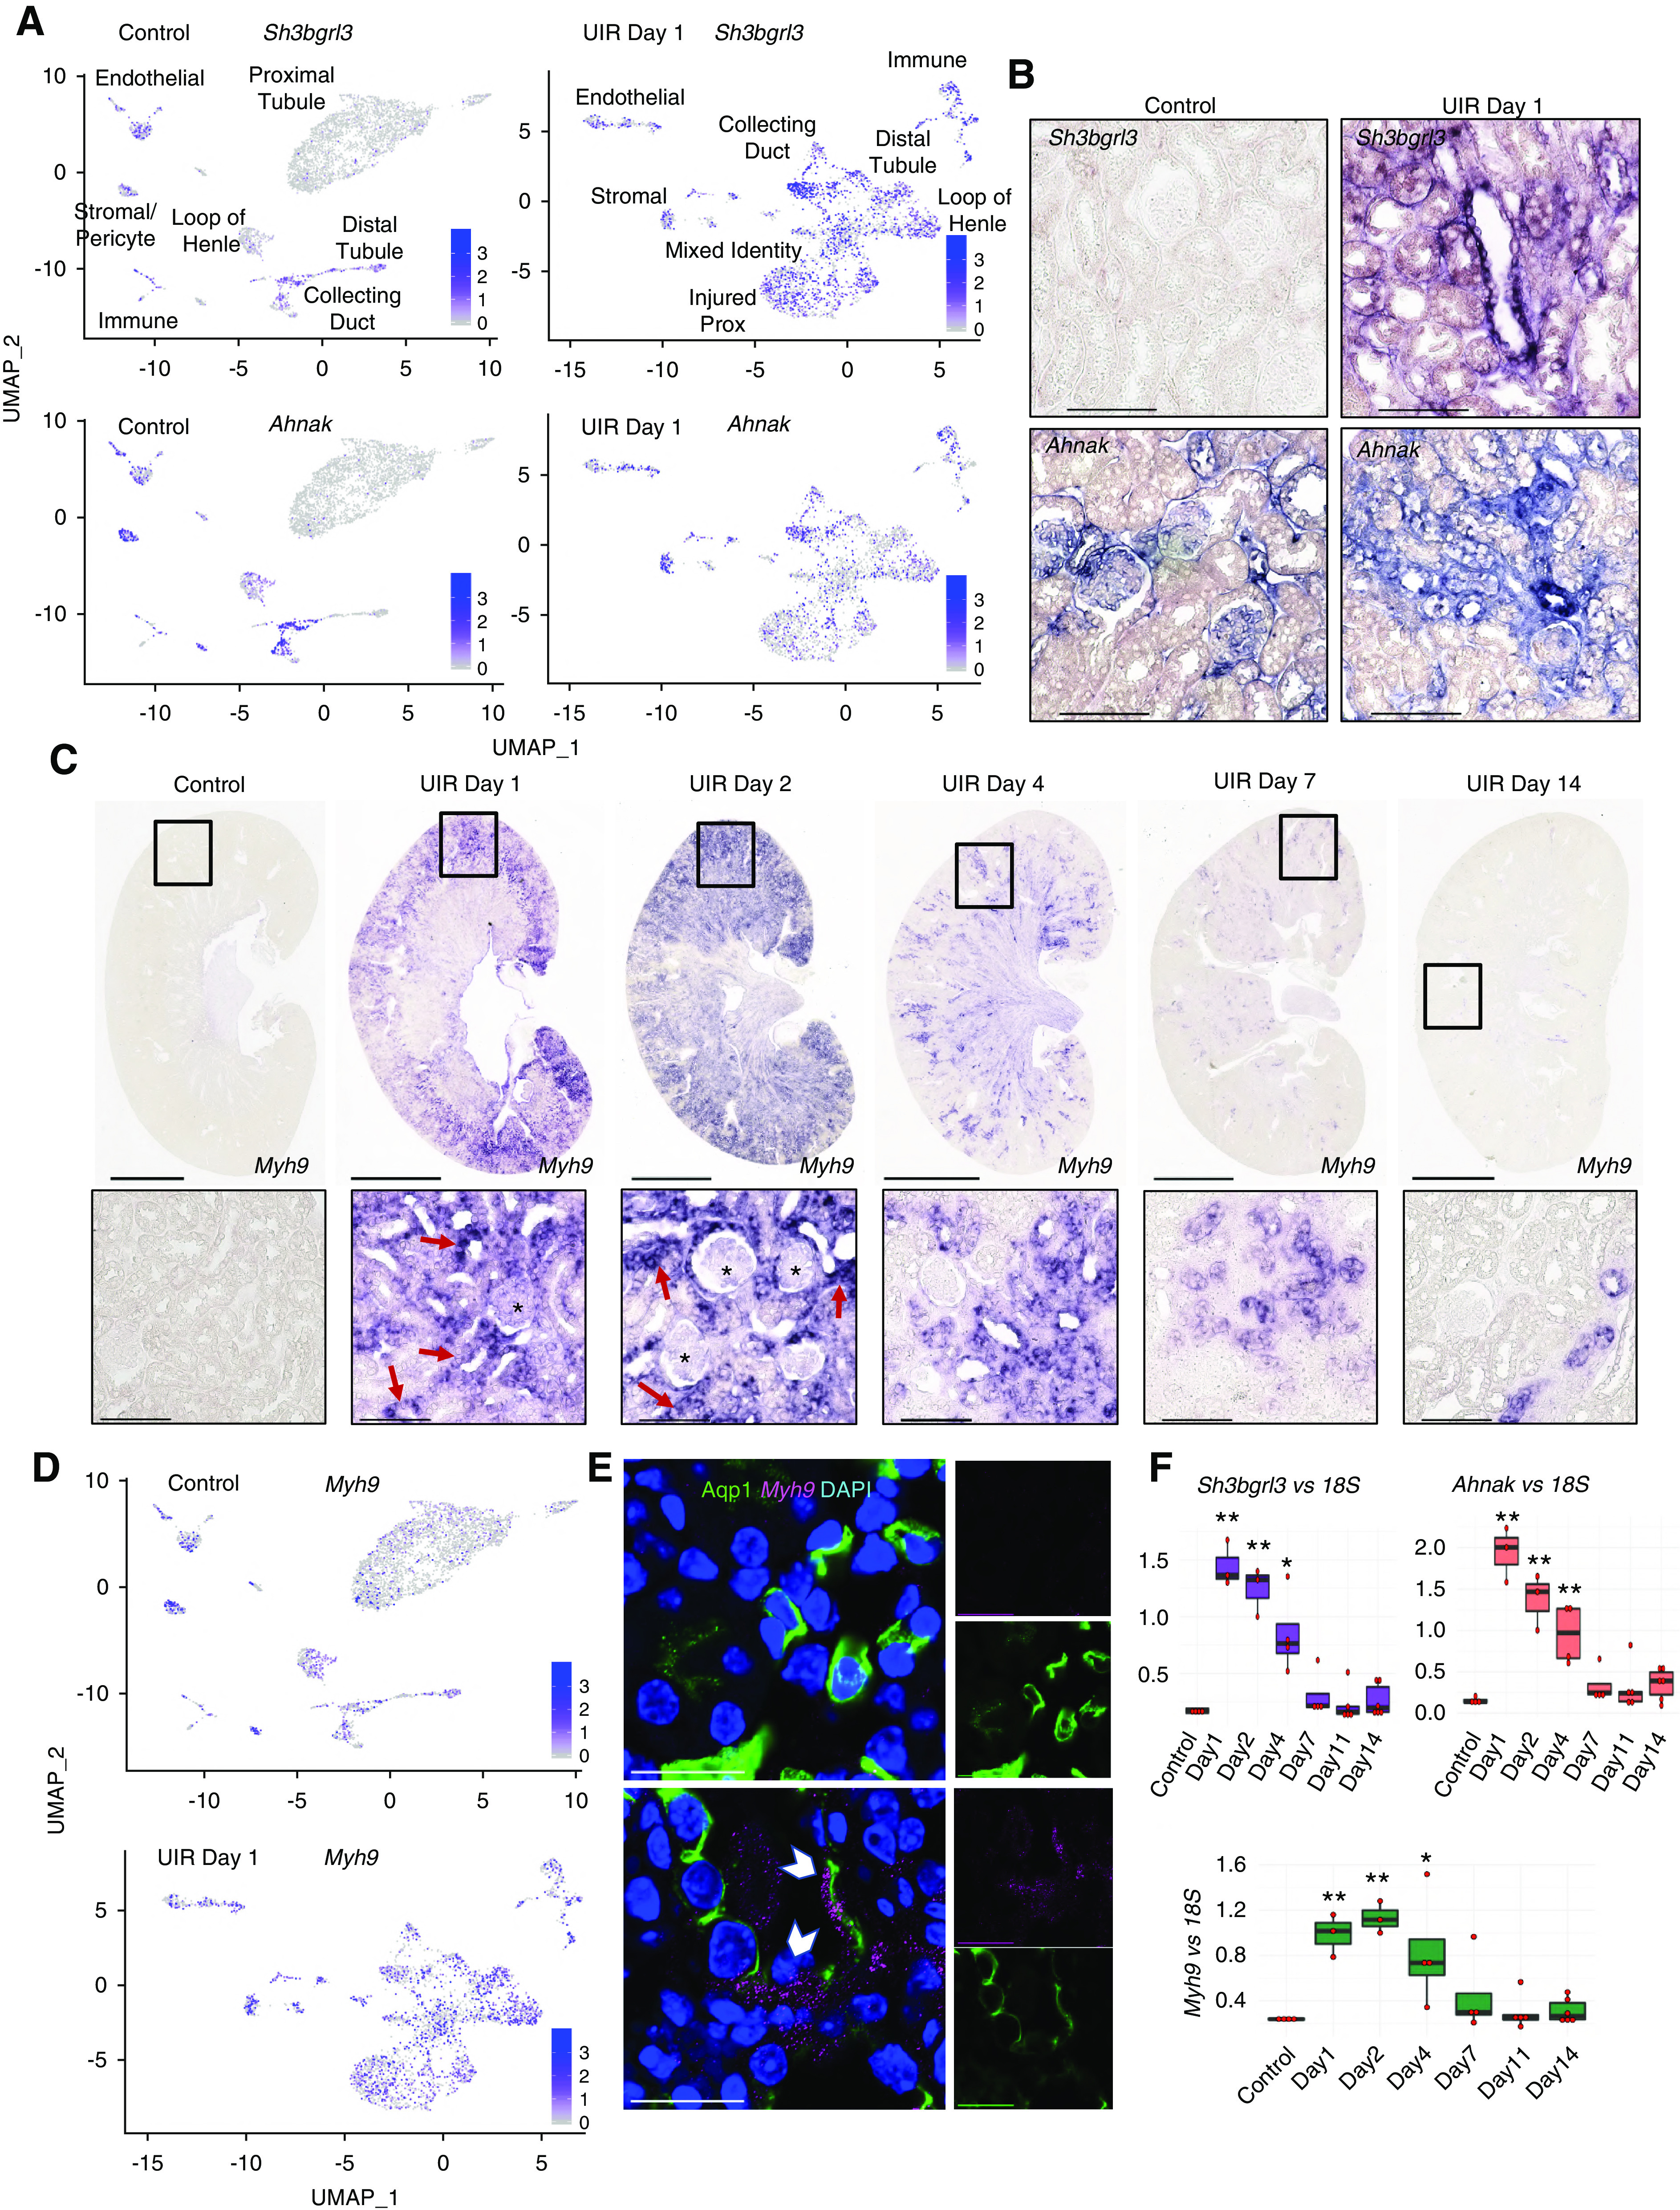
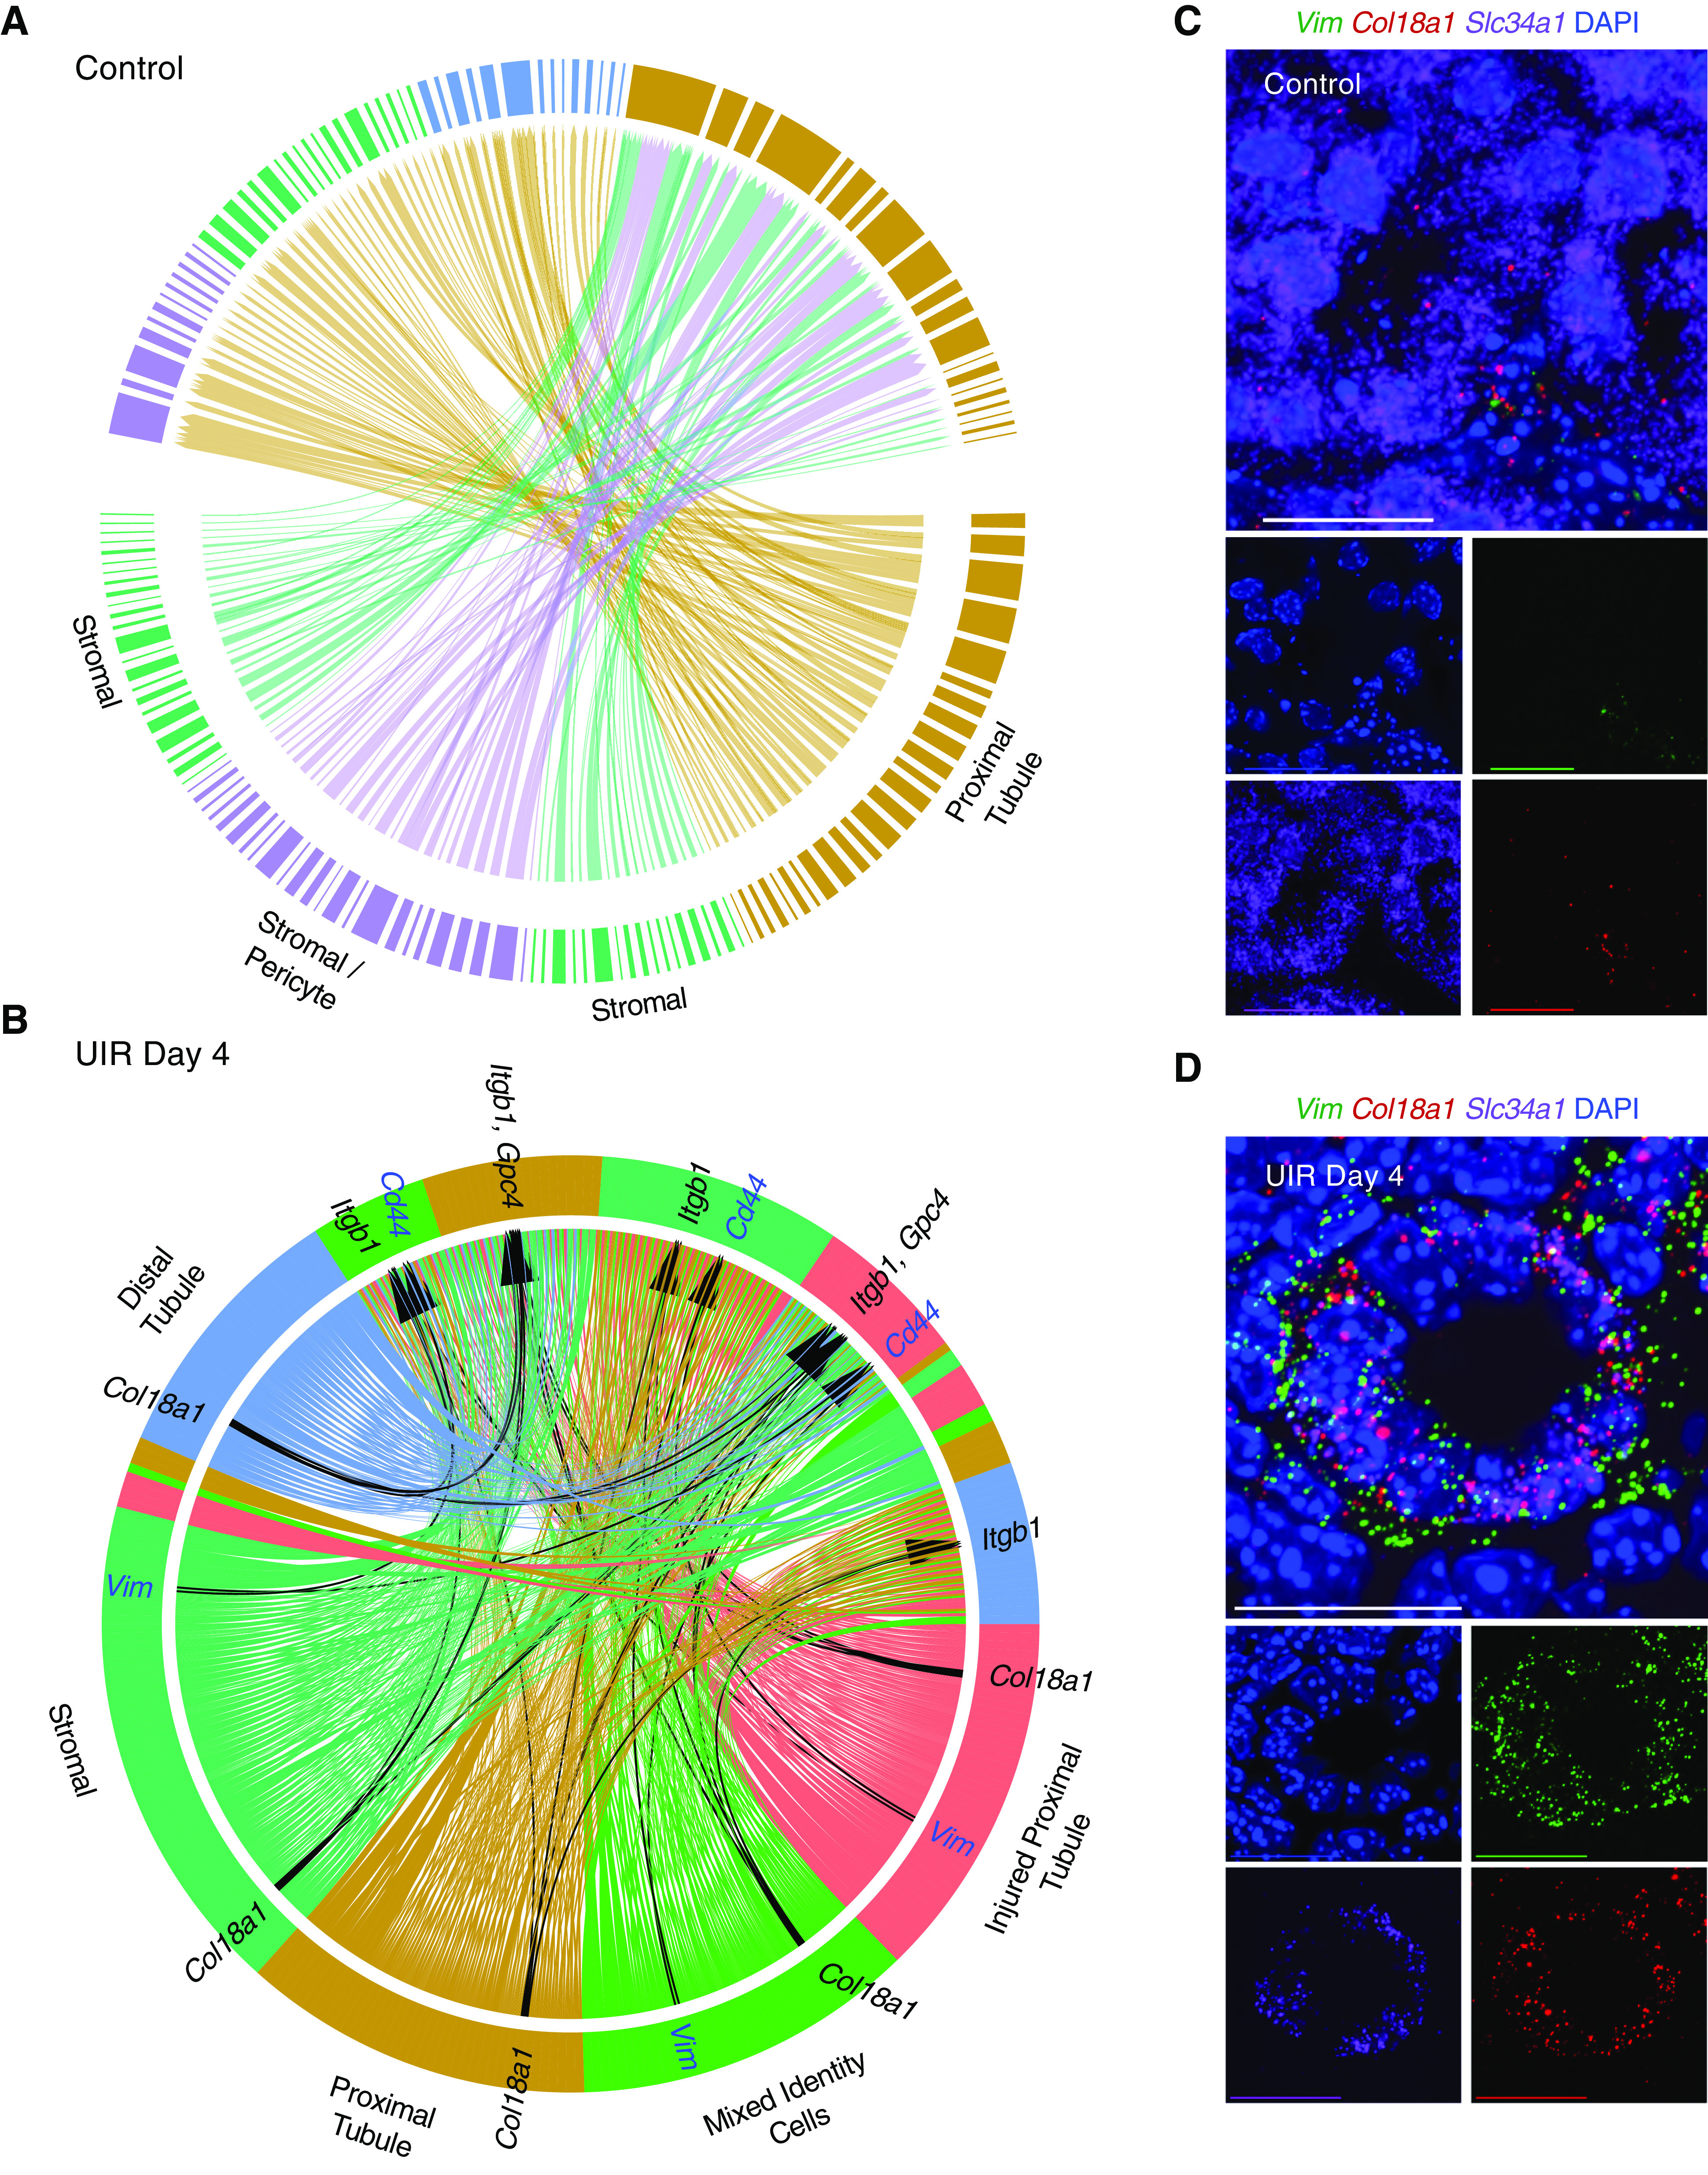
Results: Our findings show the time course of changing gene expression patterns for multiple AKI stages and all renal cell types. We observed elevated expression of crucial injury response factors-including kidney injury molecule-1 (Kim1), lipocalin 2 (Lcn2), and keratin 8 (Krt8)-and of several novel genes (Ahnak, Sh3bgrl3, and Col18a1) not previously examined in kidney pathologies. AKI induced proximal tubule dedifferentiation, with a pronounced nephrogenic signature represented by Sox4 and Cd24a. Moreover, AKI caused the formation of "mixed-identity cells" (expressing markers of different renal cell types) that are normally seen only during early kidney development. The injured tubules acquired a proinflammatory and profibrotic phenotype; moreover, AKI dramatically modified ligand-receptor crosstalk, with potential pathologic epithelial-to-stromal interactions. Advancing age in AKI onset was associated with maladaptive response and kidney fibrosis.
Conclusions: The scRNA-seq, comprehensive, cell-specific profiles provide a valuable resource for examining molecular pathways that are perturbed in AKI. The results fully define AKI-associated dedifferentiation programs, potential pathologic ligand-receptor crosstalk, novel genes, and the improved injury response in younger mice, and highlight potential targets of kidney injury.
Keywords: acute kidney injury; cellular crosstalk; renal developmental genes; single-cell.
Copyright © 2020 by the American Society of Nephrology.
Figures
Comment in
-
The molecular genetics of AKI.Nat Rev Nephrol. 2021 Jan;17(1):14. doi: 10.1038/s41581-020-00378-z. Nat Rev Nephrol. 2021. PMID: 33199853 No abstract available.
References
-
- Hoste EAJ, Kellum JA, Selby NM, Zarbock A, Palevsky PM, Bagshaw SM, et al. .: Global epidemiology and outcomes of acute kidney injury. Nat Rev Nephrol 14: 607–625, 2018. - PubMed
Publication types
MeSH terms
Grants and funding
LinkOut - more resources
Full Text Sources
Other Literature Sources
Molecular Biology Databases
Research Materials
Miscellaneous
