Review
. 2020 Oct 28;84(4):e00008-20.
doi: 10.1128/MMBR.00008-20. Print 2020 Nov 18.

Bacterial Vivisection: How Fluorescence-Based Imaging Techniques Shed a Light on the Inner Workings of Bacteria

Affiliations
Review

Bacterial Vivisection: How Fluorescence-Based Imaging Techniques Shed a Light on the Inner Workings of Bacteria

Alexander Cambré et al. Microbiol Mol Biol Rev. .

Abstract

The rise in fluorescence-based imaging techniques over the past 3 decades has improved the ability of researchers to scrutinize live cell biology at increased spatial and temporal resolution. In microbiology, these real-time vivisections structurally changed the view on the bacterial cell away from the "watery bag of enzymes" paradigm toward the perspective that these organisms are as complex as their eukaryotic counterparts. Capitalizing on the enormous potential of (time-lapse) fluorescence microscopy and the ever-extending pallet of corresponding probes, initial breakthroughs were made in unraveling the localization of proteins and monitoring real-time gene expression. However, later it became clear that the potential of this technique extends much further, paving the way for a focus-shift from observing single events within bacterial cells or populations to obtaining a more global picture at the intra- and intercellular level. In this review, we outline the current state of the art in fluorescence-based vivisection of bacteria and provide an overview of important case studies to exemplify how to use or combine different strategies to gain detailed information on the cell's physiology. The manuscript therefore consists of two separate (but interconnected) parts that can be read and consulted individually. The first part focuses on the fluorescent probe pallet and provides a perspective on modern methodologies for microscopy using these tools. The second section of the review takes the reader on a tour through the bacterial cell from cytoplasm to outer shell, describing strategies and methods to highlight architectural features and overall dynamics within cells.

Keywords: GFP; advanced microscopy; bacterial physiology; dyes; fluorescence; fluorescence microscopy.


Figures

FIG 1
FIG 1
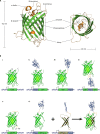
Tertiary structure and tagging possibilities of (auto)fluorescent proteins. (A) Typical structure of an (auto)fluorescent protein exemplified by GFPS65T (; PDB ID 1EMA). This probe family is characterized by the typical 11-stranded, β-barrel geometry that is found in all FPs known to date and that forms a protective structure around the endogenous, hexapeptide chromophore. Both the N and C termini of the protein remain surface exposed in the tertiary structure and are accessible as protein fusion linkers. The dimensions given are specific to GFP. (B) Overview of the different tagging possibilities of FPs and their structural variants. It is important to note that the chromophore of these fluorescent probes forms spontaneously under aerobic conditions through a self-catalyzed folding mechanism and intramolecular rearrangements and has no need for exogeneous cofactors. (i) FPs can be used to report on promoter activity by putting the FP gene under the control of the promoter of interest (i.e., transcriptional fusion). (ii to iv) The rigid protein topology and surface-exposed termini of FPs support the formation of protein chimera between the fluorescent probe and a target protein. The protein of interest can be translationally fused to one of the termini of the FP or can be inserted internally in the probe sequence to function as a sandwich fusion. (v) FPs have proven to be extremely robust to circular permutations. In circular permutation, the original N and C termini are joined, and new termini are created. This modification changes the characteristics of the fluorescent probe without changing the overall structure, nor its ability to fluoresce. (vi) In Bimolecular Fluorescence Complementation (BiFC or split FP) FPs are split into two separate, nonfluorescent fragments. When these two fragments are brought into close proximity of each other via the interaction of their corresponding fusion partners, a native-like fluorescent complex can be reconstituted. Native N and C termini are indicated in panel i, the target protein (exemplified by PDB ID 1DZO) (863) and its gene are indicated in purple, an apostrophe indicates a split-up gene structure, cp indicates circular permutation, N* and C* indicate nonnative termini, Split-N or Split-C indicate split fragments corresponding to the original N- or C-terminal domain of the cognate protein, and orange lines represent (additional) linker amino acids or peptides.
FIG 2
FIG 2
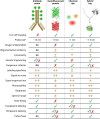
Comparison of antibody probes, (auto)fluorescent proteins, chemical dyes, and hybrid tags for use in fluorescence microscopy. A red cross (“X”) indicates the probe type is not compatible with this feature or application; a green check mark indicates the probe type is compatible with this feature or application; a green check mark/red cross combination indicates that some specific probes within this category are compatible with this feature or application. Other symbols: ++, excellent performance; +, very good performance; ±, good performance; , poor performance. NA, the label is not relevant to this probe type. *Probe size values are based on a study by Turkowyd et al. (864).
FIG 3
FIG 3
Microscopy setups and strategies. (A) Overview of the different microscopy setups routinely used for fluorescence microscopy in bacteria and their excitation zones. (Left to right) During sample excitation in wide-field epifluorescence microscopy, a wide cone of light with a specific wavelength evenly and simultaneously activates all the fluorophores in a large 3D volume. Fluorophores in the different z planes throughout the sample will contribute to the eventual signal. Confocal microscopy, on the other hand, uses point illumination to scan across the sample and enables optical sectioning throughout the sample. In TIRF, only fluorophores close to the surface will be excited by an evanescent excitation wave created by illumination at or above the critical angle. Similarly, in HILO, the sample is illuminated at a subcritical angle, leading to an increased penetration depth of the signal. This supports the excitation of structures in both the bacterial outer shell, as well as in the cytoplasm, while keeping background fluorescence at a low level. Blue arrows indicate the direction of the illumination light. (B) The different imaging strategies discussed in this review are compared in terms of scope, resolution gain, technical setup, suited probe types, types of experiments in which they are routinely used, and their specific benefits and drawbacks.
FIG 4
FIG 4
Overview of strategies to fluorescently label nucleic acids in bacteria. (A) Methods to visualize the genetic blueprint of a bacterium can be subdivided into three categories depending on their mode-of-action: whole-genome labeling (diagrams 1 to 3), locus labeling (diagrams 4 and 5), and feature labeling (diagrams 6 to 8). For whole-genome labeling, the strategies support the labeling of the entire nucleoid (and other DNA elements) in the cell and are regarded as nonspecific, referring to the ample presence of labeling sites rather than to the labeling mechanism itself. (Diagram 1) Fluorescently labeled DNA-binding proteins such as nucleoid-associated proteins (NAPs) may be used to decorate the chromosomal DNA. Depending on the intrinsic features of the DNA-binding protein at hand, a different localization motif and coverage density will be attained. (Diagram 2) Likewise, small DNA-binding molecules can be used for whole-genome labeling. Every type of DNA-binding dye targets a specific (recurrent) structural motif in the DNA macromolecule. (Diagram 3) Adding fluorescently labeled dNTP derivates to the growth medium leads to effective incorporation of these fluorescent precursors in the newly synthesized DNA strands. For certain applications, increased resolution into a specific region of the genetic material (i.e., locus labeling) may be desirable. (Diagram 4) A fluorescent repressor-operator system (FROS) incorporates a tandem array of operator DNA into the region of interest which specifically attracts the cognate fluorescently labeled repressor to highlight the targeted DNA. (Diagram 5) Similarly, a single parS locus can be inserted into the genome to serve as a binding site for fluorescent ParB protein. These latter proteins form a filament on parS that spreads out into neighboring sequences and forms a detectable focus. DNA-specific features such as DNA mismatches and methylation patterns may also serve as probe binding sites to highlight specific events or DNA strands (i.e., feature labeling). (Diagram 6) The small fraction of (spontaneous) mismatches that occur during DNA replication and become fixed into the DNA can be visualized through the exploitation of the methyl-directed mismatch repair system (MMR). Here, fluorescent MutL polymerizes at the mutated site and prevents mismatch-bound (and unlabeled) MutS from sliding away from the targeted region. (Diagram 7) Double-stranded DNA breaks can be fluorescently labeled using the Gam protein from bacteriophage Mu that directly binds to the double-stranded DNA ends. (Diagram 8) SeqA-FP has a high affinity for hemimethylated DNA and solely binds on DNA duplexes in which one of the strands is methylated (red circle). (B) Overview of methods that enable direct RNA visualization in individual bacterial cells, with only (iii to v) supporting real-time, in vivo measurements of RNA dynamics in the cytoplasm. (i and ii) In fluorescence in situ hybridization (FISH), complementary oligonucleotides labeled with fluorophores are added exogenously to light up the RNA molecules of interest in fixed and permeabilized cells. These probes can either target the native RNA molecule (i) or a genetically fused operator array added to the RNA molecule (ii), with the latter approach increasing sensitivity and signal-to-noise ratio. (iii) A fluorescent derivative of the RNA-binding coat protein of bacteriophage MS2 allows in vivo, real-time visualization of RNA molecules by targetting tandem repeats of its cognate stem-loop, transcriptionally linked to one of the UTRs of the target RNA (mostly 3′). (iv) Bimolecular Fluorescence Complementation (BiFC) in combination with a spliced eukaryotic initiation factor 4A (eIF4A) can be utilized to attain a very high signal-to-noise ratio. The labeled, dual eIF4 reporter only forms a reconstituted fluorescent complex when it binds to its cognate, 58-nucleotide long binding site attached to the target RNA molecule. The latter system can be modified with an additional split aptamer (v) to minimize the amount of interference in the biological system and alleviate the need for genetic alterations. In this approach, the 58-nucleotide stem-loop is split into two modules interconnected with an internal flexible linker and reforms via an interaction with the specific, native RNA molecule of interest.
FIG 5
FIG 5
Super-resolution microscopy and single-molecule tracking as tools to unravel the intracellular organization of bacterial transcription. (A) Under nutrient-rich conditions, RNAP is clustered in foci or transcription factories throughout the cell, while under nutrient-poor conditions, the RNAP molecules remain fairly homogenously distributed over the nucleoid (Photos are reproduced from reference with permission of the Biophysical Society.) Scale bar, 0.5 μm. Each image square is built out of a conventional fluorescence (top left image), brightfield image (top right image), and a PALM super-resolution image (large bottom image). (B) In rich medium conditions, these RNAP foci form a typical dual-lobed spatial pattern that coarsely mimics the DNA outlines. The left image shows the localization pattern of all individual RNAP molecules in three representative living E. coli cells grown under nutrient-rich medium conditions (blue, low abundance; red, high abundance). The right image shows a two-dimensional, normalized histogram of the RNAP localizations in 664 cells under rich medium growth conditions (Adapted from reference with permission of the National Academy of Sciences, U.S.A.). Scale bar, 0.5 μm. The color bar indicates the number of localization events in each bin; the bin size of the 2D histogram is 100 × 100 nm. (C) RNAP foci almost exclusively colocalize with rRNA transcriptional activity (i.e., with nascent pre-rRNA clusters) in nutrient-rich conditions. (Left) A FISH probe is specifically targeted to the 5′ leader sequence of 16S pre-rRNA, a region that is lost before mature rRNA is incorporated into the ribosomes. (Right) Representative super-resolution images of two cells with, from left to right, the localization pattern of pre-rRNA, the localization pattern for RNAP molecules, and the combined two-color super-resolution image (red, RNAP-PAmCherry; green, pre-rRNA FISH) (Adapted from reference with permission of the National Academy of Sciences, U.S.A.). Scale bar, 0.5 μm. (D) Schematic representation of “tracking PALM” as a method to study intracellular mobility of proteins such as RNAP and transcription factors at native (and higher) copy numbers. The protein factor of interest is labeled with a photoactivatable fluorescent probe to allow activation of single molecules in each activation round. The activated, fluorescently labeled target is subsequently tracked as a single particle until it eventually bleaches. For this cycle of activation, tracking and bleaching can be continued until all photoactivatable probes are bleached, giving rise to a collection of individual tracks. Original figure indexations and scale bars were either removed or masked without altering the content of the images. New indexations and scales were added to provide consistency throughout the figure.
FIG 6
FIG 6
High-resolution imaging drives the untangling of the bacterial divisome architecture: examples of FtsZ visualization through time. Much of the current understanding on the bacterial cytokinesis machinery stems from visual experiments with high-resolution imaging, fine-tuning older “divisome paradigms” that were partially based on artifact-prone techniques. In this figure, we give an overview of how FtsZ visualization improved in the past 3 decades, leading to a better understanding of Z ring formation and localization. (A) Immunogold labeling experiments gave the first structural insight into FtsZ midcell localization during cytokinesis, a structure now known as the Z ring. (Adapted from reference by permission from Springer Nature.) (B) FtsZ localization in fixed cells of different fts mutants (i, ftsA mutant; ii, ftsQ mutant) visualized with immunofluorescence microscopy. (Photos reproduced from reference with permission.) (C) First use of GFP for labeling FtsZ in living cells. The left panel shows the formation of Z rings at septation sites in a filamentous cell. The top right panel shows a wide-field fluorescence image that was processed with a deconvolution algorithm, displaying apparent helical structures in a growing E. coli cell. In the bottom right image, the FtsZ ring localizes to the internucleoid space. Left to right in this panel: DAPI (nucleoid), GFP (FtsZ), and combined image. (Photos reproduced from reference with permission of the National Academy of Sciences, U.S.A.). Scale bar, 1 μm. (D) FRAP time series indicating the bleached area (white arrow) and the recovery of FtsZ (time-stamp) after photobleaching. (Adapted from reference with permission.) The rise of more technically advanced studies enabled a better understanding of the assembly dynamics of the FtsZ ring. (E) Conventional fluorescence microscopy supported a model for a smooth-cable like appearance of FtsZ helical filaments in growing cells. In the top row, a cell with a FtsZ helix is shown, while the bottom row displays a cell with a Z ring and FtsZ helix. Both rows are composed of the original image (i), an image processed with a 3D deconvolution algorithm (ii), and a schematic representation of the interpreted FtsZ location in the cell (iii) (Adapted from reference with permission of John Wiley and Sons.) Scale bar, 1 μm. (F) With super-resolution microscopy and its increased resolution, it can be seen that helical Z filaments are in fact highly irregular and discontinuous. Panel i is a confocal image, and panel ii is the concomitant STED super-resolution image (Photos reproduced from reference with permission of Elsevier.) Scale bar, 1 μm. Likewise, the Z structure at the midcell was shown to consist predominantly of patches and incomplete, discontinuous rings, as shown in panel G. (G, i to iv) Distribution of FtsZ molecules in the Z ring, as imaged with 3D-SIM. Arrows point toward small gaps in the fluorescence intensity profile indicative of lower abundance of FtsZ at those locations. (Adapted from reference , published under the terms of the Creative Commons Attribution License.) (H) PALM images of FtsZ localization during cell division with images in the x-y dimension (i and ii), the corresponding 2D cross-section image of the region indicated with the arrow (i.a and ii.a), and the three-dimensional volume reconstruction (ii.a and ii.b). (Photos reproduced from reference with permission of the National Academy of Sciences, U.S.A.) Scale bar, 0.5 μm. Original figure indexations and scale bars were either removed or masked without altering the content of the images. New indexations and scales were added to provide consistency throughout the figure.
FIG 7
FIG 7
Labeling the peptidoglycan. Schematic representation of the different described approaches for in vivo labeling of the peptidoglycan layer based on the E. coli PG build-up. The peptidoglycan layer of bacteria consists of alternating β-1,4-linked N-acetylglucosamine (GlcNAc; light brown hexagon) and N-acetylmuramic acid (MurNAc; dark brown hexagon) monosaccharides, interlinked via short peptide stems (four or five amino acids; colored circles) on the carboxyl group of the MurNAc subunit. The precursors of these cross-links are pentapeptide chains containing both l- and d- amino acids accompanied by a single dibasic amino acid, here represented by meso-diaminopimelic acid (meso-DAP; light yellow circle). In the cytoplasm, GlcNAc-MurNAc-pentapeptide precursors are converted into lipid-linked intermediates and transported over the membrane into the extracytoplasmic space, where they are incorporated in the existing meshwork. (Box 1) Wheat germ agglutinin (WGA) binds specifically to all GlcNAc residues in the peptidoglycan framework and enables highlighting the entire PG sacculus. (Box 2) The use of fluorescently labeled antibiotics such as vancomycin or ramoplanin can support visualization of nascent PG in living cells. Vancomycin detects the terminal d-Ala-d-Ala (light blue circles) residues found on lipid-linked PG precursors and recently inserted, uncrosslinked subunits at the growing end of a glycan strand (green line). Ramoplanin, on the other hand, binds to the reducing ends of the growing glycan chains found at the initiation sites of PG synthesis and on lipid II carriers (red line). (Box 3) Fluorescent d-amino acids (FDAA) can be integrated into the bacterial cell wall via a periplasmic remodeling reaction on free pentapeptides in the existing PG promoted by d,d- and l,d-transpeptidases. (Box 4) PG cross-linking event are specifically visualized by using fluorescent stem peptide mimics (FSPM) that imitate the natural substrate in the transpeptidation reaction and install fluorophores instead of cross-links in the PG framework. (Box 5) PG sacculus labeling can also be achieved via the metabolic incorporation of modifiable MurNac carbohydrate subunits into the core structure, followed by fluorescent labeling via click chemistry.
FIG 8
FIG 8
Labeling extracellular molecular complexes with fluorescence. Schematic overview of commonly used strategies to label extracellular structures in bacteria, exemplified by a flagellum case study. Bulky probes such as fluorescence conjugated antibodies and (auto)fluorescent proteins (boxes 1 and 2, respectively) targeted to specific subunits of the nanomachine may lead to visualization artifacts. Therefore, smaller labeling probes are often used to minimize the influence of the label on the extracellular complex. Fluorophore-linked succinimydyl (NHS) esters (box 3) can react with the primary amine (R-NH2) group on the N-terminal and lysine residues found in proteins on both the cell body and the proteinaceous flagellum, fluorescently labeling mostly the latter because of its higher primary amine-to-surface ratio. Thiol-reactive maleimide dyes (box 4) can increase the signal-to-noise ratio as they form covalent bonds with free sulhydryl (-SH) groups, naturally occurring in relatively small numbers on the cell surface. Through minor genetic modifications (i.e., insertion or removal of cysteines), the desired extracellular structure can be highlighted with this type of dye. Both of these strategies (boxes 3 and 4) enable the imaging of living cells but do not support real-time staining as specific chemical conditions and long staining periods are required. Small hybrid probes, such as tetracysteine tags (TC; here exemplified by -C-C-P-G-C-C-) (box 5), do allow live staining of complexes on the outer shell of the bacterial cell since unbound labels are low fluorescent and reaction conditions are mild. (Box 6) Dyes such as NanoOrange that specifically interact with the hydrophobic membrane may also be used for real-time imaging in strains where membrane sheaths cover the molecular nanomachine.

References

    1. Lane N. 2015. The unseen world: reflections on Leeuwenhoek (1677) “Concerning little animals.” Philos Trans R Soc Lond B Biol Sci 370:20140344. doi:10.1098/rstb.2014.0344. - DOI - PMC - PubMed
    1. Maddock JR, Shapiro L. 1993. Polar location of the chemoreceptor complex in the Escherichia coli cell. Science 259:1717–1723. doi:10.1126/science.8456299. - DOI - PubMed
    1. Chalfie M, Tu Y, Euskirchen G, Ward WW, Prasher DC. 1994. Green fluorescent protein as a marker for gene expression. Science 263:802–805. doi:10.1126/science.8303295. - DOI - PubMed
    1. Arigoni F, Pogliano K, Webb CD, Stragier P, Losick R. 1995. Localization of protein implicated in establishment of cell type to sites of asymmetric division. Science 270:637–640. doi:10.1126/science.270.5236.637. - DOI - PubMed
    1. Thanbichler M, Shapiro L. 2008. Getting organized: how bacterial cells move proteins and DNA. Nat Rev Microbiol 6:28–40. doi:10.1038/nrmicro1795. - DOI - PubMed

Publication types

Substances

LinkOut - more resources