. 2020 Oct 28;10(1):18440.
doi: 10.1038/s41598-020-75505-8.

Proteomic signatures of acute oxidative stress response to paraquat in the mouse heart

Affiliations

Proteomic signatures of acute oxidative stress response to paraquat in the mouse heart

Vishantie Dostal et al. Sci Rep. .

Abstract

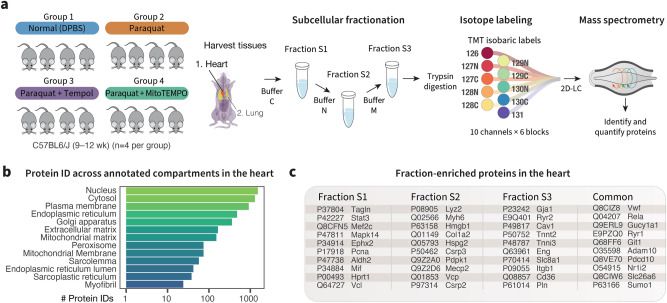
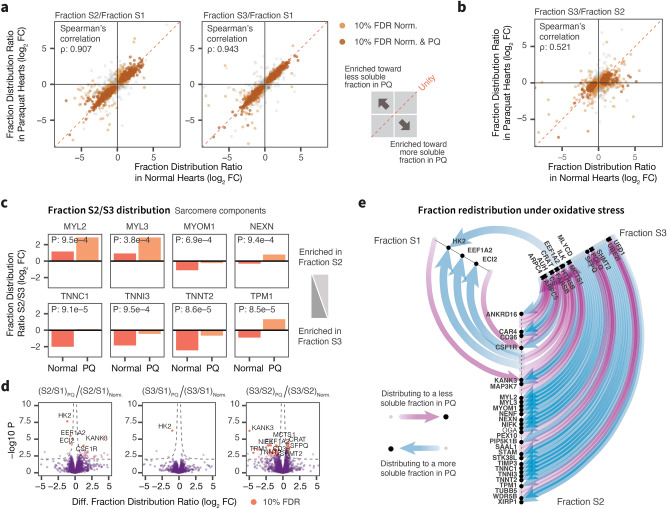
The heart is sensitive to oxidative damage but a global view on how the cardiac proteome responds to oxidative stressors has yet to fully emerge. Using quantitative tandem mass spectrometry, we assessed the effects of acute exposure of the oxidative stress inducer paraquat on protein expression in mouse hearts. We observed widespread protein expression changes in the paraquat-exposed heart especially in organelle-containing subcellular fractions. During cardiac response to acute oxidative stress, proteome changes are consistent with a rapid reduction of mitochondrial metabolism, coupled with activation of multiple antioxidant proteins, reduction of protein synthesis and remediation of proteostasis. In addition to differential expression, we saw evidence of spatial reorganizations of the cardiac proteome including the translocation of hexokinase 2 to more soluble fractions. Treatment with the antioxidants Tempol and MitoTEMPO reversed many proteomic signatures of paraquat but this reversal was incomplete. We also identified a number of proteins with unknown function in the heart to be triggered by paraquat, suggesting they may have functions in oxidative stress response. Surprisingly, protein expression changes in the heart correlate poorly with those in the lung, consistent with differential sensitivity or stress response in these two organs. The results and data set here could provide insights into oxidative stress responses in the heart and avail the search for new therapeutic targets.


Conflict of interest statement

The authors declare no competing interests.

Figures

Figure 1
Figure 1
Moderate and high doses of paraquat induce acute oxidative stress response proteins in the heart. (a) Moderate and high doses of paraquat for 24 h led to an increase in protein abundance of known paraquat-induced genes in the hearts including PDK4, MT1, and BCL2L1; t-test P<0.05; 0.005 vs. vehicle. (b) Moderate and high doses of paraquat for 24 h led to a robust increase in heme oxygenase 1 (HMOX1) as well as a moderate increase in the protein level of other NRF2-induced acute oxidative stress response elements in the heart; t-test P<0.05; 0.005 vs. vehicle. (c) A number of induced proteins remained elevated at 48 h after the paraquat dose including PDK4, MT1, and CAT, whereas other acute response elements including HMOX1 began to subside; numbers: t-test P values between 48 h vs. vehicle. (d) Pre-treatment of the anti-oxidant compound Tempol partially repressed the up-regulation of paraquat-induced and acute oxidative stress response proteins.
Figure 2
Figure 2
Mass spectrometry analysis of protein expression in normal mouse hearts and following acute paraquat exposure. (a) Experimental design. C57BL/6J mice (n = 4 per group) were treated with a vehicle (DPBS) or a moderate dose (50 mg/kg) of paraquat for 24 h. Additional groups were given the anti-oxidants Tempol and MitoTEMPO. Cardiac tissues were harvested, homogenized and further separated into three subcellular fractions (S1, S2, S3) using commercially available differential lysis buffers. The resulting proteins were digested and labeled with isotope tags, then combined for protein identification and quantification. (b) Number of proteins identified in the proteomics experiment across selected cellular compartments. (c) The subcellular fractions are enriched in different cellular compartments and proteins. Selected proteins relevant to cardiovascular research that are highly enriched in each fraction ( twofold, limma adjusted P0.01) or are shared across all fractions are shown.
Figure 3
Figure 3
Proteomic signatures of acute oxidative stress in the heart. (a) Paraquat preferentially causes the differential expression of proteins in the S2 fraction, which is enriched in proteins in the mitochondria, endoplasmic reticulum, and nucleus. Dashed lines: nominal significance at absolute logFC of 0.5 and P0.05 and 0.01, respectively. Brown data points are significantly differentially expressed at 10% false discovery rate; up to 30 differentially expressed proteins are labeled. The pathway diagrams illustrate the differential expression of proteins involved in (b) central metabolism and respiration, (c) oxidative damage response, and (d) protein turnover and proteostasis. Colors represent fold change in paraquat vs. normal hearts, proteins labeled in bold correspond to proteins within the 10% false discovery rate filter in the panels above. The proteomic profiles in stressed hearts are indicative of decreased respiration and protein synthesis coupled with increases in antioxidant proteins and protein degradation amid acute paraquat challenge.
Figure 4
Figure 4
Protein fraction redistribution upon oxidative stress. (a) The majority of proteins showed consistent fraction localization in normal (x) vs. stressed hearts (y) when comparing the S2 or S3 fraction to the more soluble S1 fraction (Spearman’s correlation ρ: 0.907 and 0.943, respectively), but a subset of proteins showed evidence of preferential distribution to more soluble or less soluble fractions upon stress. Each data point is a protein; color: significant differences in protein abundance across fractions in normal (light brown) or both normal and stressed hearts (dark brown). (b) Correlations in relative protein distribution between the S2 and S3 fractions in normal vs. stressed heart (Spearman’s correlation ρ: 0.521). (c) Bar charts of fraction S2/S3 abundance ratios showing a number of sarcomeric proteins with preferential redistribution from the S3 to the S2 fraction in paraquat (PQ) stressed hearts over normal hearts. Numbers: t-test P values. (d) Volcano plots showing significantly redistributed proteins in stressed hearts (x: log2 FC; y: − log10 P). Red data points are significantly different at 10% FDR in limma; up to 10 of the top significant data points are labeled. (e) Flow diagram showing redistribution of proteins in stressed hearts among the three subcellular fractions at 10% FDR. Nodes: proteins distributed among the axes representing 3 subcellular fractions; purple edges: redistribution to a less soluble fraction; blue edges: redistribution to a more soluble fraction.
Figure 5
Figure 5
Partial reversal of proteome remodeling by antioxidants. (a) Heat map showing the fold changes of 173 cardiac proteins with apparent changes in abundance following paraquat (PQ) treatment (P<0.01; |logFC| 0.3) and their fold changes when comparing co-treatment with either antioxidant Tempol or MitoTEMPO with paraquat to paraquat only. The majority of proteins showed partial reversal to the baseline. (b) First two components and overlaid protein loadings in linear discriminant analysis between normal, paraquat, and paraquat co-treated with either antioxidants. (c) Box plots showing relative abundance of selected proteins, in normal, paraquat, paraquat + Tempol, and paraquat + MitoTEMPO hearts. t-test P<0.05. (d) Comparison of member gene distribution of selected gene sets among proteins ranked by differential abundance in MitoTEMPO + Paraquat vs. Paraquat (yellow) or Tempol + Paraquat vs. Paraquat. Tempol appeared more effective in reverting Paraquat-mediated mitochondrial and muscle proteins whereas MitoTEMPO had a more pronounced effect on ribosomal proteins. x axis: protein rank from highest to lowest log fold change. y axis: running enrichment score. Vertical line segments denote ranks of proteins belonging to the gene sets. Numbers: adjusted P value, parametric gene set enrichment analysis.

References

    1. López-Otín C, et al. The hallmarks of aging. Cell. 2013;153(6):1194–1217. doi: 10.1016/j.cell.2013.05.039. - DOI - PMC - PubMed
    1. Paneni F, et al. The aging cardiovascular system: Understanding it at the cellular and clinical levels. J. Am. Coll. Cardiol. 2017;69(15):1952–1967. doi: 10.1016/j.jacc.2017.01.064. - DOI - PubMed
    1. Kornfeld OS, et al. Mitochondrial reactive oxygen species at the heart of the matter: New therapeutic approaches for cardiovascular diseases. Circ. Res. 2015;116(11):1783–1799. doi: 10.1161/CIRCRESAHA.116.305432. - DOI - PMC - PubMed
    1. van der Pol A, et al. Treating oxidative stress in heart failure: Past, present and future. Eur. J. Heart Fail. 2019;21(4):425–435. doi: 10.1002/ejhf.1320. - DOI - PMC - PubMed
    1. Chung HS, et al. Cysteine oxidative posttranslational modifications: Emerging regulation in the cardiovascular system. Circ. Res. 2013;112(2):382–392. doi: 10.1161/CIRCRESAHA.112.268680. - DOI - PMC - PubMed

Publication types