. 2020 Oct;586(7831):741-748.
doi: 10.1038/s41586-020-2859-7. Epub 2020 Oct 28.

High-depth African genomes inform human migration and health

Collaborators, Affiliations

High-depth African genomes inform human migration and health

Ananyo Choudhury et al. Nature. 2020 Oct.

Erratum in

  • Author Correction: High-depth African genomes inform human migration and health.
    Choudhury A, Aron S, Botigué LR, Sengupta D, Botha G, Bensellak T, Wells G, Kumuthini J, Shriner D, Fakim YJ, Ghoorah AW, Dareng E, Odia T, Falola O, Adebiyi E, Hazelhurst S, Mazandu G, Nyangiri OA, Mbiyavanga M, Benkahla A, Kassim SK, Mulder N, Adebamowo SN, Chimusa ER, Muzny D, Metcalf G, Gibbs RA; TrypanoGEN Research Group; Rotimi C, Ramsay M; H3Africa Consortium; Adeyemo AA, Lombard Z, Hanchard NA. Choudhury A, et al. Nature. 2021 Apr;592(7856):E26. doi: 10.1038/s41586-021-03286-9. Nature. 2021. PMID: 33846614 Free PMC article. No abstract available.

Abstract

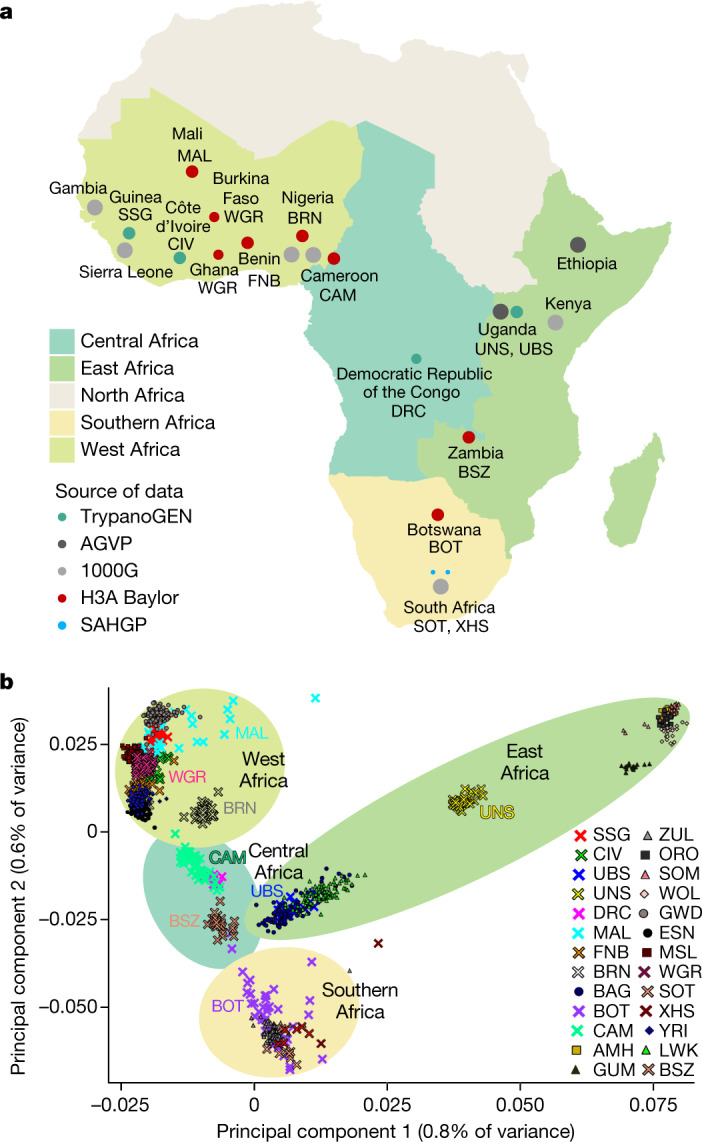
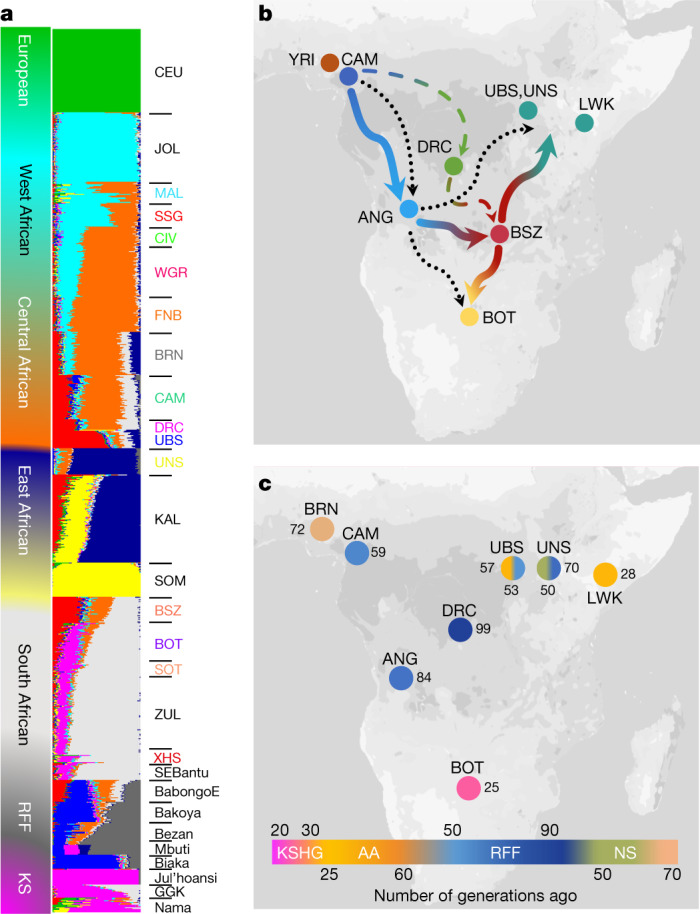
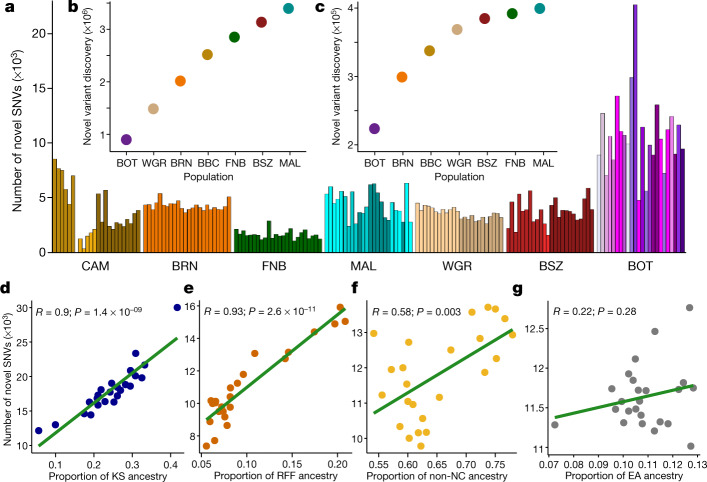
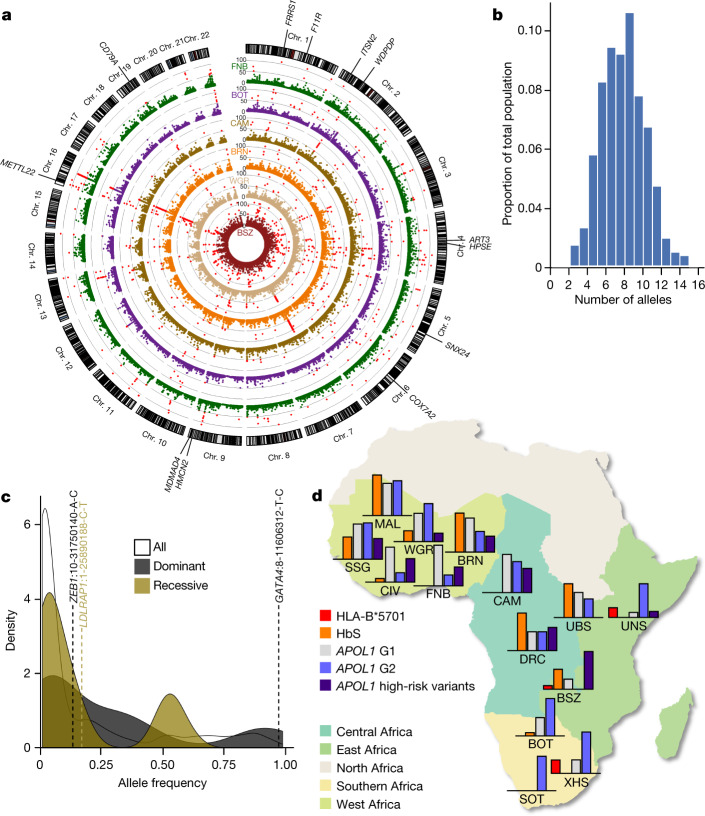
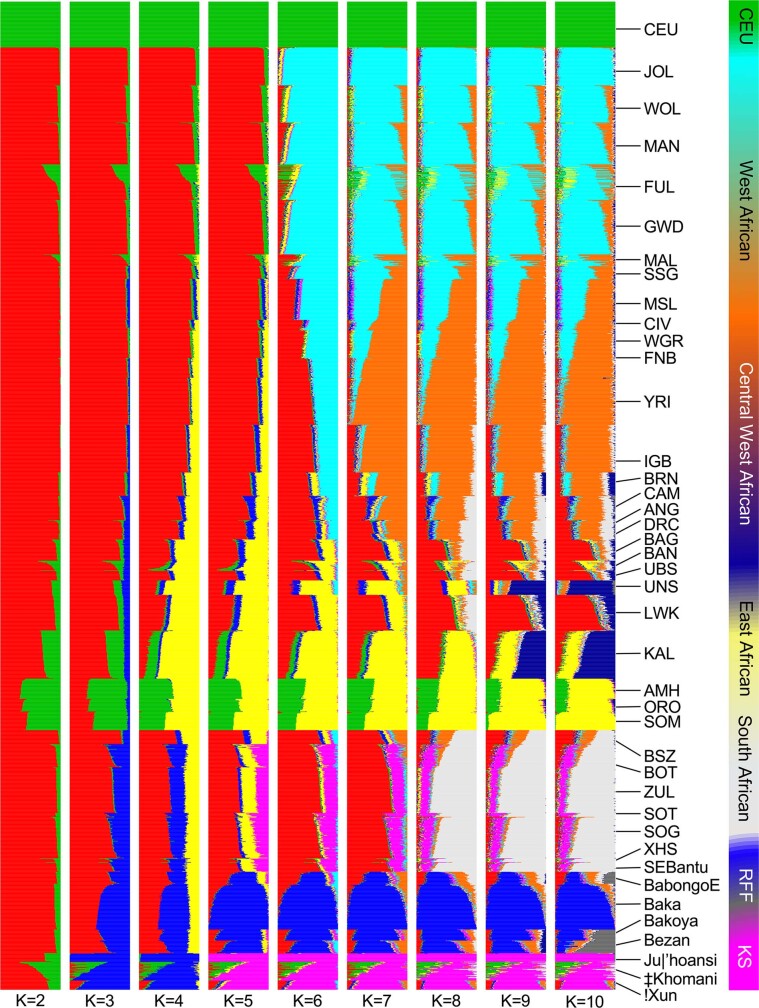
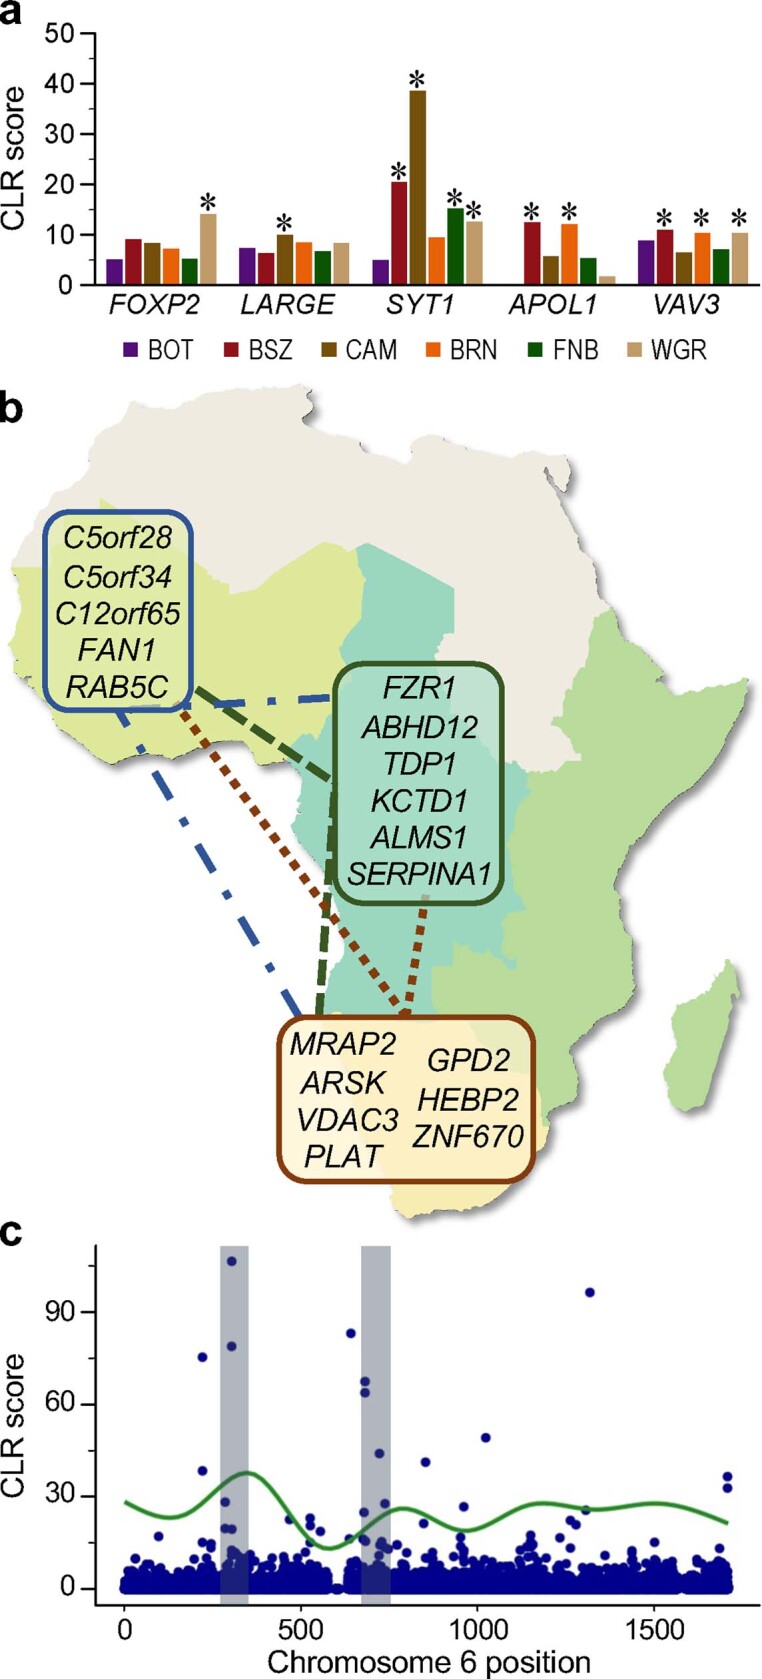
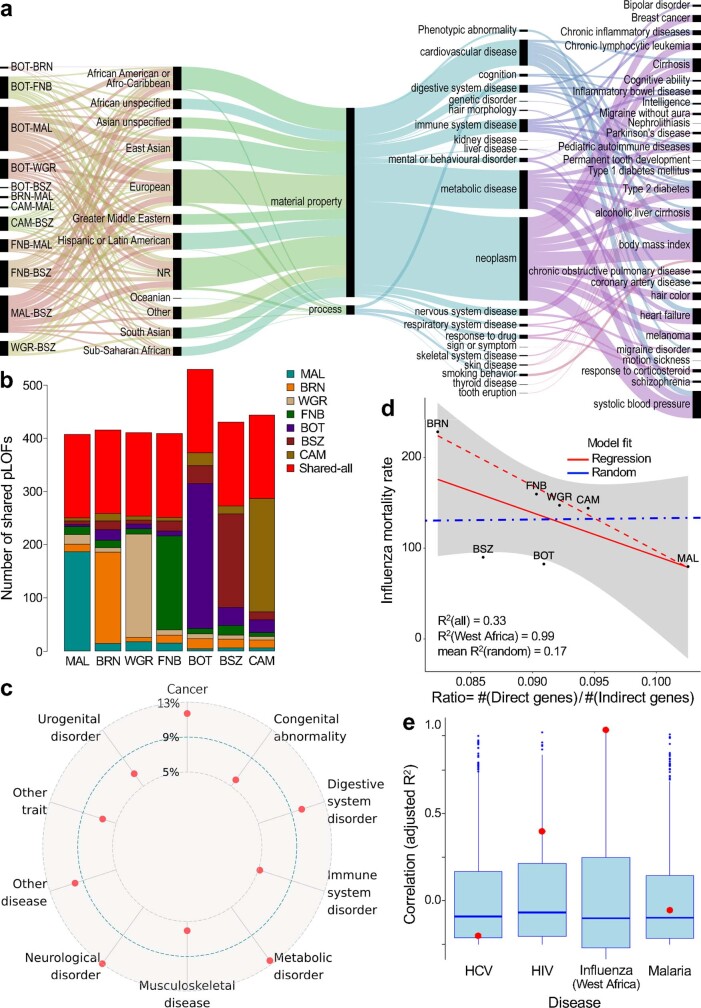
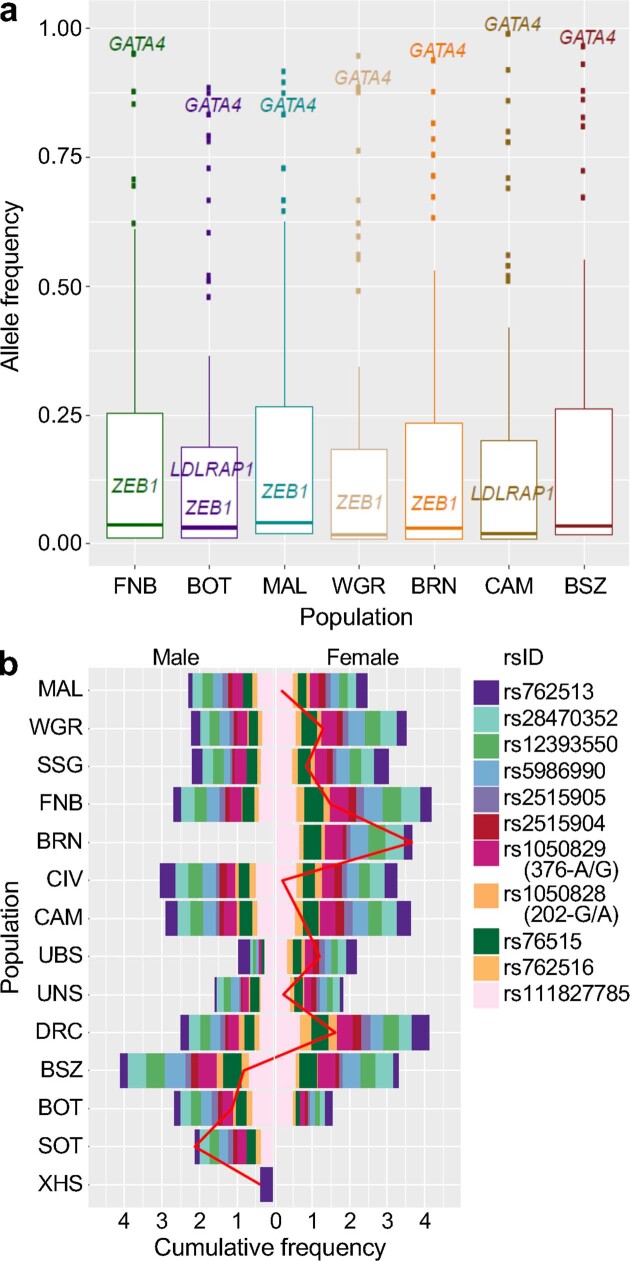
The African continent is regarded as the cradle of modern humans and African genomes contain more genetic variation than those from any other continent, yet only a fraction of the genetic diversity among African individuals has been surveyed1. Here we performed whole-genome sequencing analyses of 426 individuals-comprising 50 ethnolinguistic groups, including previously unsampled populations-to explore the breadth of genomic diversity across Africa. We uncovered more than 3 million previously undescribed variants, most of which were found among individuals from newly sampled ethnolinguistic groups, as well as 62 previously unreported loci that are under strong selection, which were predominantly found in genes that are involved in viral immunity, DNA repair and metabolism. We observed complex patterns of ancestral admixture and putative-damaging and novel variation, both within and between populations, alongside evidence that Zambia was a likely intermediate site along the routes of expansion of Bantu-speaking populations. Pathogenic variants in genes that are currently characterized as medically relevant were uncommon-but in other genes, variants denoted as 'likely pathogenic' in the ClinVar database were commonly observed. Collectively, these findings refine our current understanding of continental migration, identify gene flow and the response to human disease as strong drivers of genome-level population variation, and underscore the scientific imperative for a broader characterization of the genomic diversity of African individuals to understand human ancestry and improve health.


Conflict of interest statement

The authors declare no competing interests.

Figures

Fig. 1
Fig. 1. H3Africa WGS data.
a, Geographical regions and populations of origin for H3Africa WGS data. The size of the circles indicates the relative number of sequenced samples from each population group (before quality control; Supplementary Methods Table 1). Samples with WGS data from the 1000 Genomes Project and the African Genome Variation Project are included for comparison (grey circles). CAM includes 25 individuals who are homozygous for the sickle mutation (HbSS); MAL includes unaffected individuals with a family history of neurological disease; BOT comprises children who are HIV-positive; BRN included only female participants. 1000G, 1000 Genome Project; AGVP, African Genome Variation Project. Maps were created using R. b, Principal component analysis of African WGS data showing the first two principal components. New populations used in this study are indicated by crosses. Population abbreviations are as described in the 1000 Genomes and H3Africa Projects as provided in Supplementary Methods Table 1 and Supplementary Table 22. Shaded background elipses relate to the geographical regions as shown in a.
Fig. 2
Fig. 2. Population admixture and genetic ancestry among African populations.
a, Admixture plot showing select African populations based on WGS and array data for K = 10. b, Proposed movement during the Bantu migration, showing the populations that were used for inference. Blue line shows the migration patterns inferred by genetic distance estimates with Zambia (BSZ) as an intermediate staging ground for Bantu migrations further east (red–teal arrow) and south (red–yellow arrow). The dotted black line shows the previously proposed late-split route; the dotted blue–green line through the DRC indicates an alternative model of migration. GGK, Gǀwi, Gǁana and baKgalagadi. c, Key admixture dates (in generations) in populations of interest based on MALDER results. The colour of each circle represents the admixture date for NC components in each population group (KS, AA, RFF and NS). Dates are shown in terms of number of generations (1 generation = 29 years). Maps were created using R.
Fig. 3
Fig. 3. Novel variation in the H3Africa dataset.
a, Novel variants per individual in each population (n = 24 biological independent samples randomly chosen from each group to match the smallest used dataset). Shading within a population reflects self-identified ethnolinguistic affiliations (Supplementary Table 3). b, c, The number of additional total (b) and common (c) variants discovered in each population starting with those identified in BOT. dg, Correlation (Pearson, line of best fit is shown in green) between the number of novel SNVs and proportion of KS in BOT (d), RFF in CAM (e), non-NC in MAL (f) and east African (EA) ancestry in BRN (g).
Fig. 4
Fig. 4. Selection and medically relevant variants in African populations.
a, Circular Manhattan plot showing the CLR score distribution in 10-kb windows in the six HC-WGS populations (Supplementary Tables 5, 6). Loci with CLR scores > 49.5 (corresponding to a P < 0.001) are shown as red dots. Genes within regions with significant outlier scores in four or more groups (FRRS1, ITSN2, WDPCP, SNX24, METTL22 and HMCN2) or two or fewer groups (ART3, F11R, CD79A, COX7A2, HPSE and MAMDC4) are highlighted. b, Burden of pathogenic (class 5) ClinVar SNVs in H3Africa cohort. c, Density plot of frequencies of pathogenic and likely pathogenic ClinVar SNVs (n = 262) differentiated by the most commonly associated inheritance pattern of the monogenic disease gene in cases in which a gene has been implicated; three variants with allele frequency > 5% are shown, illustrated as gene name:chromosome-base pair position-reference allele-variant allele. d, Distribution of disease alleles common to Africa across H3Africa populations. The map was created using R. In each population, the corresponding bar graphs show the relative proportions of the specific disease-associated alleles (Supplementary Table 21). HbS in CAM and FNB are omitted as they include individuals with homozygous sickle cell disease (HbSS).
Extended Data Fig. 1
Extended Data Fig. 1. ADMIXTURE clustering analysis of H3A-WGS samples.
Existing African datasets from AGVP, 1000 Genomes project, SAHGP and previously published studies, and a representative European population (CEU) from the 1000 Genomes Project are included as reference panels. K values from 2 to 10 are shown. See Supplementary Table 22 for definitions of abbreviations.
Extended Data Fig. 2
Extended Data Fig. 2. Characteristics of known and regional selected loci.
a, CLR score distributions in known selected genes (significant population-specific outlier scores (that is, with P < 0.01) for the window overlapping the gene are indicated by an asterisk). b, Summary of PBS comparisons. Genes with longer branch lengths in WGR compared to BOT and CAM are circled in blue; longer branch lengths in BOT and CAM in comparison to the other two populations are encircled in brown and dark green, respectively. c, Overlap between the proportion of KS ancestry (%) and CLR score across chromosome 6 in BOT.
Extended Data Fig. 3
Extended Data Fig. 3. Highly divergent and putative LOF variants.
a, EFO traits from the GWAS catalogue reflected by highly divergent SNVs within 50 kb of GWAS hits. From left to right, ribbons illustrate the relative representation of variants across pairwise population comparisons, GWAS ancestry, EFO top label, EFO trait or disease label, and disease or traits mapped to the EFO label. b, Distribution and sharing of common (MAF > 5%) putative LOF variants between two or more populations (coloured bars) and between all populations surveyed (red bars). c, Specific disease classes to which 5% or more genes with putative LOF variants shared between all populations were mapped. d, Correlation (Pearson) between WHO mortality rates for influenza and ratio of putative LOF variants in direct (n = 181) compared with indirect (n = 1842) influenza-associated genes (red solid line, all populations; red dotted line, west African populations). The blue dotted line represents the mean correlation for the same correlations generated using 1,000 permutations of random genes; the s.e.m. for all populations is shown in grey. e, Correlation statistics (adjusted R2) for the putative LOF ratio for genes related to hepatitis C (HCV, n = 190 direct genes, n = 1837 indirect genes), HIV(n = 724 direct genes, n = 1351 indirect genes), influenza in west African countries (CAM, MAL, FNB and BRN), and malaria (n = 484 direct genes, n = 1554 indirect genes) are shown as red dots against the box plot distributions of correlation statistics (adjusted R2) generated using 1,000 permutations of random genes (Supplementary Table 18). Box plots show the median value (centre line), whiskers indicate the limits of the highest (fourth) and lowest (first) quartiles of the data; distribution outliers are shown as dots.
Extended Data Fig. 4
Extended Data Fig. 4. Distribution of G6PD variants and ClinVar pathogenic variants across H3Africa populations.
a, Frequency distribution of pathogenic and likely pathogenic variants (n = 287) in H3Africa HC-WGS populations. Disease genes with variants that had an allele frequency > 5% across multiple populations (shown in Fig. 4c) are highlighted. Box plots show the median value (centre line), whiskers indicate the limits of the highest (fourth) and lowest (first) quartiles of the data; distribution outliers are shown as dots. b, Relative frequencies of 11 G6PD deficiency-associated alleles within each population separated by sex. G6PD A− 202A and 376G refer to the A-deficiency associated with either rs1050828 (c.202G>A) or rs1050829 (c.376A>G) (MIM 305900).

Comment in

References

    1. Nielsen R, et al. Tracing the peopling of the world through genomics. Nature. 2017;541:302–310. - PMC - PubMed
    1. The 1000 Genomes Project Consortium A global reference for human genetic variation. Nature. 2015;526:68–74. - PMC - PubMed
    1. Tishkoff SA, et al. The genetic structure and history of Africans and African Americans. Science. 2009;324:1035–1044. - PMC - PubMed
    1. Gurdasani D, et al. The African Genome Variation Project shapes medical genetics in Africa. Nature. 2015;517:327–332. - PMC - PubMed
    1. Lek M, et al. Analysis of protein-coding genetic variation in 60,706 humans. Nature. 2016;536:285–291. - PMC - PubMed

Publication types