. 2021 Jan;589(7841):270-275.
doi: 10.1038/s41586-020-2901-9. Epub 2020 Oct 28.

Identification of SARS-CoV-2 inhibitors using lung and colonic organoids

Affiliations

Identification of SARS-CoV-2 inhibitors using lung and colonic organoids

Yuling Han et al. Nature. 2021 Jan.

Erratum in

  • Author Correction: Identification of SARS-CoV-2 inhibitors using lung and colonic organoids.
    Han Y, Duan X, Yang L, Nilsson-Payant BE, Wang P, Duan F, Tang X, Yaron TM, Zhang T, Uhl S, Bram Y, Richardson C, Zhu J, Zhao Z, Redmond D, Houghton S, Nguyen DT, Xu D, Wang X, Jessurun J, Borczuk A, Huang Y, Johnson JL, Liu Y, Xiang J, Wang H, Cantley LC, tenOever BR, Ho DD, Pan FC, Evans T, Chen HJ, Schwartz RE, Chen S. Han Y, et al. Nature. 2024 Jun;630(8016):E7. doi: 10.1038/s41586-024-07593-9. Nature. 2024. PMID: 38811742 No abstract available.

Abstract

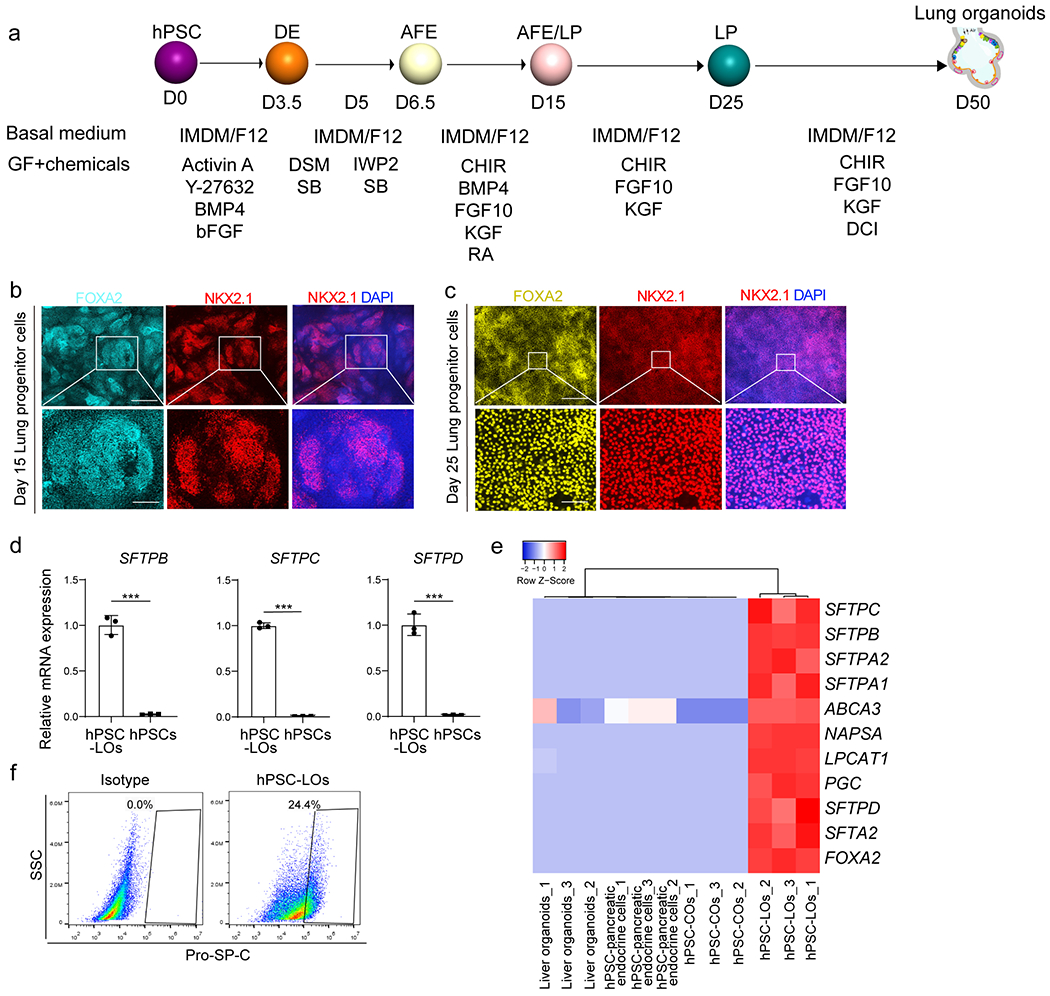
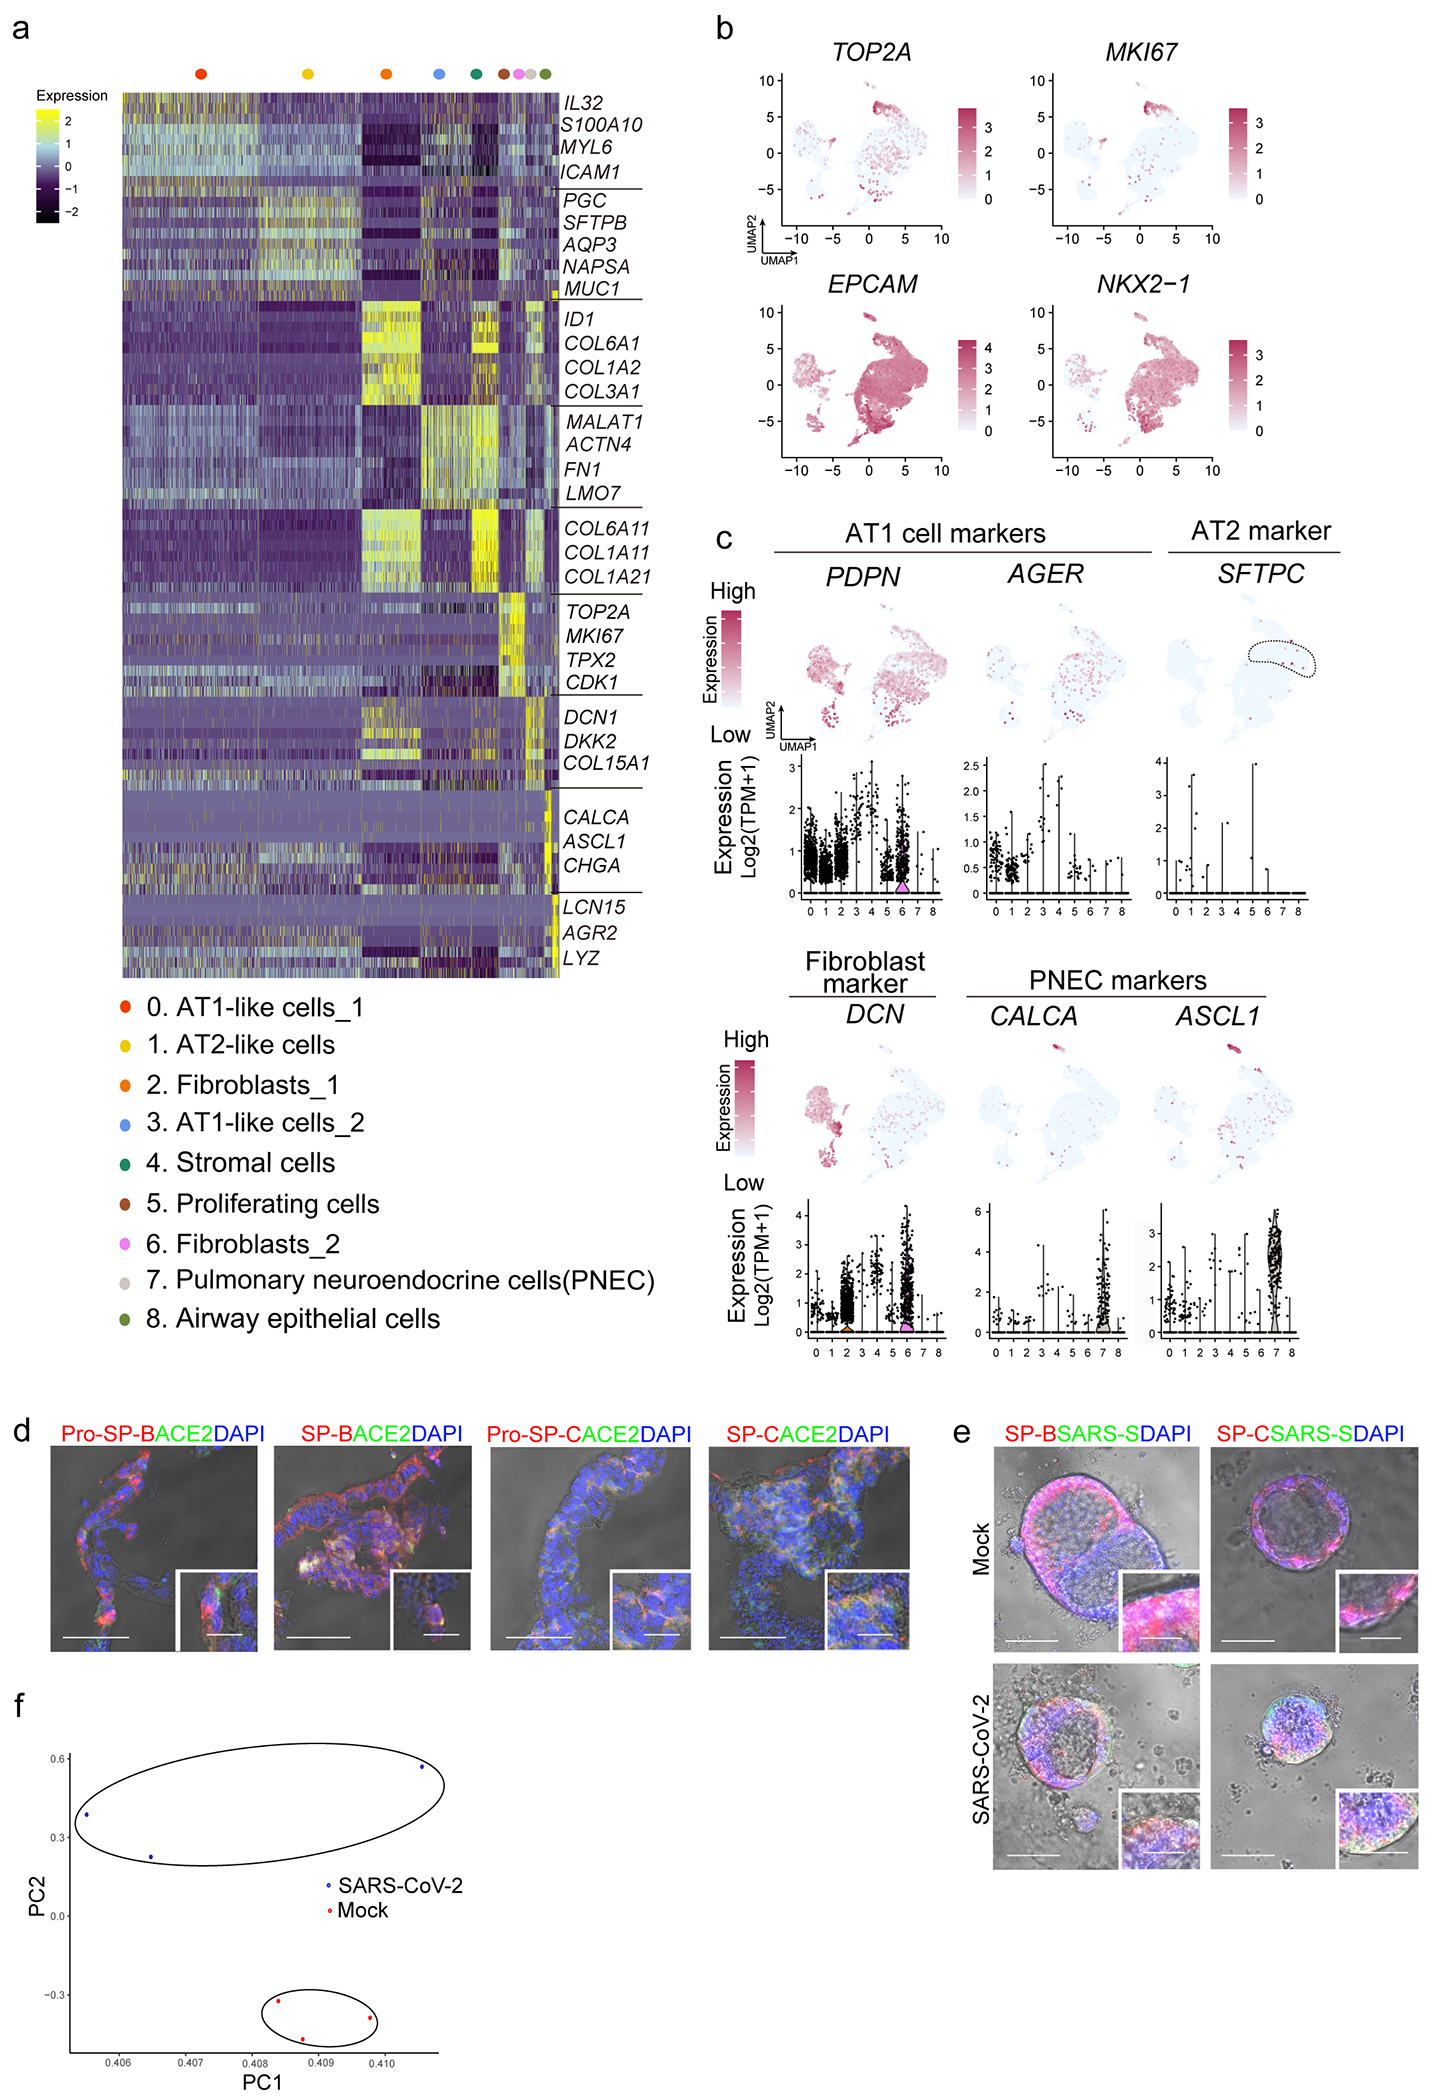
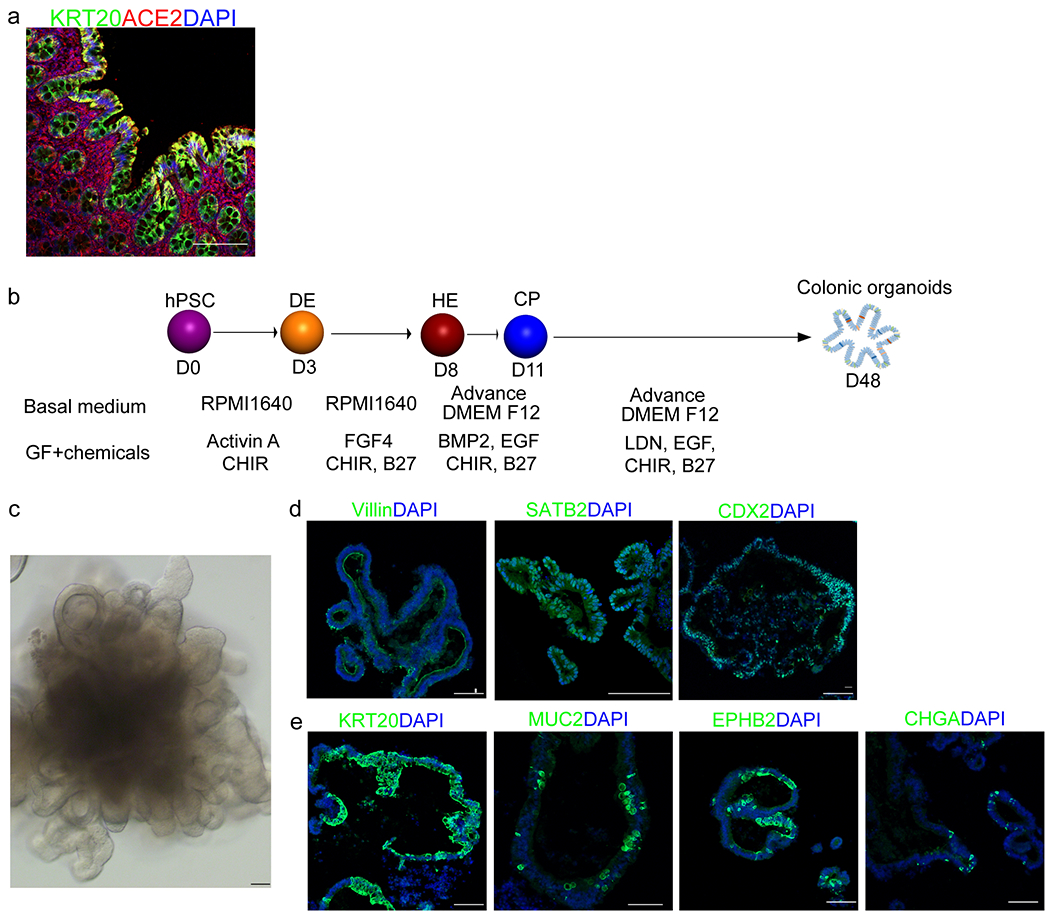
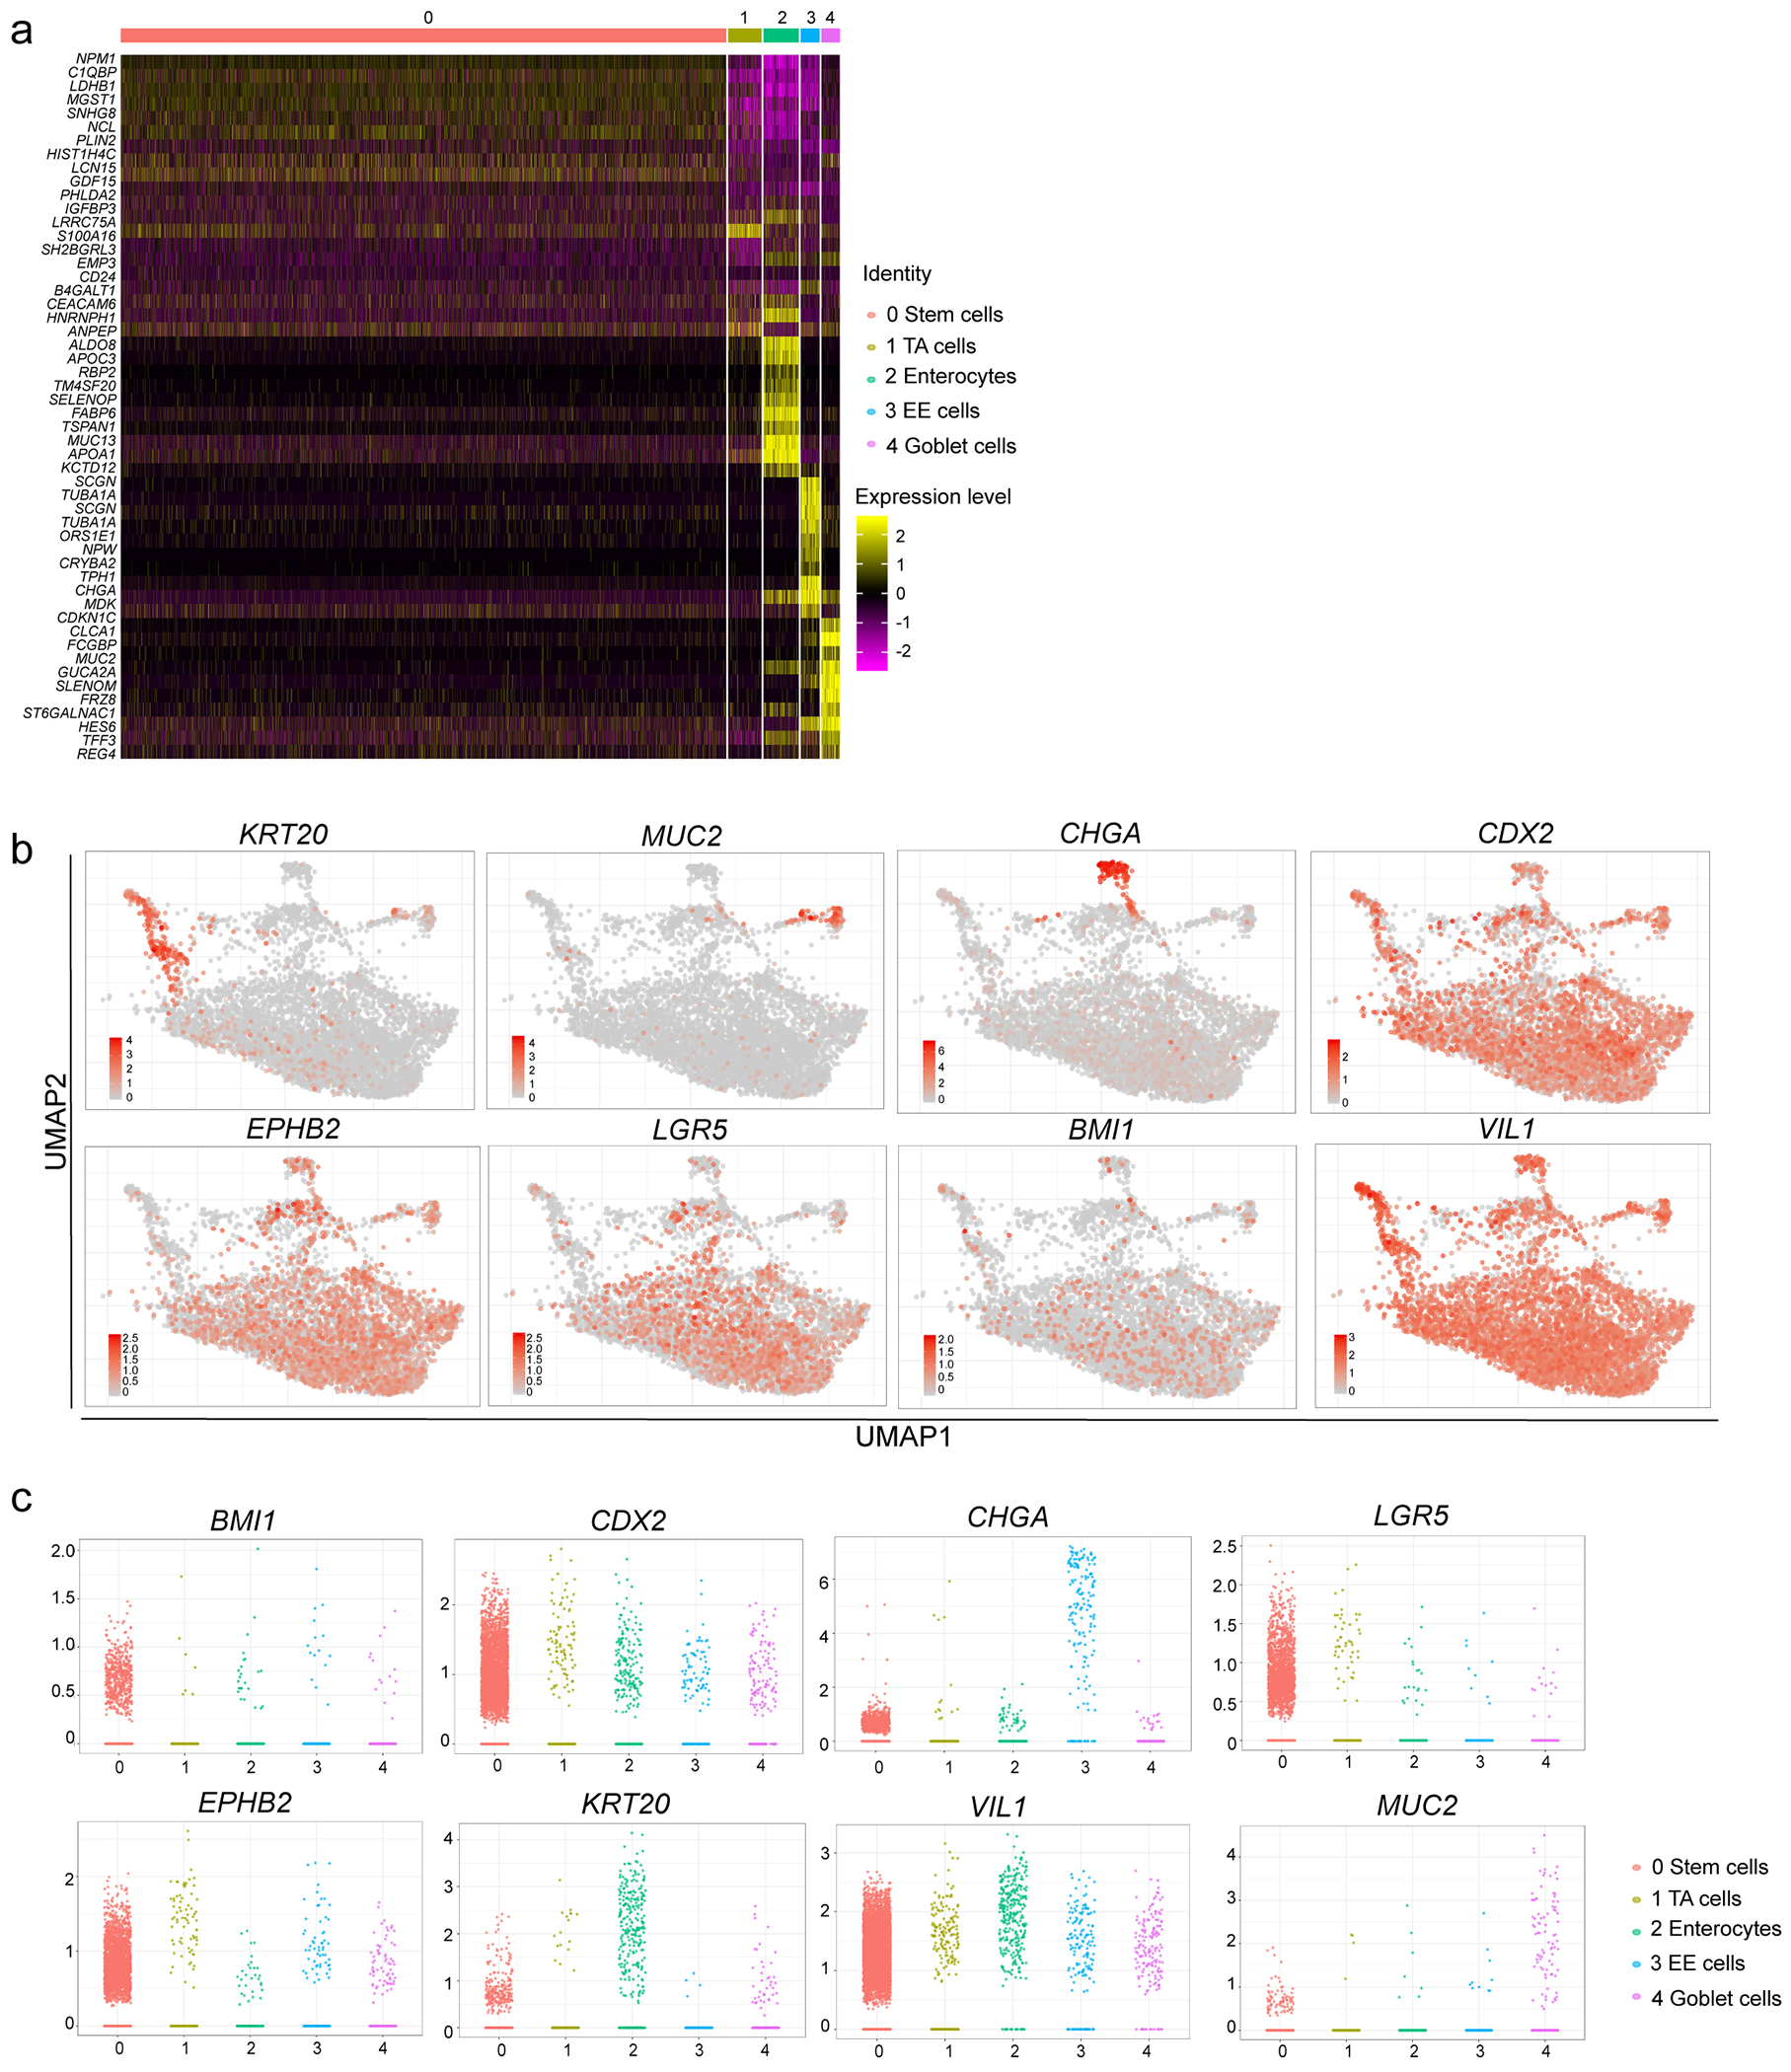
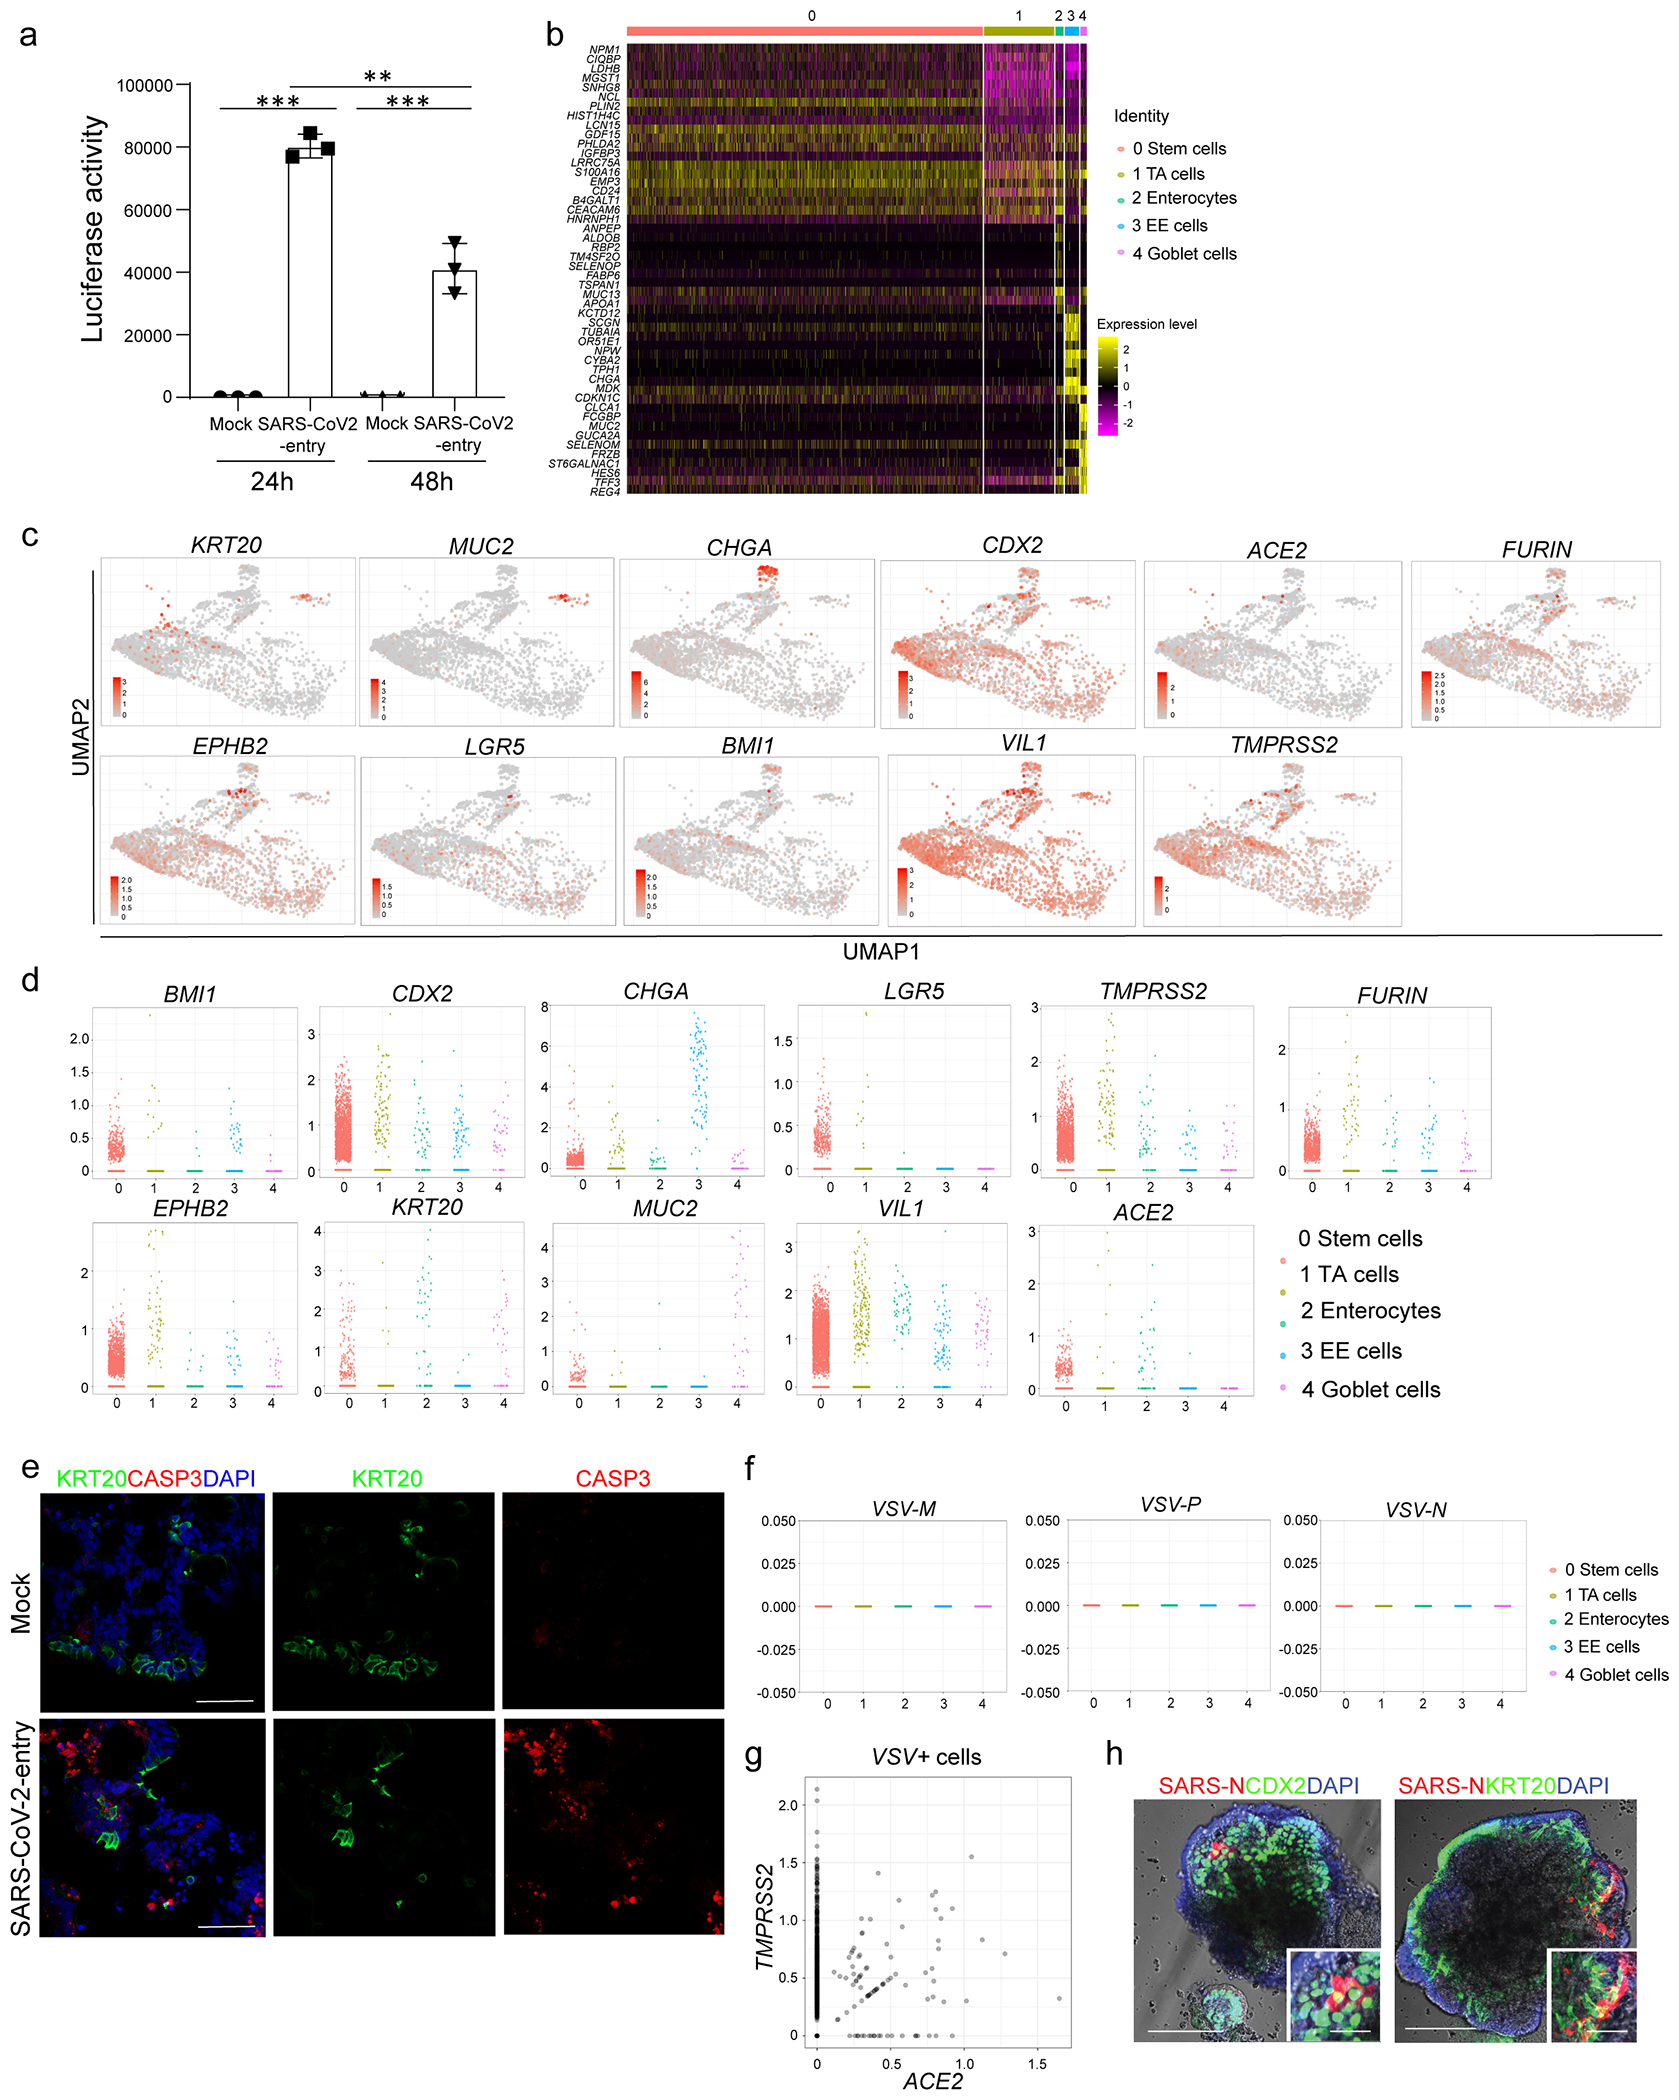
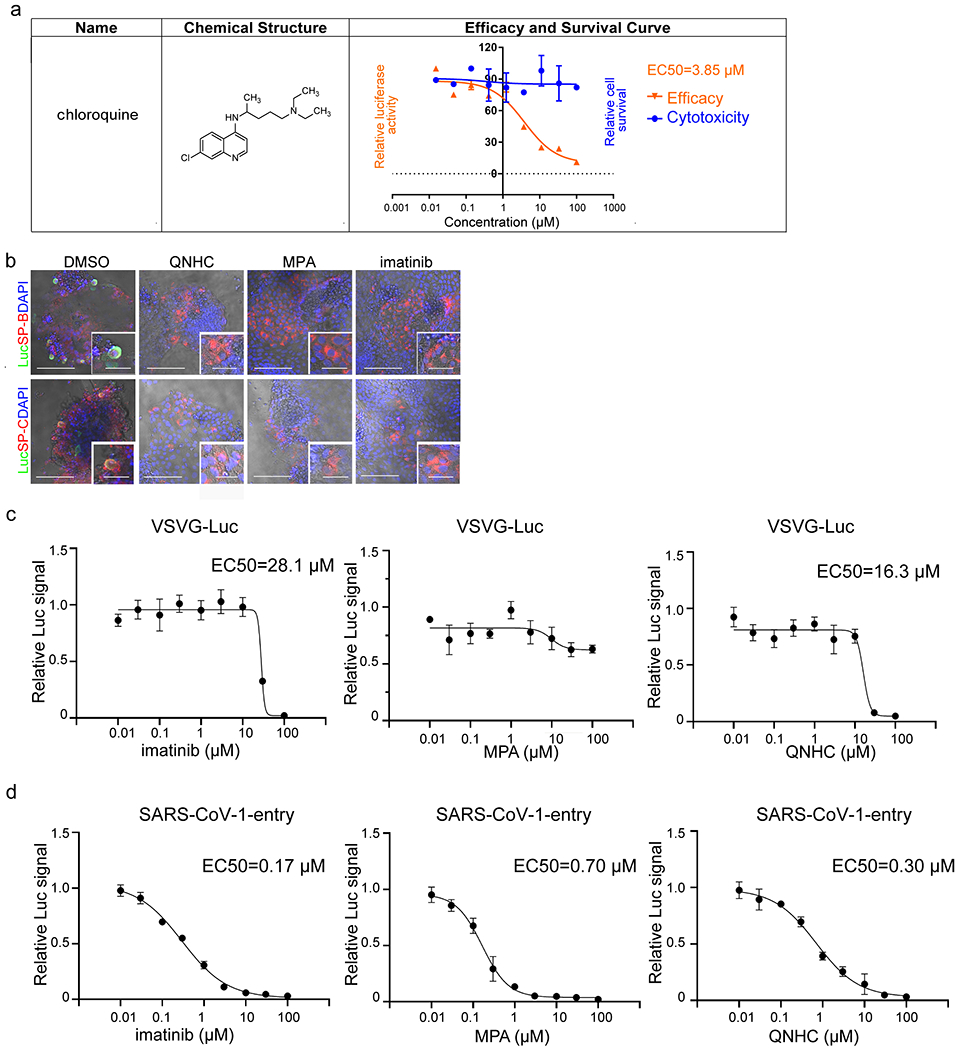
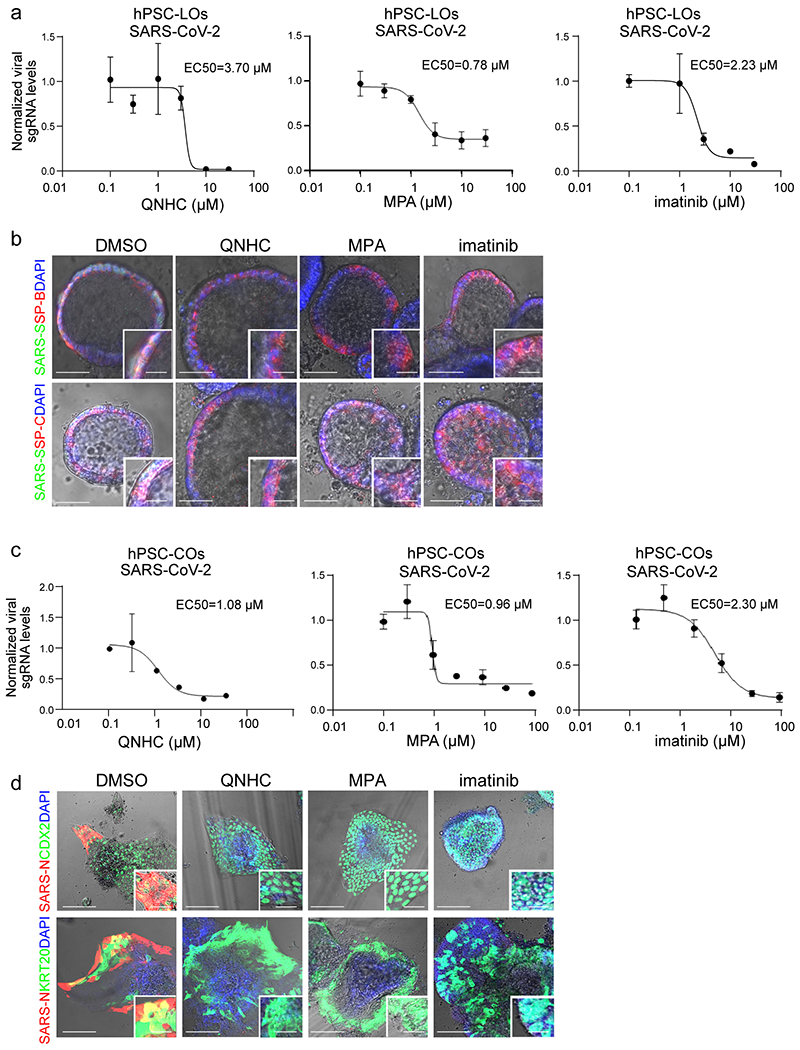
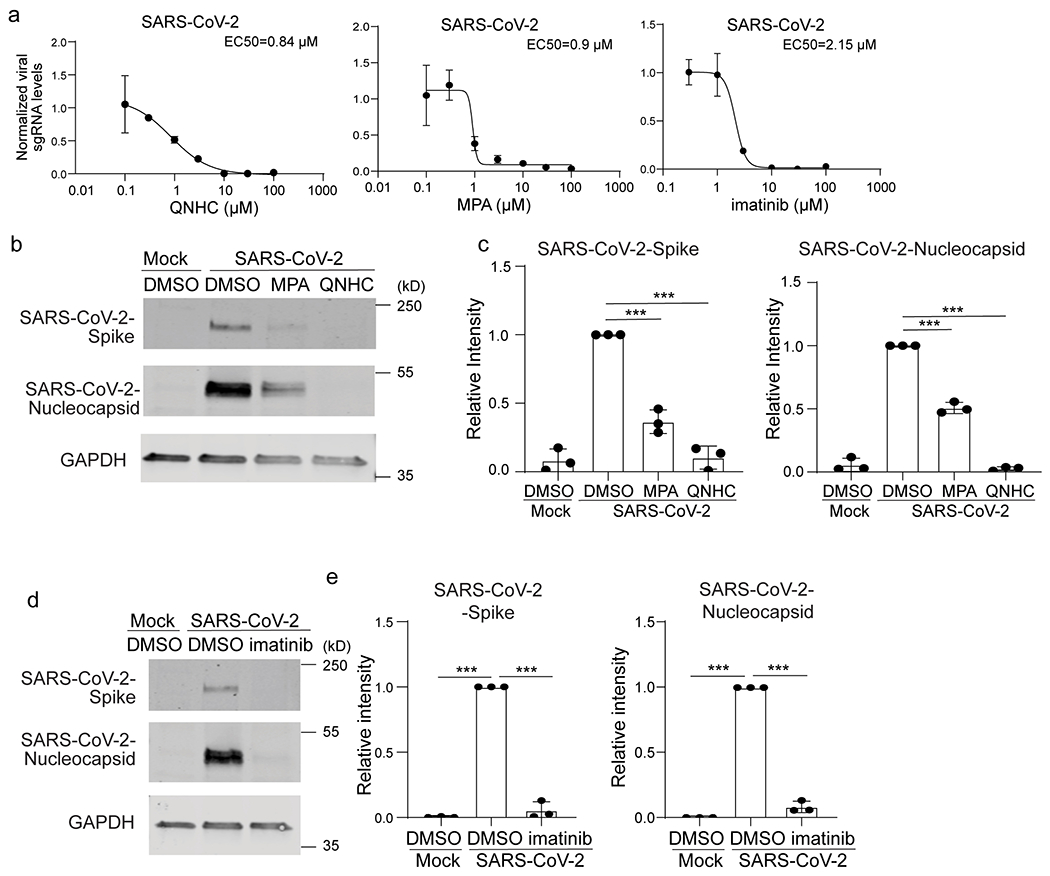
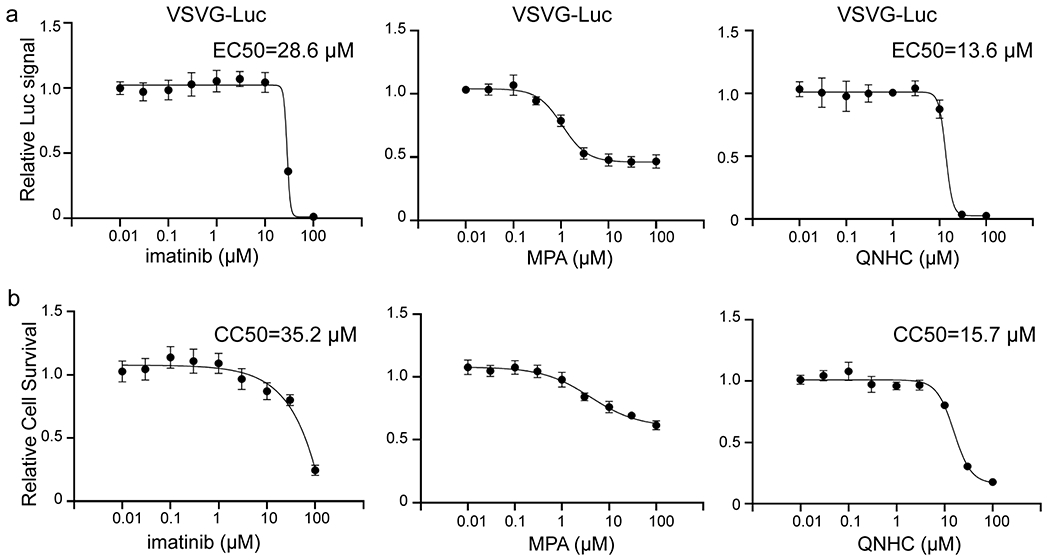
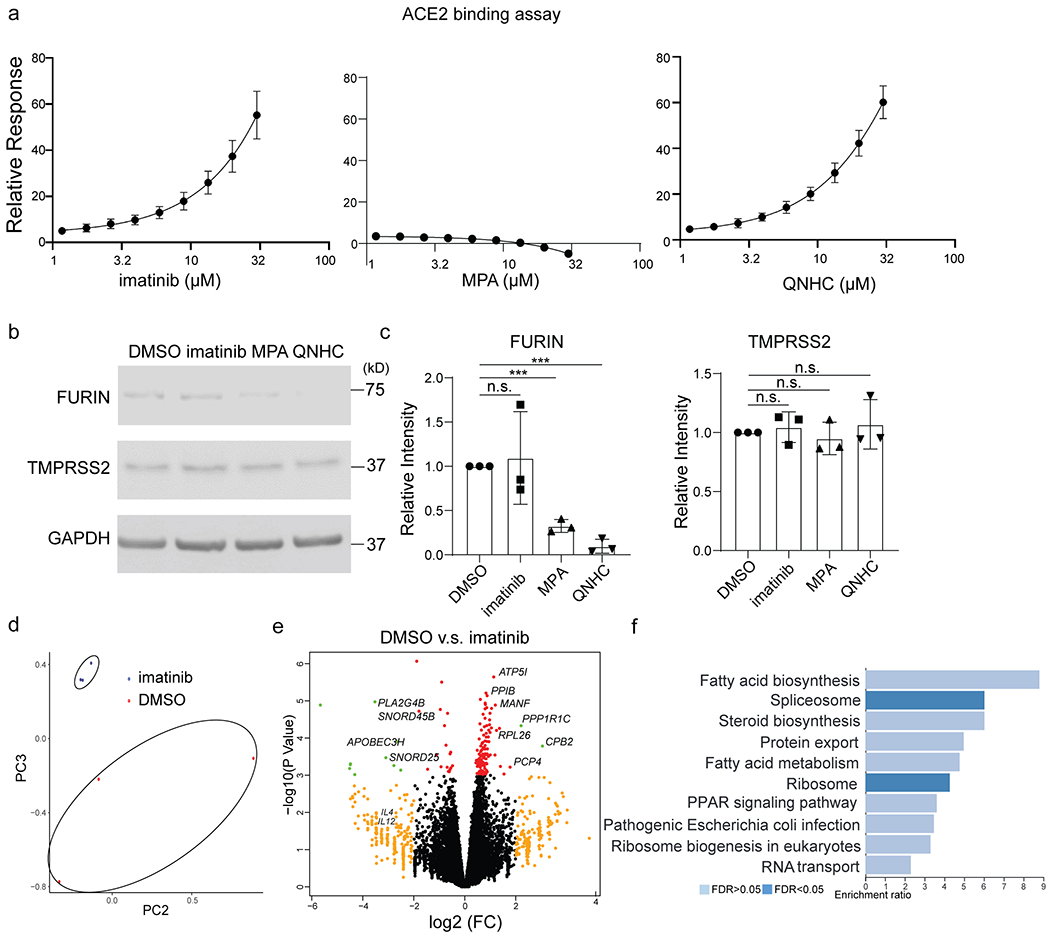
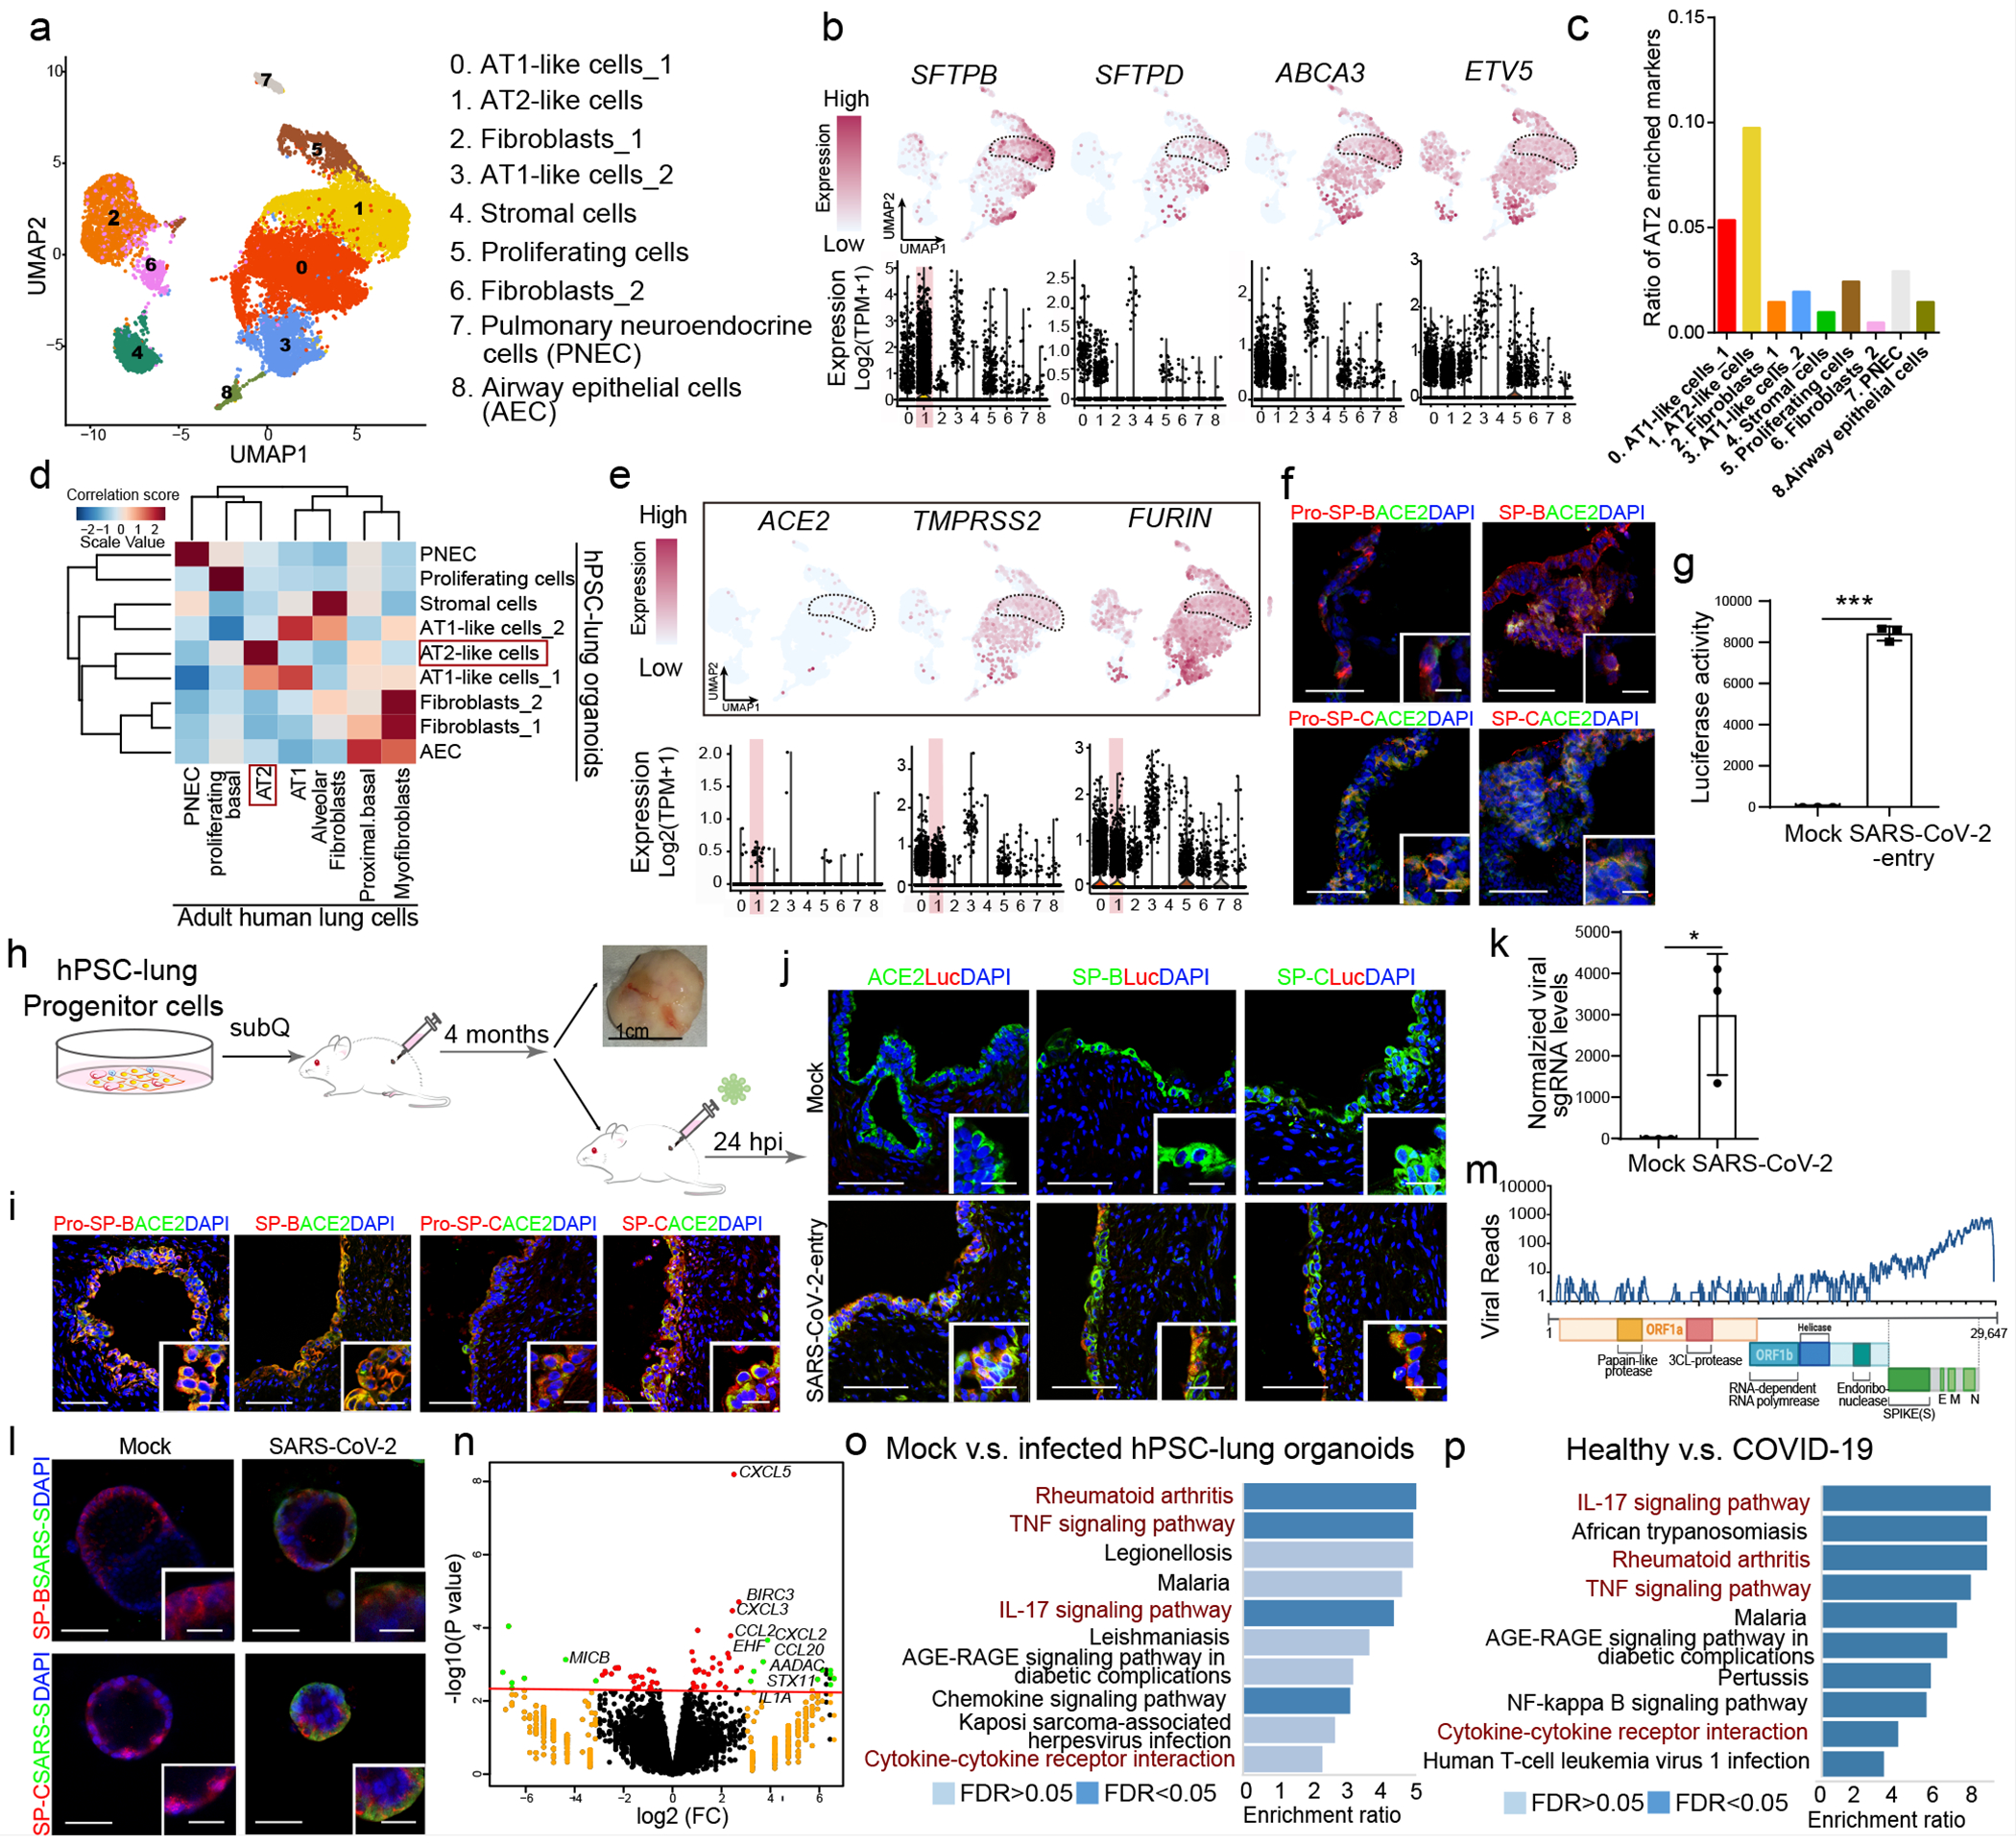
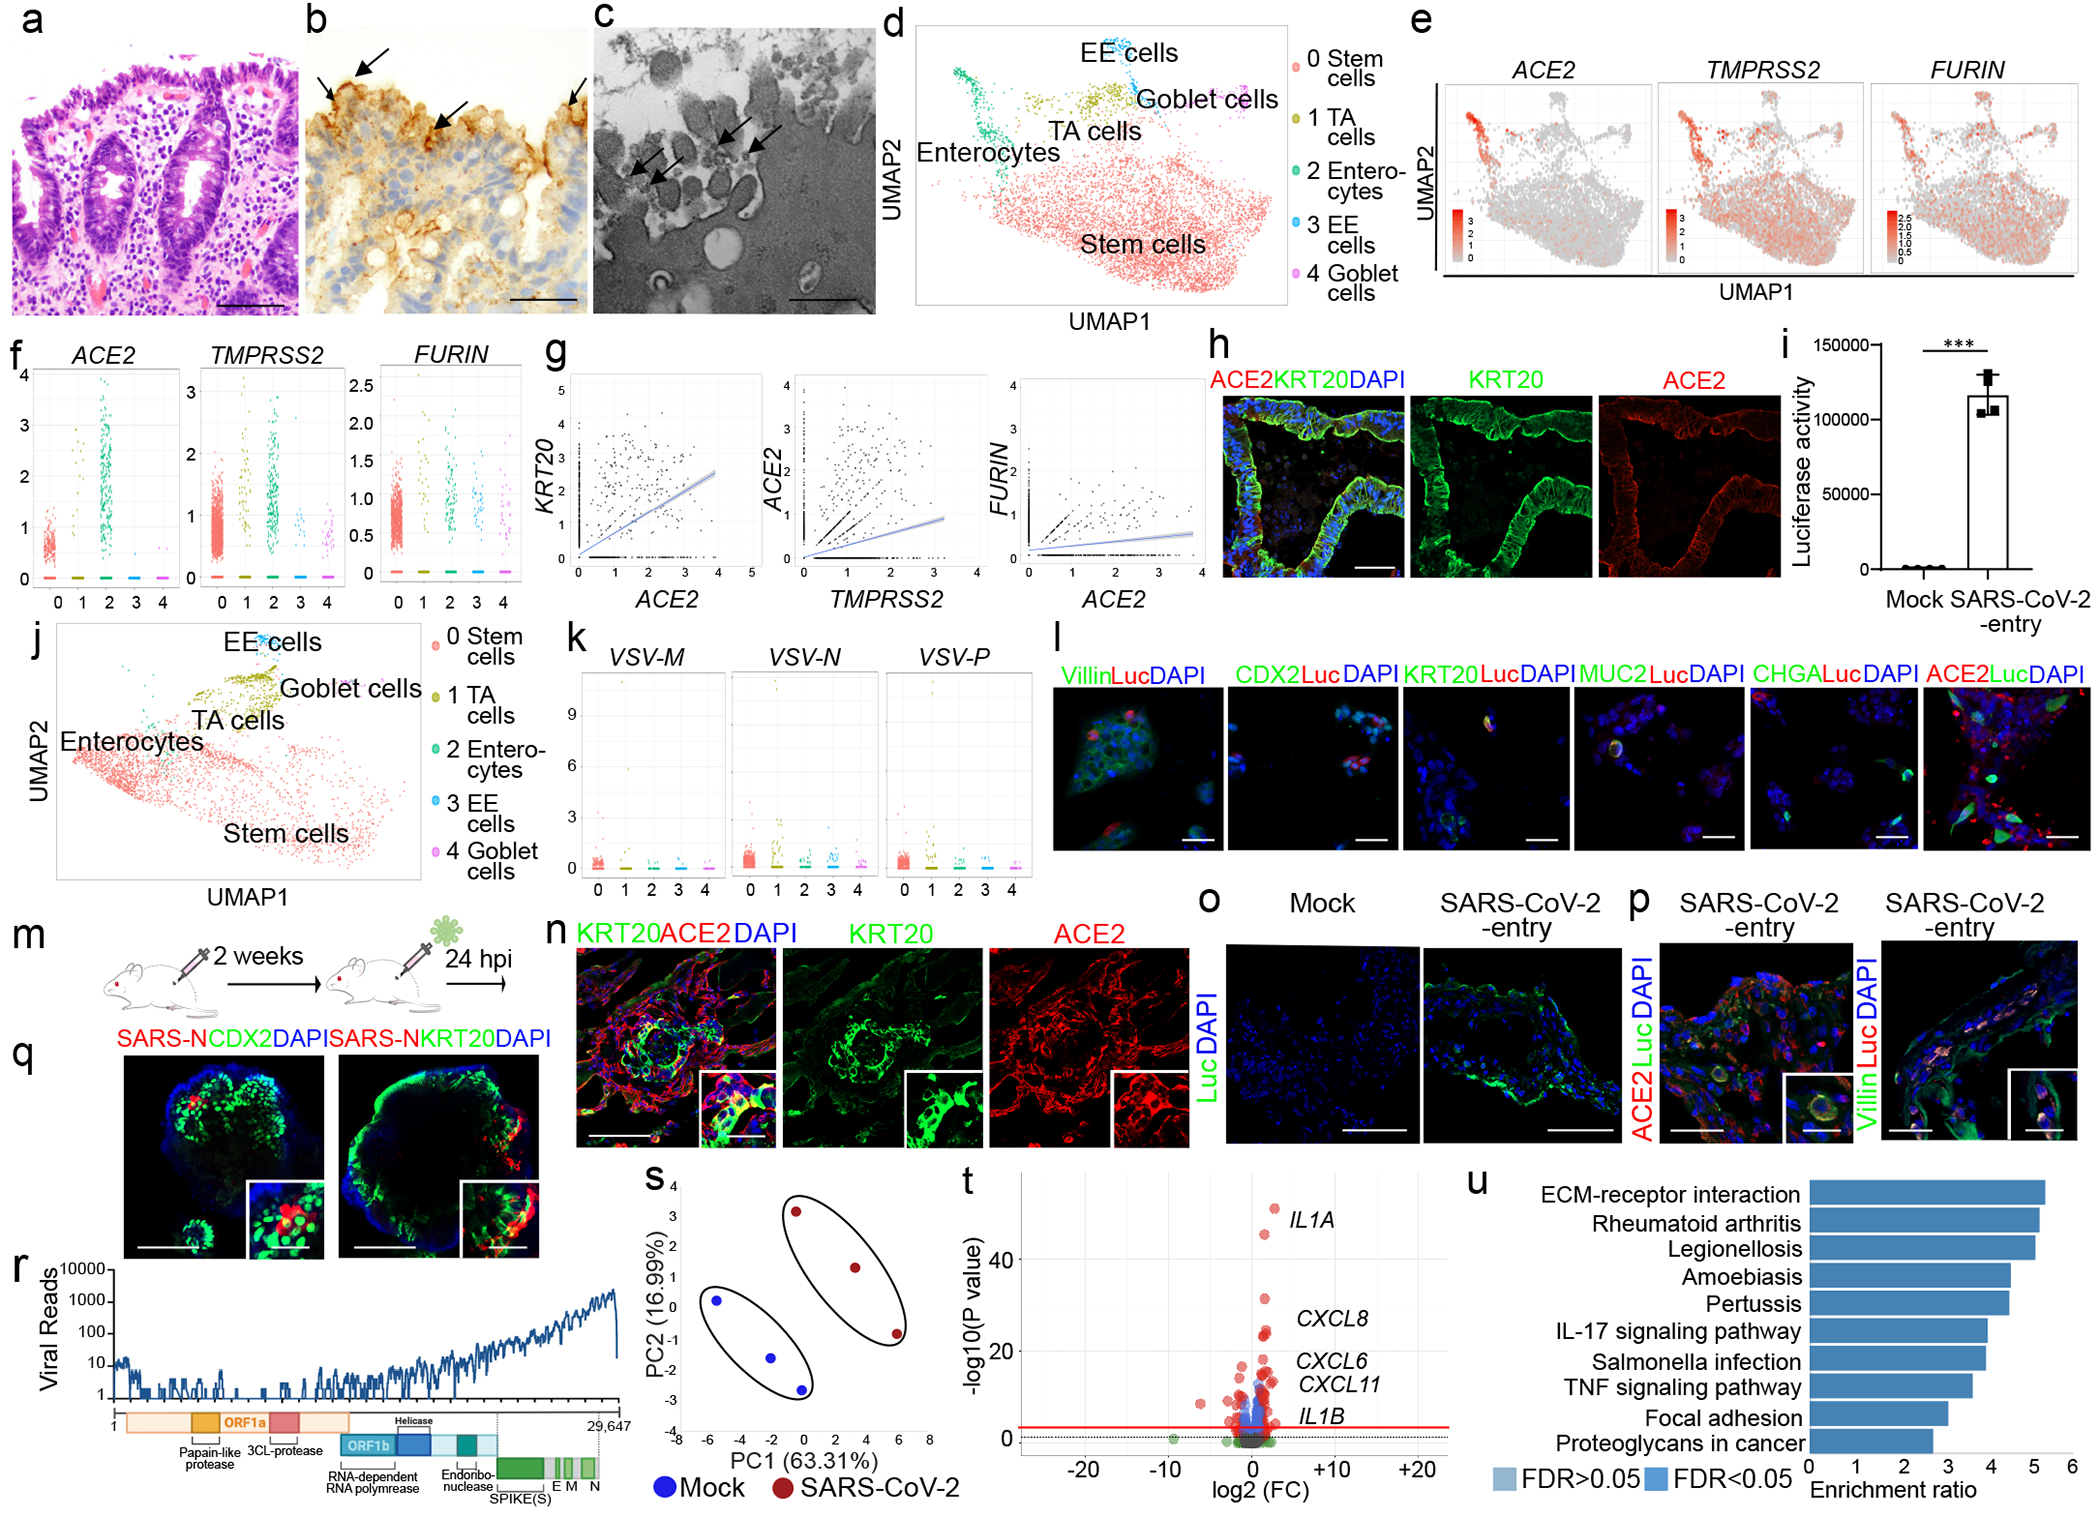
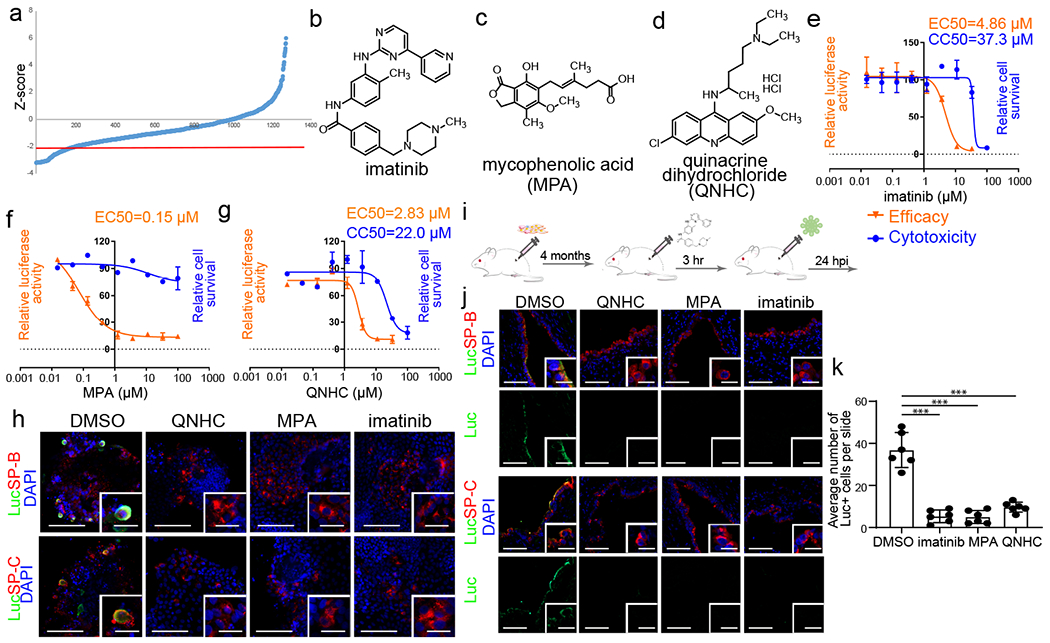
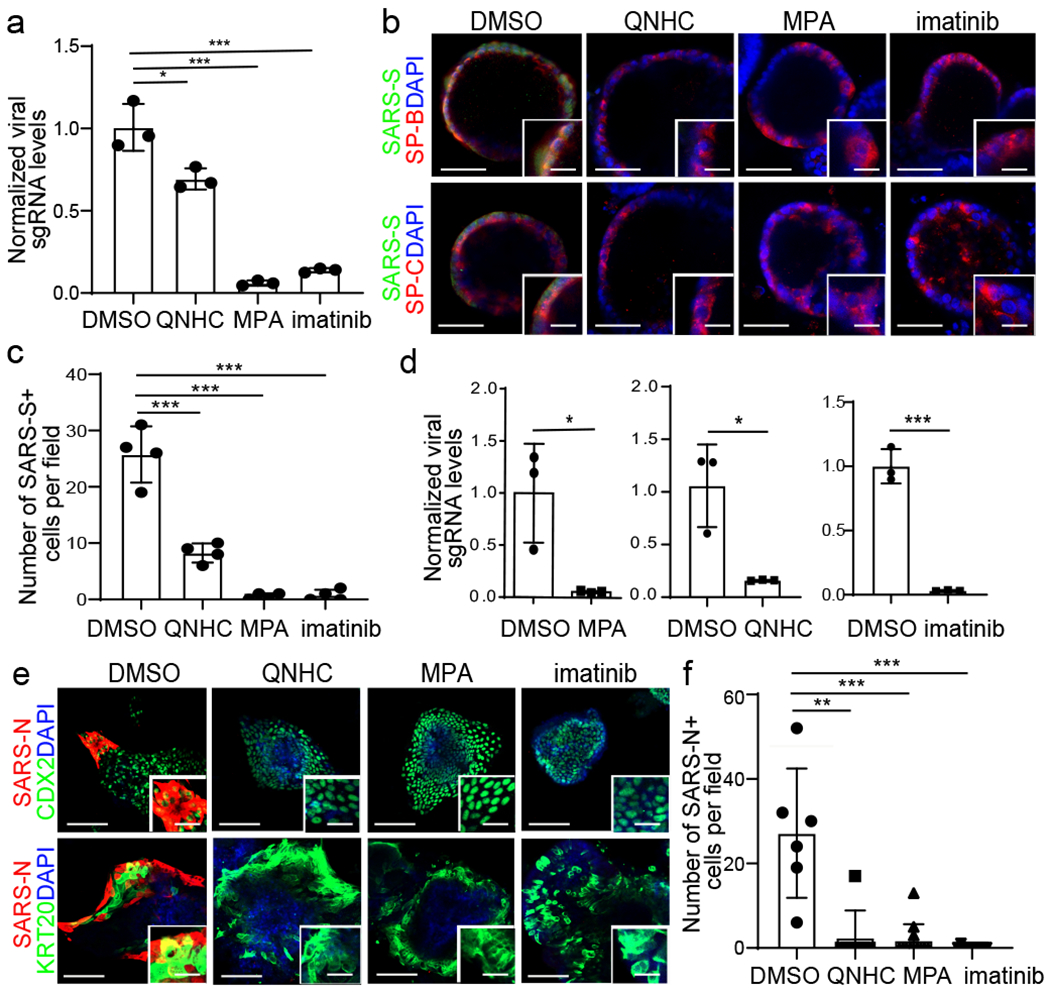
There is an urgent need to create novel models using human disease-relevant cells to study severe acute respiratory syndrome coronavirus 2 (SARS-CoV-2) biology and to facilitate drug screening. Here, as SARS-CoV-2 primarily infects the respiratory tract, we developed a lung organoid model using human pluripotent stem cells (hPSC-LOs). The hPSC-LOs (particularly alveolar type-II-like cells) are permissive to SARS-CoV-2 infection, and showed robust induction of chemokines following SARS-CoV-2 infection, similar to what is seen in patients with COVID-19. Nearly 25% of these patients also have gastrointestinal manifestations, which are associated with worse COVID-19 outcomes1. We therefore also generated complementary hPSC-derived colonic organoids (hPSC-COs) to explore the response of colonic cells to SARS-CoV-2 infection. We found that multiple colonic cell types, especially enterocytes, express ACE2 and are permissive to SARS-CoV-2 infection. Using hPSC-LOs, we performed a high-throughput screen of drugs approved by the FDA (US Food and Drug Administration) and identified entry inhibitors of SARS-CoV-2, including imatinib, mycophenolic acid and quinacrine dihydrochloride. Treatment at physiologically relevant levels of these drugs significantly inhibited SARS-CoV-2 infection of both hPSC-LOs and hPSC-COs. Together, these data demonstrate that hPSC-LOs and hPSC-COs infected by SARS-CoV-2 can serve as disease models to study SARS-CoV-2 infection and provide a valuable resource for drug screening to identify candidate COVID-19 therapeutics.


Conflict of interest statement

Competing Interests.

R.E.S. is on the scientific advisory board of Miromatrix Inc. L.C.C. is a founder and member of the board of directors of Agios Pharmaceuticals and is a founder and receives research support from Petra Pharmaceuticals. L.C.C. is an inventor on patents (pending) for Combination Therapy for PI3K-associated Disease or Disorder, and The Identification of Therapeutic Interventions to Improve Response to PI3K Inhibitors for Cancer Treatment. L.C.C. is a co-founder and shareholder in Faeth Therapeutics. T.M.Y. is a stockholder and on the board of directors of DESTROKE, Inc., an early-stage start-up developing mobile technology for automated clinical stroke detection. The other authors declare no competing interests.

Figures

Extended Data Figure 1.
Extended Data Figure 1.. Characterization of hPSC-LOs.
a, Scheme of protocol for differentiation of hPSCs to lung organoids. b, c, Immunostaining was performed in the hPSC-derived cell cultures at day 15 (b) and day 25 (c). Scale bars= 100 μm. Microscale bars= 20 μm. d, qRT-PCR of hPSCs and hPSC-LOs. n=3 biological independent experiments. ***P=8.44E-05, ***P=7.05E-07, ***P=0.000130. e, Heatmap from RNA-seq data of AT2 cell markers in hPSC-derived LOs, COs, pancreatic endocrine cells, and liver organoids. f, Intra-cellular flow cytometry analysis of Pro-SP-C expression in hPSC-LOs. ***P < 0.001. Data were analyzed by an unpaired two-tailed Student’s t-test and shown as mean ± STDEV. Data are representative of at least three independent experiments.
Extended Data Figure 2.
Extended Data Figure 2.. Single cell RNA-seq of hPSC-LOs.
a, Heatmap of enriched genes in each cluster of scRNA profiles in hPSC-LOs. Each row represents one top differentially expressed gene and each column represents a single cell. b, UMAP of genes highly expressed in proliferating cells. c, Putative AT2, fibroblast and PNEC markers in each cluster in UMAPs. Relative expression level of each marker gene ranges from low (light blue) to high (pink) as indicated. Individual cells positive for lung cell markers are donated by red dots. The violin plot shows the expression level (log2(TPM+1)) of indicated gene in each cluster. d, Bright field+immunostaining images of cryo-section of hPSC-LOs. Scale bars= 30 μm. Microscale bars=10 μm. e, Bright field+immunostaining images of SARS-CoV-2 infected hPSC-LOs. Scale bars= 75 μm. Microscale bars= 25 μm. f, PCA plot of RNA-seq data from mock-infected or SARS-CoV-2 infected hPSC-LOs.
Extended Data Figure 3.
Extended Data Figure 3.. Directed differentiation of hPSCs to COs.
a, Immunohistochemistry staining of human colon tissue. Scale bar= 30 μm. b, Schematic of protocol and conditions for hPSC differentiation to generate colonic organoids. c, Phase contrast image of a representative hPSC-COs. Scale bar= 100 μm. d, e, Confocal imaging of hPSC-COs stained with antibodies against (d) markers for colon cell fate, including Villin, SATB2, CDX2, or (e) KRT20, MUC2, EPHB2, and CHGA; Scale bar= 100 μm.
Extended Data Figure 4.
Extended Data Figure 4.. Single cell RNA-seq analysis of hPSC-COs.
a, Heatmap of top 10 differentially expressed genes in each cluster of single cell RNA-seq data. b, UMAP of the expression levels of colonic cell markers. c, Jitter plots for expression levels of colonic cell markers.
Extended Data Figure 5.
Extended Data Figure 5.. Single cell RNA-seq analysis of hPSC-COs at 24 hpi with SARS-CoV-2-entry virus.
a, Relative luciferase levels in lysates derived from hPSC-COs inoculated with SARS-CoV-2-entry virus at 24 or 48 hpi (MOI=0.01). n=3 biological independent experiments. ***P=4.52E-08. Data were analyzed by ordinary one-way ANOVA and shown as Sidak’s multiple comparisons. b, Heatmap of top 10 differentially expressed genes in each cluster of single cell RNA-seq data. c, UMAP of ACE2, TMPRSS2, FURIN and colonic markers. d, Jitter plots for transcript levels of ACE2, TMPRSS2, FURIN and colonic markers. e, Representative immunostaining of infected hPSC-COs co-stained for KRT20 and CASP3. Scale bar= 50 μm. f, Jitter plots of transcript levels for VSV-M, VSV-N and VSV-P from hPSC-COs without SARS-COV-2 infection (mock). g, 2D correlation of expression levels for ACE2 and TMPRSS2 in VSV+ cells. h, Bright field+immunostaining images of SARS-CoV-2 infected hPSC-COs. Scale bars= 100 μm. Microcale bars= 40 μm. **P < 0.01, ***P< 0.001. Data are representative of at least three independent experiments.
Extended Data Figure 6.
Extended Data Figure 6.. Efficacy curve of imatinib, MPA and QNHC comparing VSVG and SARS-CoV-1-entry virus on hPSC-LOs.
a, Chemical structure, efficacy curve and toxicity curve of two primary hit drug candidates, choloroquine and prochlorperazine. n=3 biological independent experiments. b, Bright field+immunostaining images of SARS-CoV-2-entry virus infected hPSC-LOs. Scale bars= 50 μm. Microscale bars= 10 μm. c, Efficacy curve of imatinib, MPA and QNHC on VSVG virus. n=3 biological independent experiments. d, Efficacy curve of imatinib, MPA and QNHC on SARS-CoV-1-entry virus. n=3 biological independent experiments. Data are representative of at least three independent experiments.
Extended Data Figure 7.
Extended Data Figure 7.. Efficacy curve of imatinib, MPA and QNHC on hPSC-LOs and hPSC-COs.
a, qRT-PCR based dose curve of imatinib, MPA, and QNHC on hPSC-LOs at 24 hours post-SARS-CoV-2 infection (SARS-CoV-2, MOI=0.1). n=3 biological independent experiments. b, Bright field+immunostaining images of SARS-CoV-2 Spike protein (SARS-S) and SP-B/SP-C in imatinib, MPA, or QNHC treated hPSC-LOs at 24 hpi (MOI=0.5). Scale bar = 50 μm. Microscale bars= 15 μm. c, qRT-PCR based dose curve of imatinib, MPA, and QNHC on hPSC-COs at 24 hpi of SARS-CoV-2 (SARS-CoV-2, MOI=0.1). n=3 biological independent experiments. d, Bright field+immunostaining images of SARS-S and SP-B/SP-C at 24 hpi of hPSC-COs infected with SARS-CoV-2 virus (MOI=0.5) and three hours later followed by 10 μM imatinib, 3 μM MPA or 4.5 μM QNHC treatment. Scale bar = 50 μm. Microscale bars= 15 μm. Data are representative of at least three independent experiments.
Extended Data Figure 8.
Extended Data Figure 8.. Imatinib, MPA, and QNHC inhibit SARS-CoV-2 on Vero cells.
a. qRT-PCR based dose curve of imatinib, MPA and QNHC on Vero cells at 24 hours post-SARS-CoV-2 infection (SARS-CoV-2, MOI=0.01). n=3 biological independent experiments. b, c, Western blotting (b) and quantification (c) of 3 μM MPA, 4.5 μM QNHC or DMSO-treated Vero cells at 24 hours post-SARS-CoV-2 infection (SARS-CoV-2, MOI=0.01). n=3 biological independent experiments, ***P=0.000223, ***P=5.09E-05, ***P=4.32E-05. ***P=3.72E-08. d, e, Western blotting (d) and quantification (e) of DMSO or 10 μM imatinib treated Vero cells at 24 hpi (SARS-CoV-2, MOI=0.01). n=3 biological independent experiments, ***P=7.41E-18, ***P=8.06E-07, ***P=7.41E-18, ***P=3.39E-06. ***P<0.001. Data were analyzed by an unpaired two-tailed Student’s t-test and shown as mean ± STDEV. Data are representative of at least three independent experiments.
Extended Data Figure 9.
Extended Data Figure 9.. Efficacy and survival curve of imatinib, MPA and QNHC on VSVG virus on Vero cells.
a, Inhibition curve of imatinib, MPA and QNHC on VSVG virus. n=3 biological independent experiments. b, Cell survival curve of imatinib, MPA and QNHC. n=3 biological independent experiments. Data are representative of at least three independent experiments.
Extended Data Figure 10.
Extended Data Figure 10.. The impact of imatinib, MPA and QNHC on different steps of viral entry.
a. ACE2 binding assay. b, c, Western blotting (b) and quantification (c) of TMPRSS2 and FURIN of DMSO, imatinib, MPA and QNHC treated hPSC-LOs. n=3 biological independent experiments, P=0.771, ***P=8.86E-05, ***P=3.86E-05. d, PCA plot of RNA-seq data from hPSC-LOs treated with DMSO or 10 μM imatinib at 24 hpi of SARS-CoV-2 virus. e, Volcano plot analysis of differential gene expression of hPSC-LOs treated with DMSO or 10 μM imatinib at 24 hpi of SARS-CoV-2 virus. Individual genes are denoted by gene name. f, Gene over-representation analysis on KEGG pathway database of differential expression of hPSC-LOs pretreated with DMSO or 10 μM imatinib at 24 hpi of SARS-CoV-2 virus. n=3 biological independent experiments. ***P < 0.001. Data were analyzed by an unpaired two-tailed Student’s t-test and shown as mean ± STDEV. Data are representative of at least three independent experiments.
Figure 1.
Figure 1.. hPSC-LOs are permissive to SARS-CoV-2 virus infection both in vitro and in vivo.
a. UMAP of hPSC-LOs. b. AT2 cell markers in each cluster in UMAPs. c. Enrichment analysis of hPSC-LOs using genes highly expressed in adult human AT2 cells. d. Correlation analysis of genes with cell fates in hPSC-LOs and adult human lung cells. e. UMAP of ACE2, TMPRSS2 and FURIN expression in hPSC-LOs. f. Immunostaining of hPSC-LOs. Scale bars= 30 μm. Microscale bars=10 μm. g. Luciferase activity at 24 hpi of hPSC-LOs either mock-infected or SARS-CoV-2-entry virus infected (MOI=0.01). n=3 biological independent experiments. ***P=1.62E-06. h. Schematic of in vivo transplantation of hPSC-derived lung xenografts. i, Immunostaining of hPSC-derived lung xenografts. Scale bars=75 μm. Microscale bars=10 μm. j, Immunostaining of hPSC-derived lung xenografts at 24 hpi (1X10⁴ FFU). Scale bars= 75 μm. Microscale bars=10 μm. k, qRT-PCR analysis of total RNA extracted from infected hPSC-LOs (24 hpi, MOI=0.01) for viral N sgRNA. n=3 biological independent experiments. *P=0.0236. l, Immunostaining of hPSC-LOs at 24 hpi (SARS-CoV-2, MOI=0.01). Scale bars= 50 μm. Microscale bars=10 μm. m, Alignment of the transcriptome with the viral genome in SARS-CoV-2 infected hPSC-LOs. Schematic below shows the SARS-CoV-2 genome. n, Volcano plot analysis of differential expression of SARS-CoV-2 infected hPSC-LOs versus mock infection. Red line indicates p-adjusted value<0.05. o, Gene over-representation analysis using KEGG pathway database of SARS-CoV-2 infected hPSC-LOs versus mock infection. n=3 biological independent experiments. p. Gene over-representation analysis using KEGG pathway database of lung autopsy tissues from COVID-19 versus healthy patients. n=3 patients for each group. *P < 0.05 and ***P< 0.001. Data were analyzed by an unpaired two-tailed Student’s t-test and shown as mean ± STDEV. Data are representative of at least three independent experiments.
Figure 2.
Figure 2.. hPSC-COs are permissive to SARS-CoV-2 virus infection.
a-c, Hematoxylin and Eosin staining (a), in-situ hybridization staining for SARS-CoV-2 RNA (b) and electron microscopy (c) of colonoscopy biopsy tissue from a COVID-19 patient. Scale bar= 50 μm (a), 25 μm (b), 1 μm (c). The arrows indicate SARS-CoV-2 RNA (b), or SARS-CoV-2 viral particles (c). d, UMAP of hPSC-CO cell types. e, f, UMAP (e), and jitter plot (f) of ACE2, TMPRSS2 and FURIN. g, Correlation of expression levels for KRT20 with ACE2, TMPRSS2 and FURIN. h, Confocal images of hPSC-COs. Scale bar= 100 μm. i, j Luciferase activity (i) and UMAP (j) of COs infected with SARS-CoV-2-entry virus (24 hpi, MOI=0.01). n=4 biological independent experiments (i). ***P=2.25E-06. k, Jitter plots of VSV-M, VSV-N and VSV-P transcript levels. l, Immunostaining of hPSC-COs infected with SARS-CoV-2-entry virus (MOI=0.01). Scale bar= 50 μm. m, Schematic of the in vivo infection. n, Confocal image of colonic xenograft. Scale bar= 100 μm. Microscale bars= 30 μm. o, p, Confocal image of colonic xenograft 24 hpi (1X10³ FFU) stained with antibodies against luciferase (o) and ACE2 or Villin (p). Scale bar= 75 μm. Microscale bars= 25 μm. q, Immunostaining to detect SARS-CoV-2-nucleocapsid protein (SARS-N) in hPSC-COs. Scale bar= 100 μm. Microscale bars= 40 μm. r, RNA-seq read coverage of the viral genome in infected hPSC-COs (24 hpi, MOI=0.1). s-u, PCA plot (s), volcano plot (t), GSEA pathway analysis (u) of gene expression profiles from mock and SARS-CoV-2-infected hPSC-COs at 24 hpi (MOI=0.1). n=3 biological independent experiments. Red line indicates p=0.05. ***P < 0.001. Data were analyzed by an unpaired two-tailed Student’s t-test and shown as mean ± STDEV. Data are representative of at least three independent experiments.
Figure 3.
Figure 3.. A hPSC-LO-based high throughput chemical screen identifies three FDA-approved drug candidates that block SARS-CoV-2 entry.
a, Primary screening results. Red line is Z-score <−2, which means the luminescent signal is lower than average-2xSTDEV. b-d, Chemical structure of imatinib (b), MPA (c), and QNHC (d). e-g, Efficacy and toxicity curves of imatinib (e), MPA (f), and QNHC (g). n=3 biological independent experiments. h, Immunofluorescent staining of luciferase (Luc)+ cells in imatinib, MPA, and QNHC-treated hPSC-LOs at 24 hpi (MOI=0.01). Scale bar= 50 μm. Microscale bars= 10 μm. i, Scheme of in vivo drug treatment. j-k, Immunostaining (j) and quantification (k) of hPSC-derived lung xenografts of mice treated with 400 mg/kg imatinib mesylate, 50 mg/kg MPA, and 25 mg/kg QNHC at 24 hpi (1X10⁴ FFU). Scale bars= 100 μm. Microscale bars= 10 μm. n=6 xenografts for each group. ***P=5.54E-06, ***P=5.19E-06, ***P=1.66E-05. ***P< 0.001. Data were analyzed by an unpaired two-tailed Student’s t-test and shown as mean ± STDEV. Data are representative of at least three independent experiments.
Figure 4.
Figure 4.. Imatinib, mycophenolic acid, and quinacrine dihydrochloride each block the entry of SARS-CoV-2 virus in both hPSC-derived LOs and COs.
a-c, qRT-PCR analysis of total RNA extracted from infected hPSC-LOs for viral N sgRNA (a, n=3 biological independent experiments, *P=0.0256, ***P=0.000333, ***P=0.000461), immunofluorescent staining (b) and quantification (c, n=4 biological replicates for each group, ***P=6.36E-05, ***P=5.63E-05, ***P=0.000566) of SARS-CoV-2 Spike protein (SARS-S) and SP-B/SP-C in imatinib, MPA, or QNHC treated hPSC-LOs at 24 hpi (MOI=0.5). Scale bar= 50 μm. Microscale bar= 15 μm. d-f, qRT-PCR analysis of total RNA extracted from infected hPSC-COs for viral N sgRNA (d, n=3 biological independent experiments, ***P=0.0260, ***P=0.0166, ***P=0.000235), immunofluorescent staining (e) and quantification (f, n=6 biological independent experiments, **P=0.00242, ***P=4.34E-05, ***P=5.26E-05) of SARS-CoV-2 nucleocapsid protein (SARS-N) of imatinib, MPA, or QNHC-treated hPSC-COs at 24 hpi (MOI=0.5). Scale bar= 50 μm. Microscale bars=15 μm. *P < 0.05, **P < 0.01, and ***P < 0.001. Data were analyzed by an unpaired two-tailed Student’s t-test and shown as mean ± STDEV. Data are representative of at least three independent experiments.

References

    1. Pan L et al. Clinical Characteristics of COVID-19 Patients With Digestive Symptoms in Hubei, China: A Descriptive, Cross-Sectional, Multicenter Study. Am J Gastroenterol 115, 766–773, doi:10.14309/ajg.0000000000000620 (2020). - DOI - PMC - PubMed
    1. Lamers MM et al. SARS-CoV-2 productively infects human gut enterocytes. Science, doi:10.1126/science.abc1669 (2020). - DOI - PMC - PubMed
    1. Zhou J et al. Infection of bat and human intestinal organoids by SARS-CoV-2. Nat Med, doi:10.1038/s41591-020-0912-6 (2020). - DOI - PubMed
    1. Monteil V et al. Inhibition of SARS-CoV-2 Infections in Engineered Human Tissues Using Clinical-Grade Soluble Human ACE2. Cell 181, 905–913 e907, doi:10.1016/j.cell.2020.04.004 (2020). - DOI - PMC - PubMed
    1. Chen YW et al. A three-dimensional model of human lung development and disease from pluripotent stem cells. Nat Cell Biol 19, 542–549, doi:10.1038/ncb3510 (2017). - DOI - PMC - PubMed

MeSH terms

Substances