. 2020 Nov;587(7833):258-263.
doi: 10.1038/s41586-020-2860-1. Epub 2020 Oct 28.

Parallel ascending spinal pathways for affective touch and pain

Affiliations

Parallel ascending spinal pathways for affective touch and pain

Seungwon Choi et al. Nature. 2020 Nov.

Abstract

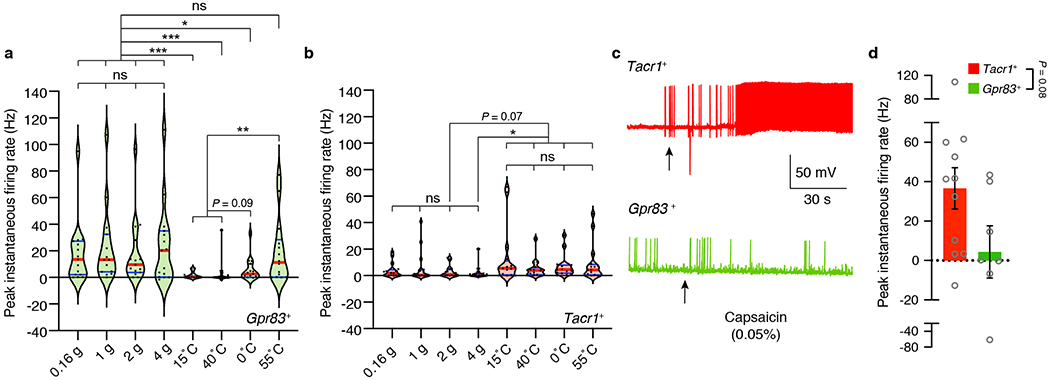
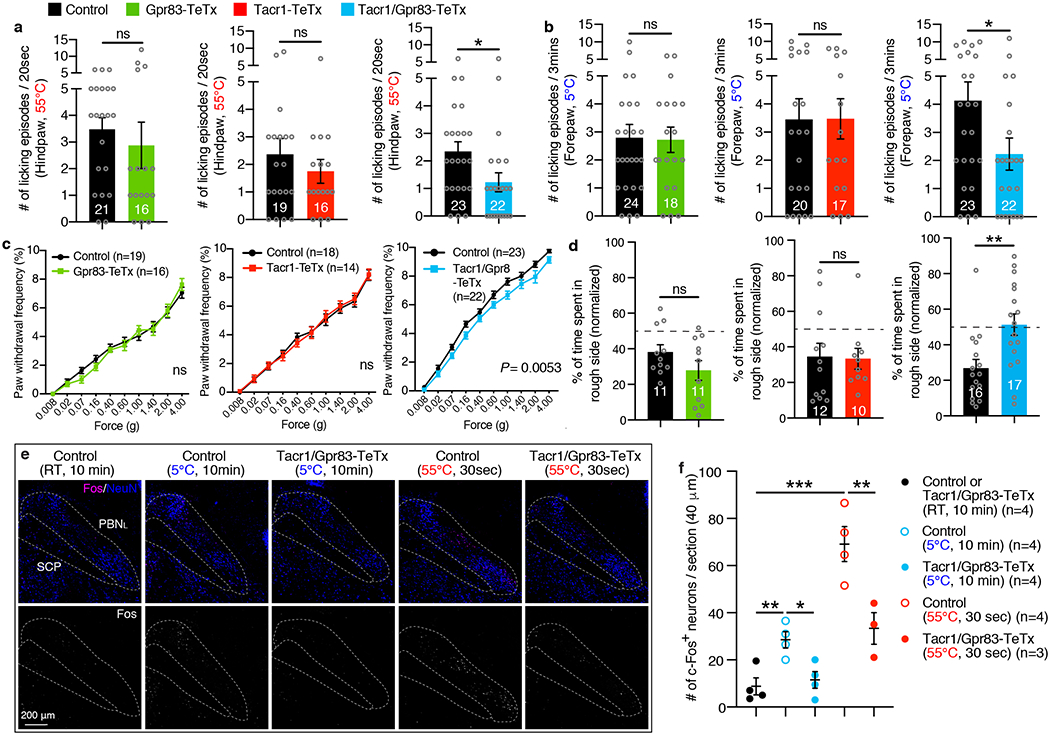
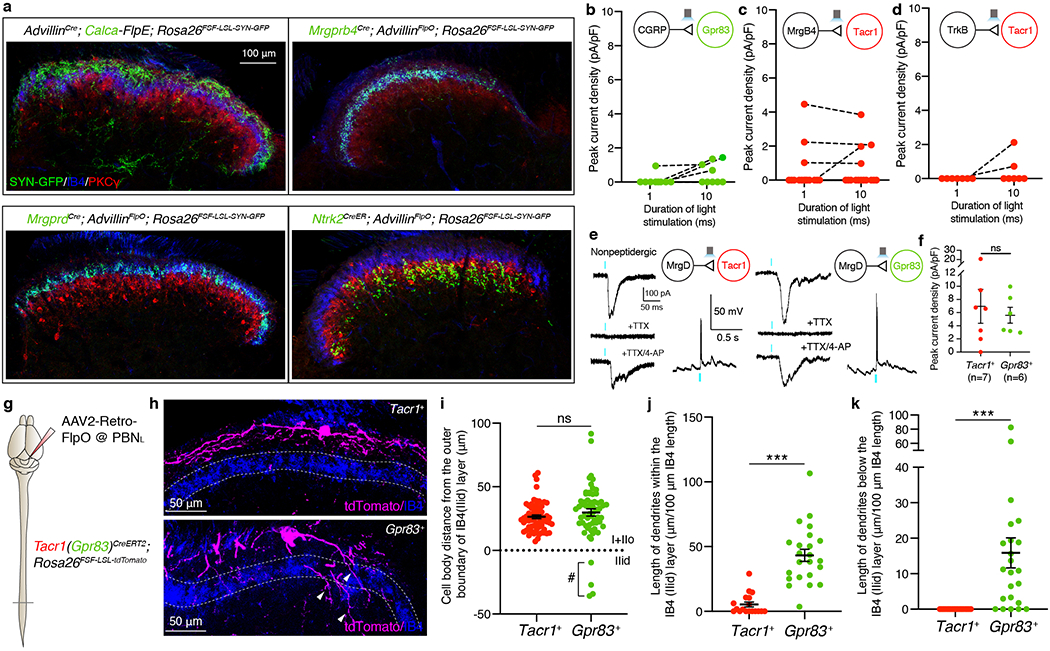
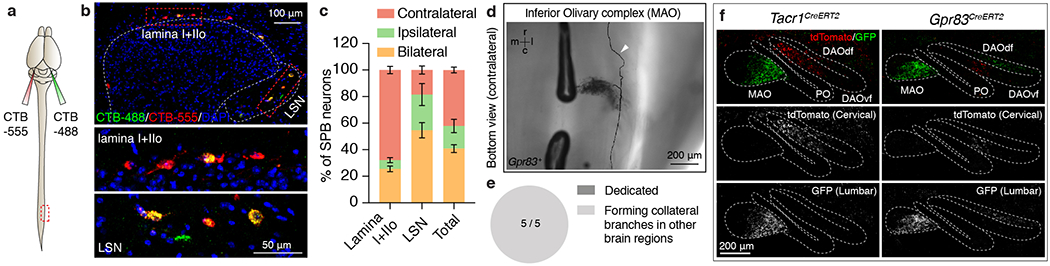
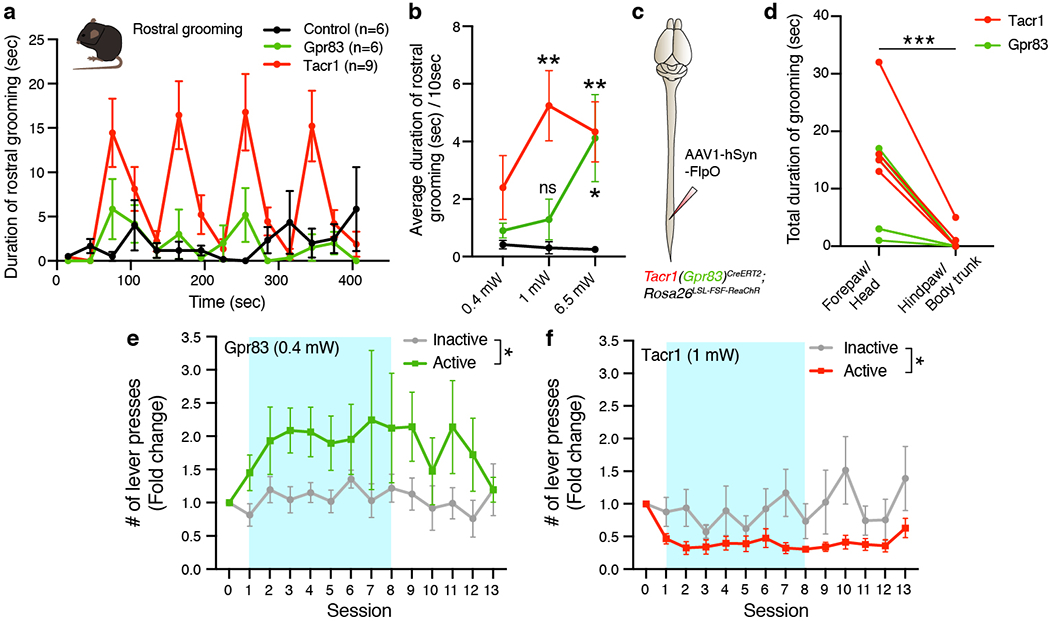
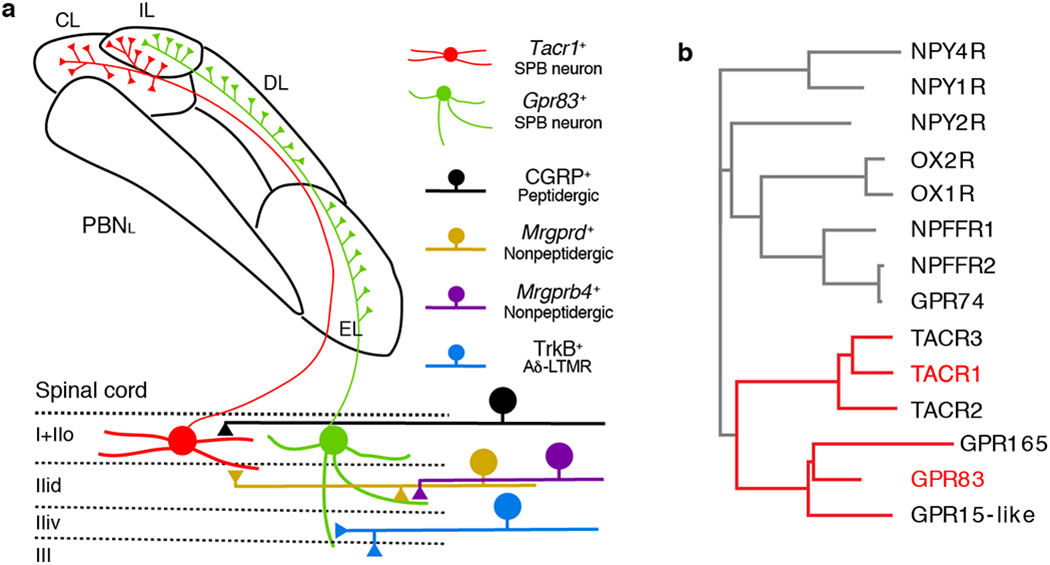
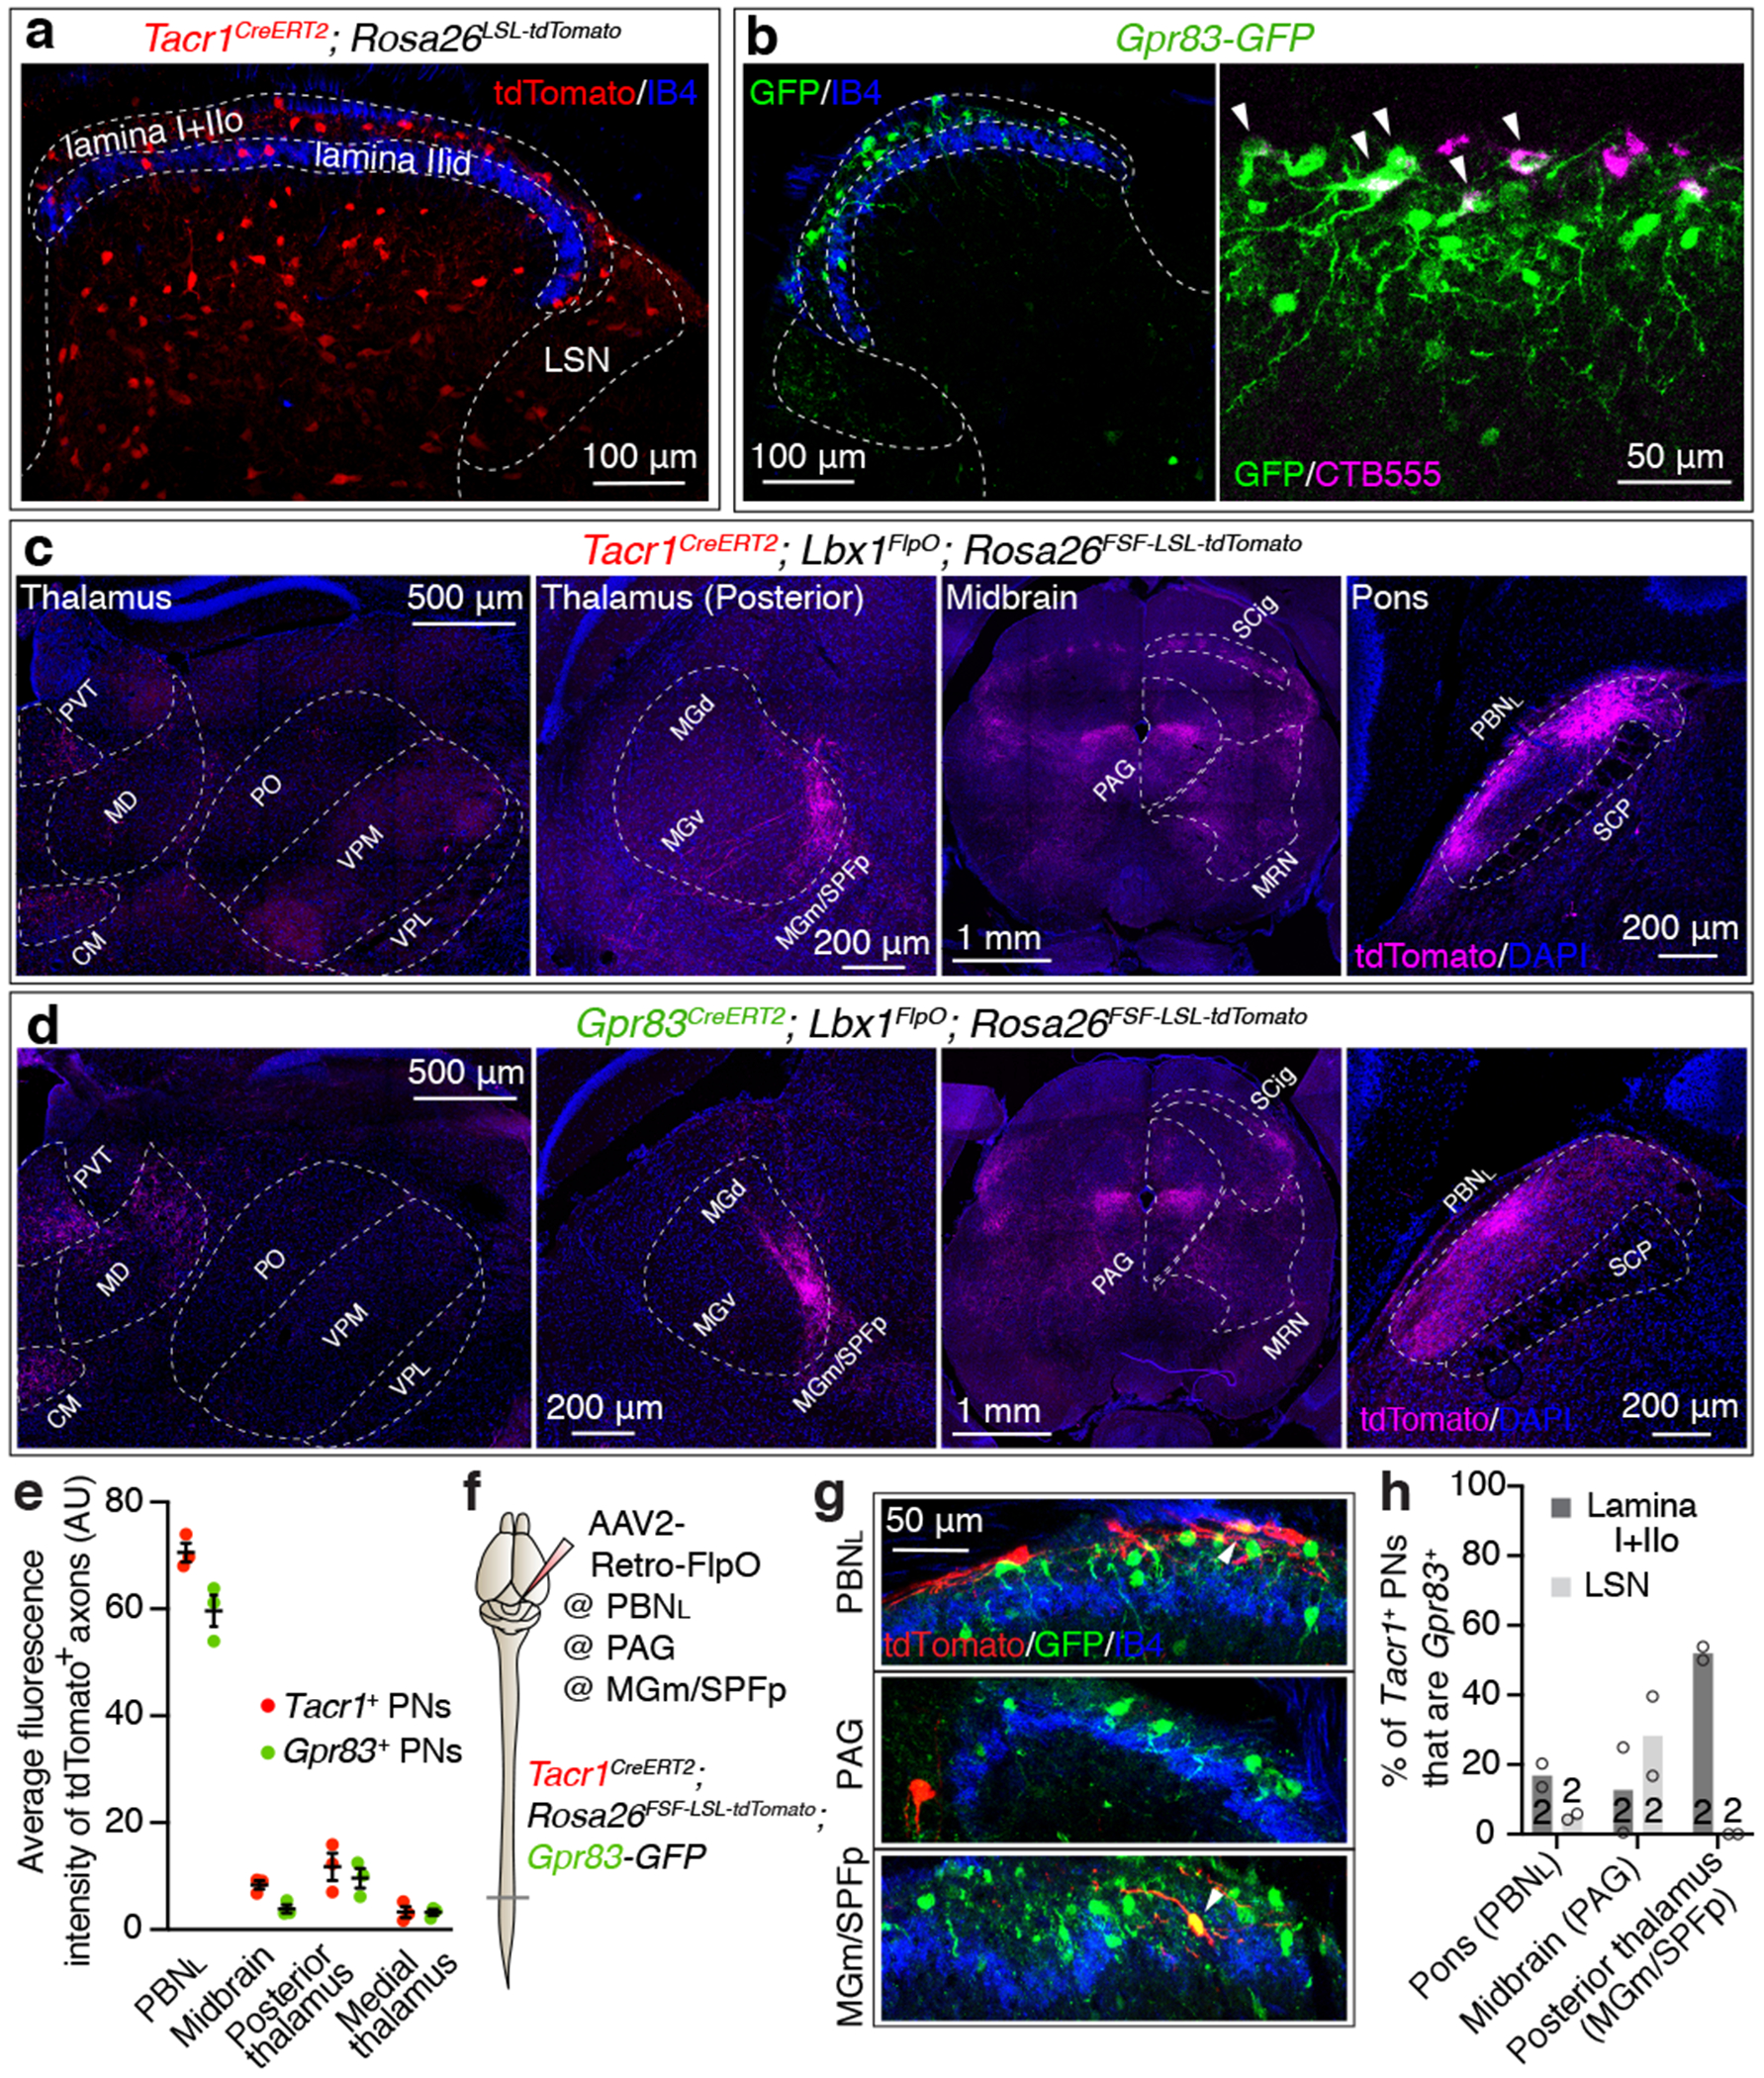
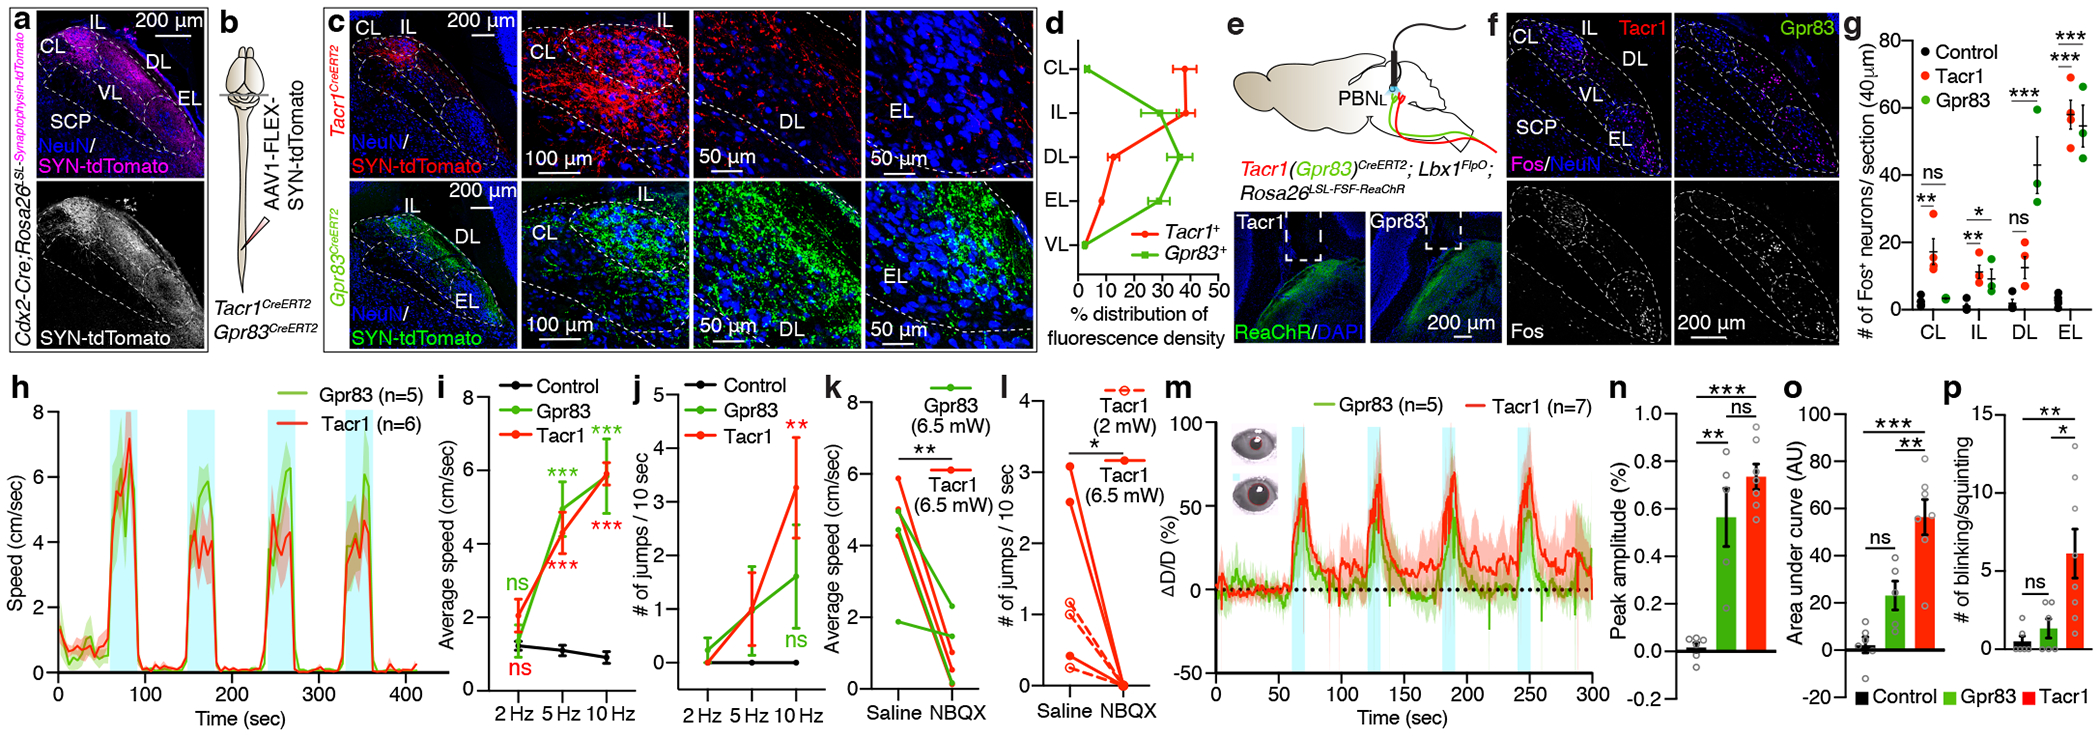
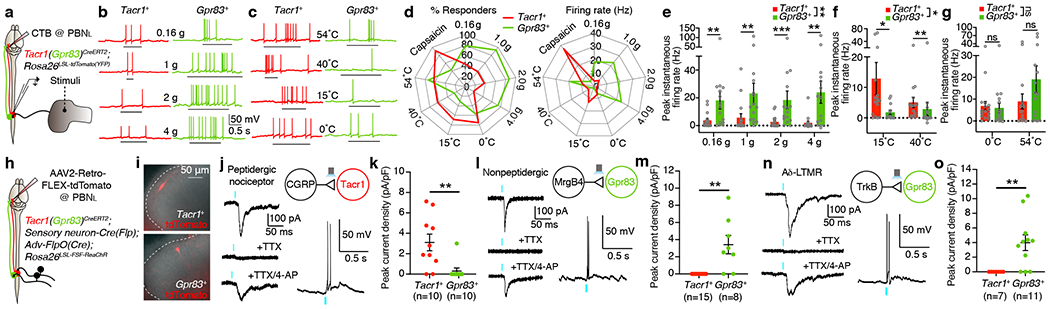
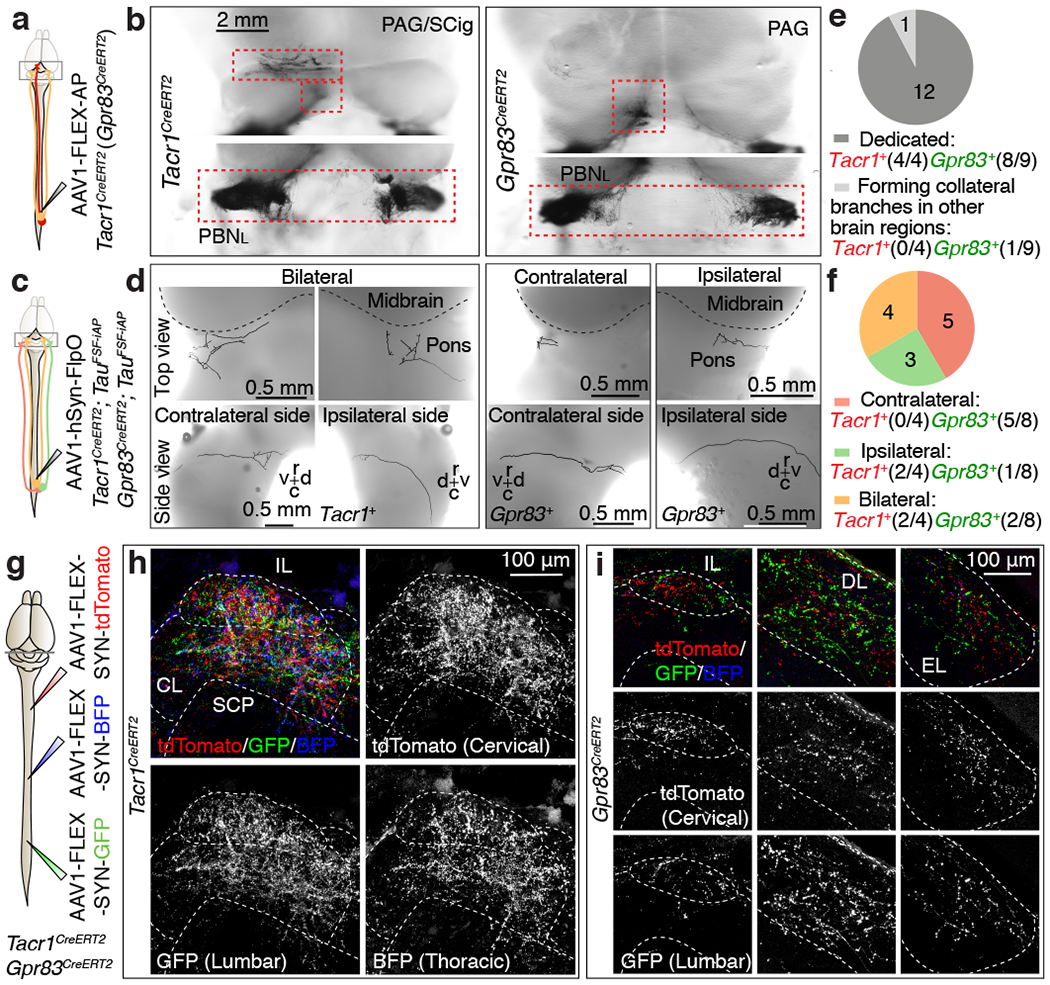
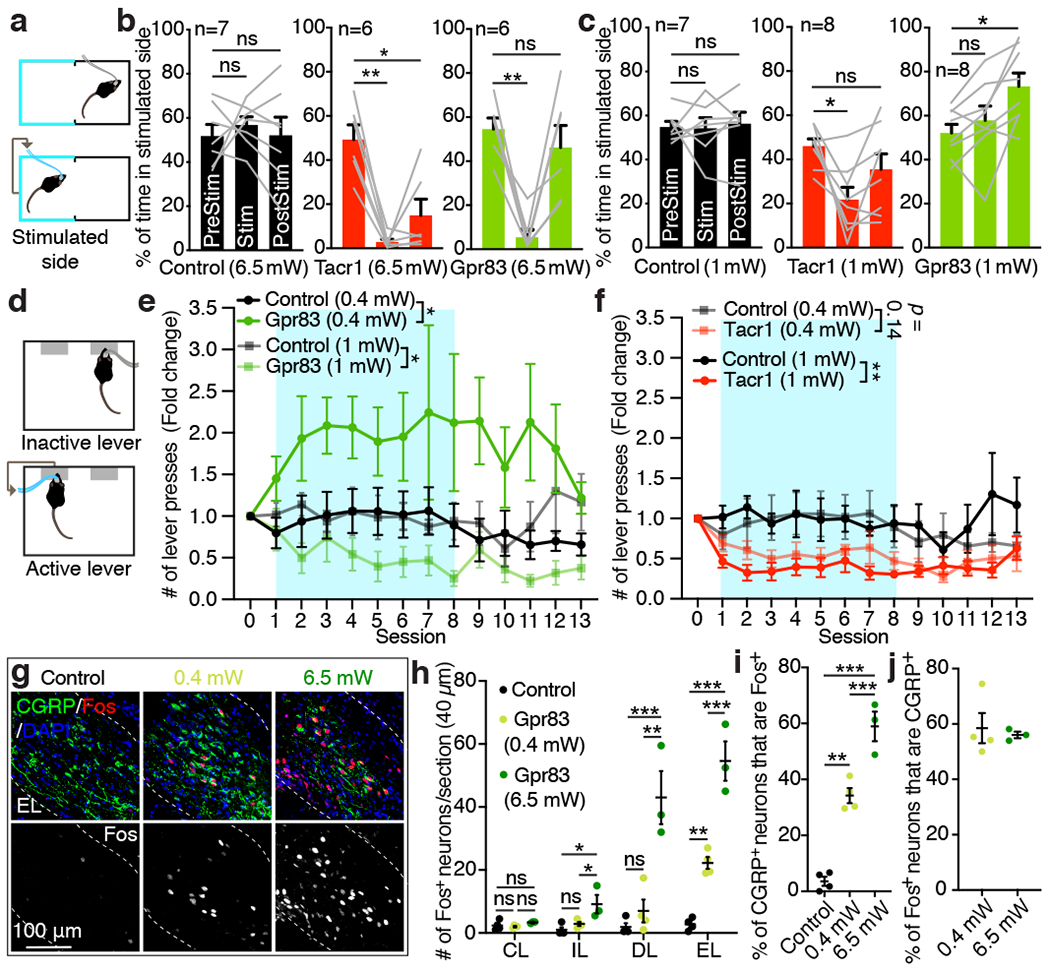
The anterolateral pathway consists of ascending spinal tracts that convey pain, temperature and touch information from the spinal cord to the brain1-4. Projection neurons of the anterolateral pathway are attractive therapeutic targets for pain treatment because nociceptive signals emanating from the periphery are channelled through these spinal projection neurons en route to the brain. However, the organizational logic of the anterolateral pathway remains poorly understood. Here we show that two populations of projection neurons that express the structurally related G-protein-coupled receptors (GPCRs) TACR1 and GPR83 form parallel ascending circuit modules that cooperate to convey thermal, tactile and noxious cutaneous signals from the spinal cord to the lateral parabrachial nucleus of the pons. Within this nucleus, axons of spinoparabrachial (SPB) neurons that express Tacr1 or Gpr83 innervate distinct sets of subnuclei, and strong optogenetic stimulation of the axon terminals induces distinct escape behaviours and autonomic responses. Moreover, SPB neurons that express Gpr83 are highly sensitive to cutaneous mechanical stimuli and receive strong synaptic inputs from both high- and low-threshold primary mechanosensory neurons. Notably, the valence associated with activation of SPB neurons that express Gpr83 can be either positive or negative, depending on stimulus intensity. These findings reveal anatomically, physiologically and functionally distinct subdivisions of the SPB tract that underlie affective aspects of touch and pain.


Conflict of interest statement

Competing interests

The authors declare no competing interests.

Figures

Extended Data Figure 1.
Extended Data Figure 1.. Generation of CreERT2 mouse lines for genetic labeling of anterolateral pathway neurons and Flp mouse lines for labeling primary sensory neurons.
a1-a3, Gene targeting strategies used to generate the Robo3IRES-CreERT2 (a1), Tacr1CreERT2 (a2), and Gpr83CreERT2 (a3) mouse lines. a1, A 3X-STOP-IRES-CreERT2 cassette was introduced via homologous recombination into the first common coding exon that is shared by different splice variants of the Robo3 gene. a2, A CreERT2 cassette was introduced via homologous recombination into the Tacr1 gene, replacing the first coding ATG. a3, A CreERT2 cassette was introduced via homologous recombination into the Gpr83 gene, replacing the first coding ATG. IRES, internal ribosome entry site; s.int, synthetic intron; WPRE, Woodchuck Hepatitis Virus (WHP) Posttranscriptional Regulatory Element; pA, poly A; f, FRT site; kz, kozak sequence. b1-b3, A horizontal section of the lumbar spinal cord. 93.7 ± 2.6 % of tdTomato+ neurons were Tacr1+, while 96.6 ± 2.4 % of Tacr1+ neurons were tdTomato+. n = 3 mice. c, A transverse section of a Gpr83-GFP mouse. Green and red dots represent GFP and Gpr83 mRNA molecules, respectively, detected with gene-specific RNAscope probes. 96.0 ± 1.2% of GFP+ cells were Gpr83+, while 84.5 ± 5.0% of Gpr83+ cells were GFP+. n = 2 mice. d, Distribution of tdTomato-expressing Robo3+ neurons in the spinal cord dorsal horn (top) and their thalamic projections terminating in the VPL (bottom). n = 2 mice. e1-5, Characterization of the AdvillinFlpO mouse line. n = 4 mice. e1-e3, The AdvillinFlpO mouse line labels the majority of DRG neurons (99.0 ± 0.1% of NeuN+ neurons are tdTomato+) (e1), nodose ganglia neurons (80.8 ± 5.1% of NeuN+ neurons are tdTomato+) (e2), and sympathetic ganglia neurons (98.6 ± 0.3% of TH+ neurons are tdTomato+) (e3). e4, A transverse section of the vertebral column. tdTomato+ Advillin-expressing neurons and their axons are visualized in the spinal cord (asterisk), DRGs (arrows), and sympathetic ganglia (arrowheads). e5, A coronal section of the brainstem. tdTomato+ axons of Advillin-expressing neurons innervate the nucleus of the solitary tract (arrowhead), the dorsal column nuclei (arrow), and the trigeminal nucleus (asterisk). f1-4, Characterization of the Calca-FlpE mouse line. n = 2 mice. A cross section of the lumbar DRG (f1-f3) and a transverse section of the lumbar spinal cord (f4). f1-3, 91.9 ± 1.5 % of tdTomato+ neurons were CGRP+, while 92.3 ± 1.5 % of CGRP+ neurons were tdTomato+. f4, tdTomato-expressing axons of CGRP+ DRG neurons are CGRP immunoreactive in the spinal cord dorsal horn.
Extended Data Figure 2.
Extended Data Figure 2.. Comparative analysis of the Gpr83+, Tacr1+, and Tac1+ SPB populations.
a, Distribution of EYFP-expressing Tacr1+ (top) or Gpr83+ (bottom) spinal neurons and mCherry-expressing Gad2+ neurons in the superficial lamina of the spinal cord dorsal horn. b, Quantification of % of Gad2-negative neurons in EYFP+ neurons. 97.5 ± 1.4 % of Tacr1+ neurons and 99.5 ± 0.5 % of Gpr83+ neurons were Gad2-negative. c, Distribution of tdTomato-expressing Tacr1+ neurons and GFP-expressing Gpr83+ neurons in the spinal cord dorsal horn. d, Quantification of co-expression of tdTomato and GFP. 80.2 ± 1.5% and 87.0 ± 2.5% of tdTomato-expressing Tacr1+ neurons are not positive for GFP expression in lamina I+IIo and lamina IIid, respectively. Conversely, 78.0 ± 1.8% and 92.0 ± 1.4% of GFP-expressing Gpr83+ neurons are not positive for tdTomato expression in lamina I+IIo and lamina IIid, respectively. e, Distribution of EYFP-expressing Tacr1+ neurons, Gpr83+ neurons, or both in the superficial lamina of the spinal cord dorsal horn. The SPB neurons were retrogradely labeled with CTB injected into the PBNL. Arrowheads, CTB and EYFP double-positive neurons. f, Quantification for % of Tacr1+ SPB neurons, Gpr83+ SPB neurons, and either Tacr1+ or Gpr83+ SPB neurons. g, % of Tacr1+, Gpr83+, Tacr1+ Gpr83+, and Tacr1 Gpr83 SPB neurons calculated from experiments in e, f. h, i, Coronal sections of the ventral brain stem of Tacr1CreERT2 (f) or Gpr83CreERT2 (h) mice whose lumbar spinal cords were injected with AAV1-FLEX-Synaptophysin-GFP viruses. MAO, medial accessory olivary nucleus; DAOdf, dorsal accessory olivary nucleus dorsal fold; DAOvf, dorsal accessory olivary nucleus ventral fold; PO, primary olivary nucleus. j, Distribution of tdTomato-expressing Tac1+ neurons in the superficial lamina of the spinal cord dorsal horn. The SPB neurons were retrogradely labeled with CTB injected into the PBNL. Arrowhead, CTB and tdTomato double-positive neuron. k, Quantification of % of Tac1+ SPB neurons. l, Schematic of injections of AAV2-retro-FlpO viruses into the PBNL. m, Distribution of tdTomato-expressing Tacr1+ (left) or Gpr83+ (right) SPB neurons and Tac1-expressing neurons in the spinal cord dorsal horn. tdTomato (red) and Tac1 (green) mRNA molecules were detected with gene-specific RNAscope probes. Filled arrowheads, double-positive neurons; empty arrowheads, tdTomato+ SPB neurons that do not express Tac1. n, Quantification of co-expression of tdTomato and Tac1 in lamina I+IIo. o, Schematic of lumbar injections of an AAV1-FLEX-Synaptophysin-tdTomato virus. p, Distribution of tdTomato-positive synaptic terminals of Tac1+ SPB neurons in the PBNL. q, Quantification of distribution of tdTomato-positive synaptic terminals of Tac1+ SPB neurons in the PBNL. n = number of mice (indicated in the graph). Error bars, s.e.m.
Extended Data Figure 3.
Extended Data Figure 3.. Tacr1+ and Gpr83+ spinal PNs that innervate the posterior thalamus, midbrain, or the pons are distinct populations.
a, d, g, Schematics of lumbar spinal cord injections of AAV1-Con/Fon-EYFP viruses and brain injections of AAV2-retro-FlpO viruses into the SCig of Tacr1CreERT2 mice (a) (n = 3 mice), the MGm/SPFp of Tacr1CreERT2 (d) (n = 2 mice) or Gpr83CreERT2 mice (g) (n = 3 mice). b, e, h, Transverse sections of cervical spinal cords of Tacr1CreERT2 (b, e) or Gpr83CreERT2 mice (h). White dotted lines, tdTomato-expressing axons traveling through spinal cord white matter. DLF, dorsal lateral funiculus; VLF, ventral lateral funiculus. c, f, i, Coronal sections of target brain regions of Tacr1+ (c, f) or Gpr83+ (i) spinal PNs. AQ, cerebral aqueduct.
Extended Data Figure 4.
Extended Data Figure 4.. Strong axon terminal stimulation of Tacr1+ and Gpr83+ SPB neurons produces distinct locomotor behaviors.
a, Association of synaptic terminals of Tacr1+ and Gpr83+ SPB neurons with Calca-GFP-expressing cell bodies and neurites in the PBNEL. b, Quantification of the number of synaptophysin-tdTomato puncta associated with GFP+ cell bodies and neurites. The numbers were normalized with the total GFP+ area (to normalize for the variability of total GFP+ area) and the total number of synaptophysin-tdTomato puncta within the entire PBNL (to normalize for the variability of virus injections). AU, arbitrary unit. Two-tailed t-test; n = 4 mice each for Tacr1+ and Gpr83+ SPB neurons. c, Quantification of average speed during light-off periods following light-on periods (473 nm, 6.5 mW, 10 ms pulse width). One-way ANOVA (Dunnett’s multiple comparisons test); F[2, 16] = 10.60 (2 Hz), F[2, 16] = 40.12 (5 Hz), F[2, 16] = 20.48 (10 Hz). d, Average velocity of mice over time (6.5 mW, 2 Hz, 10 ms pulse width). Positive values indicate forward movement whereas negative values indicate backward movement. Shaded areas, s.e.m. e, f, Quantification of average velocity during light-on periods with 2 Hz (e) and 5 Hz (f) photostimulation. Note that mice receiving Tacr1+ SPB neuron terminal stimulation exhibited net negative velocity during the 2 Hz photostimulation and lack a velocity increase despite the dramatic increase in speed during 5 Hz photostimulation. Two-tailed t-test; n = 6, 5 mice for Tacr1, Gpr83, respectively. g, Distribution of Fos+ neurons in the spinal cord dorsal horn following either photostimulation of axon terminals of SPB neurons (Tacr1+ or Gpr83+) or a capsaicin (0.1%) injection into a hindpaw. Photostimulation of axon terminals of SPB neurons did not induce significant Fos expression in the spinal cord, whereas a hindpaw injection of capsaicin induced strong Fos expression in the medial region of the superficial lamina of the spinal cord dorsal horn. d, dorsal; v, ventral, m, medial; l, lateral. n = 4, 3, 5, 2 mice for control, Gpr83, Tacr1, Capsaicin, respectively. h, Quantification of the number of Fos+ neurons in lamina I and II. The number of Fos+ cells was quantified in the medial 200 μm of the spinal cord dorsal horn. One-way ANOVA (Tukey’s multiple comparisons test). Error bars, s.e.m.
Extended Data Figure 5.
Extended Data Figure 5.. Physiological response properties of Tacr1+ and Gpr83+ SPB neurons.
a, b, Summary violin plots of peak instantaneous firing rates of Gpr83+ (a) and Tacr1+ (b) SPB neurons in response to von Frey indentations and thermal stimuli. Red lines indicate median, while blue lines indicate quartiles. Friedman test (Dunn’s multiple comparison test). n = 16, 15 neurons for Tacr1+, Gpr83+, respectively. c, Representative traces of action potential firing evoked by topical capsaicin (0.05%) treatment. Arrows, time when capsaicin was applied to the skin. d, Quantification of peak instantaneous firing rates upon capsaicin application. Mann-Whitney test (two-tailed); p value is indicated; n = 11, 7 neurons for Tacr1+, Gpr83+, respectively; error bars, s.e.m.
Extended Data Figure 6.
Extended Data Figure 6.. Simultaneous inhibition of the synaptic outputs of both Tacr1+ and Gpr83+ SPB neurons attenuates nocifensive behaviors in response to noxious cutaneous stimuli.
a, Hindpaw-licking was scored while Tacr1CreERT2; Lbx1FlpO; Rosa26LSL-FSF-TeTx mice, Gpr83CreERT2; Lbx1FlpO; Rosa26LSL-FSF-TeTx mice, or Tacr1CreERT2; Gpr83CreERT2; Lbx1FlpO; Rosa26LSL-FSF-TeTx mice were placed on the 55°C hot plate (cut-off time, 20 seconds). These intersectional strategies target the entire Tacr1+ and Gpr83+ spinal populations, of which 34.2% (20.5% PBNL-projecting, 6.6% PAG-projecting, and 7.1% MGm/SPFp-projecting PNs are combined) and 30.9% (14.0% PBNL-projecting, 4.6% PAG-projecting, and 12.3% MGm/SPFp-projecting PNs are combined) are Tacr1+ and Gpr83+ PNs (laminaI/IIo and the LSN are combined), respectively (a detailed description of the quantification is in the methods). Two-tailed t-test. b, Forepaw-licking was scored while mice were placed on the 5°C cold plate (cut-off time, 3 minutes). Two-tailed t-test. c, Paw withdrawal frequency following hindpaw skin indentation using von Frey filaments was scored. Two-way ANOVA; p value is indicated; F[1, 43] = 8.65 for Tacr1/Gpr83-TeTx. d, Real-time texture aversion assay (150 grit sand paper vs 400 grit sand paper). % of time spent in rough side of sand paper (150 grit) was measured (normalized to baseline preference). Two-tailed t-test. e, f, The suppression of neurotransmission in the quadruple transgenic mice was confirmed by reduced Fos induction in the PBNL following exposure of mice to noxious thermal stimuli. e, Distribution of Fos+ neurons in the PBNL following thermal stimulation. f, Quantification of the number of Fos+ neurons in the PBNL. One-way ANOVA (Tukey’s multiple comparisons test); F[2, 9] = 8.97 (5°C), F[2, 8] = 27.09 (55°C). n = number of mice (indicated in the graphs). Error bars, s.e.m.
Extended Data Figure 7.
Extended Data Figure 7.. Gpr83+ and Tacr1+ SPB neurons receive strong synaptic inputs from Mrgprd+ polymodal non-peptidergic sensory neurons and weak, sparse, and polysynaptic inputs from distinct primary sensory neurons, and exhibit distinct dendritic morphologies.
a, Distribution of CGRP+, Mrgprb4+, Mrgprd+, and Ntrk2+ primary afferent synaptic terminals in the spinal cord dorsal horn. The Rosa26FSF-LSL-SYN-GFP reporter mouse line was used in combination with sensory neuron Cre/FlpE mouse lines and AdvillinFlpO/AdvillinCre mouse lines. Note that CGRP+, Mrgprb4+, Mrgprd+, and Ntrk2+ primary afferent synaptic terminals mainly innervate lamina I+IIo, IIid, IIid, and IIiv+III, respectively. b-d, Quantifications of peak current density in Tacr1+ (c, d) and Gpr83+ (b) SPB neurons elicited by long light pulse-stimulation (1 ms and 10 ms) of CGRP+ (b), Mrgprb4+ (c), and Ntrk2+ (d) primary afferent terminals. The same neurons, stimulated with different durations of light stimulation, are connected by dotted lines. Note that only a small fraction of Gpr83+ SPB neurons exhibited long-latency (21.68 ± 2.66 ms), high-jitter (2.97 ± 0.85 ms) polysynaptic EPSCs with 10 ms-long photostimulation of CGRP+ afferent terminals and, conversely, only a small fraction of Tacr1+ SPB neurons exhibited long-latency (14.29 ± 3.49 ms), high-jitter (4.31 ± 2.31 ms) polysynaptic EPSCs with 10 ms-long photostimulation of Mrgprb4+ afferent terminals. 2 out of 7 Tacr1+ SPB neurons exhibited long-latency (11.89 ± 4.18 ms), but relatively low-jitter (0.57 ± 0.21 ms) synaptic EPSCs following 10 ms-long photostimulation of Ntrk2+ afferent terminals. e, Representative traces of light-activated currents (left) and AP firing (right) upon photostimulation of Mrgprd+ primary afferent terminals. Turquoise bars, 0.1 ms (EPSCs) and 1 ms (APs) LED (473 nm) stimulations. f, Quantifications of peak current density. Mann-Whitney test (two-tailed); n = number of neurons. g, Schematic of injections of AAV2-retro-FlpO viruses into the PBNL. h, Distribution of tdTomato-expressing dendrites of Tacr1+ (top) and Gpr83+ (bottom) SPB neurons. Lamina IIid is labeled using IB4 binding. Arrowheads, Gpr83+ dendrites that are extended into deeper lamina of the spinal cord dorsal horn. i, Quantification of distance between the cell bodies and the outer boundary of IB4+ lamina IIid (dotted line). #, note that a small number of Gpr83+ SPB neurons have their cell bodies located within lamina IIid. n = 65, 60 neurons for Tacr1+, Gpr83+, respectively. j, k, Quantifications of total length of dendrites in a spinal cord section image within (j) or below (k) IB4+ lamina IIid (normalized to the total length of the IB4+ lamina IIid in the same spinal cord section image). Two-tailed t-test; n = 18, 23 sections (40 μm) for Tacr1+, Gpr83+, respectively. Error bars, s.e.m.
Extended Data Figure 8.
Extended Data Figure 8.. Anatomical analyses of axonal projections of anterolateral pathway PNs innervating the PBNL and the inferior olivary complex.
a, Schematic of dual-CTB injections into the PBNL. b, Distribution of CTB-labeled neurons in the spinal cord lamina I+IIo and the LSN. c, Quantification of % of SPB neurons that innervate the PBNL contralaterally, ipsilaterally, or bilaterally. n = 3 mice. Error bars, s.e.m. d, Bottom view of a single axon trace of sparsely labeled Gpr83+ spinal PN that innervate the inferior olivary complex. Arrowhead, an axon branch traveling up to the rostral brain. r, rostral; c, caudal, m, medial; l, lateral. e, Quantification of the number of inferior olivary complex-projecting spinal PNs that exhibit dedicated vs. collateral-forming axons. f, Synaptic terminals of Tacr1+ (h) or Gpr83+ (i) PNs representing hindlimb regions (GFP) and forelimb regions (tdTomato), are segregated in the inferior olivary complex. n = 3 mice each for Tacr1+ and Gpr83+ PNs.
Extended Data Figure 9.
Extended Data Figure 9.. Photostimulation of either Tacr1+ or Gpr83+ SPB neuron axon terminals promotes rostral grooming, and produces distinct behaviors in instrumental conditioning assays.
a, Duration of rostral grooming of control (black line), Gpr83CreERT2; Lbx1FlpO; Rosa26LSL-FSF-ReaChR (green line), or Tacr1CreERT2; Lbx1FlpO; Rosa26LSL-FSF-ReaChR (red line) mice over time. Bin size, 30 seconds. Axon terminals in the PBNL were stimulated with blue LED (473 nm, 1 mW, 10 Hz, 10 ms pulse width) for 30 seconds 4 times (1 minute light-off periods between photostimulation periods). b, Quantification of average duration of rostral grooming during light-on periods for 0.4 mW, 1 mW, and 6.5 mW photostimulation. One-way ANOVA (Dunnett’s multiple comparisons test); F[2, 18] = 7.60 (1 mW), F[2, 16] = 7.49 (6.5 mW); n = 6, 6, 9 mice (0.4 mW), 6, 7, 9 mice (1 mW), 8, 5, 6 mice (6.5 mW) for control, Gpr83, Tacr1, respectively. c, Schematic of lumbar injections of AAV1-hSyn-FlpO viruses. d, Quantification of total duration of grooming of different body parts during light-on periods. Axon terminals in the PBNL were stimulated with blue LED (473 nm, 10 mW, 5 or 10 Hz, 10 ms pulse width) 4 times for 1 minute each (1 minute light-off periods between photostimulation periods). n = 4 trials (2 mice; 2 trials per mouse, 5Hz and 10 Hz stimulation) for Tacr1+ SPB neuron terminal stimulation, n = 6 trials (3 mice; 2 trials per mouse, 5Hz and 10 Hz stimulation) for Gpr83+ SPB neuron terminal stimulation. Paired t-test (two-tailed). e, Weak self-administered photostimulation (0.4 mW) of Gpr83+ SPB neuron terminals led to an increase in the number of presses for the active lever, but not the inactive lever over time. f, Self-administered photostimulation (1 mW) of Tacr1+ SPB neurons led to a decrease in the number of presses for the active lever, but not inactive lever over time. Turquoise boxes indicate 8 days of light-on sessions. n = 7 mice (Gpr83, 0.4 mW; Tacr1, 1 mW). Two-way repeated measures ANOVA; F[1, 6] = 8.23 (Gpr83, 0.4 mW), F[1, 6] = 9.43 (Tacr1, 1 mW). Error bars, s.e.m.
Extended Data Figure 10.
Extended Data Figure 10.. Summary of two parallel ascending SPB pathways and a phylogenetic tree of structurally-related GPCR family proteins.
a, Summary cartoon of two parallel ascending SPB pathways for affective touch and pain. b, A phylogenetic tree generated using a multiple sequence alignment algorithm, ClustalW2 (EMBL-EBI). The top 14 mouse proteins that have the highest amino acid sequence similarity to mouse GPR83 were used for this analysis.
Figure 1.
Figure 1.. Tacr1- and Gpr83-expressing spinal PNs are largely distinct neuronal populations that innervate multiple distinct but overlapping brain regions.
a, Distribution of Tacr1+ neurons in the spinal cord dorsal horn. IIo, outer lamina II; IIid, inner dorsal lamina II; LSN, lateral spinal nucleus. b, Distribution of GFP-expressing Gpr83+ neurons in the spinal cord dorsal horn (left). A subset of SPB neurons labeled with CTB555 injected into the PBNL are GFP-positive (right). Arrow heads, double-positive neurons. c-d, Axonal projections of Tacr1+ or Gpr83+ spinal PNs. PVT, paraventricular nucleus; CM, central medial nucleus; MD, mediodorsal nucleus; PO, posterior complex; VPM, ventral posteromedial nucleus; MG(d)(v)(m), medial geniculate complex (dorsal)(ventral)(medial); SPFp, parvocellular subparafascicular nucleus; SCP, superior cerebellar peduncle. e, Quantification of the average fluorescence intensity of tdTomato-expressing Tacr1+ and Gpr83+ spinal PN axons in the major brain targets. n = 3 mice. Error bars, s.e.m. f, Schematic of virus injections for retrograde labeling of Tacr1+ spinal PNs. g, Distribution of tdTomato-expressing Tacr1+ spinal PNs and GFP-expressing Gpr83+ neurons in the spinal cord dorsal horn. Arrowheads, double-positive neurons. h, Quantification of co-expression of tdTomato and GFP. n = number of mice (indicated in the bar graphs).
Figure 2.
Figure 2.. Axons of Tacr1- and Gpr83-expressing SPB neurons terminate in a zonally-segregated manner within the PBNL and their strong activation produces distinct escape behaviors and autonomic responses.
a, Distribution of synaptic terminals originating from the spinal cord. n = 2 mice. b, Schematic of virus injections. c, Distribution of synaptic terminals of Tacr1+ and Gpr83+ SPB neurons in the PBNL. d, Quantification. n = 5, 4 mice for Tacr1+, Gpr83+ SPB neurons, respectively. e, Top, schematic of optogenetic stimulation of SPB axonal terminals. Bottom, representative PBNL images for fiberoptic implant sites. n = 5, 8 mice for Tacr1+, Gpr83+, respectively. f, Distribution of Fos+ neurons in the PBNL following high-power (6.5 mW) photostimulation. g, Quantification of the number of Fos+ neurons in different PBNL subnuclei. One-way ANOVA (Dunnett’s multiple comparisons test); F[2, 8] = 11.70 (PBNCL), F[2, 8] = 8.58 (PBNIL), F[2, 8] = 21.21 (PBNDL), F[2, 8] = 63.00 (PBNEL); n = 4, 4, 3 mice for control, Tacr1, and Gpr83, respectively. h, Speed of movement over time. Turquoise bars, 30-second-long light-on periods (473 nm, 6.5 mW, 5 Hz, 10 ms pulse width). Shaded areas, s.e.m. i, j, Quantifications of average speed (i) and number of jumps (j) during light-on (6.5 mW) periods. One-way ANOVA (Dunnett’s multiple comparisons test); F[2, 16] = 21.32 (5 Hz), F[2, 16] = 31.05 (10 Hz) (i); F[2, 16] = 6.53 (10 Hz) (j); n = 8, 6, 5 mice for control, Tacr1, and Gpr83, respectively. k, l, Quantification of average speed (n) or number of jumps (o) during light-on (10 Hz) periods following NBQX (or saline) pre-infusion into the PBNL. Paired t-test (two-tailed). m, Relative change in pupil diameter over time (ΔD/D, see methods for calculation). Inset, representative pupil images during baseline (top) and light-on (bottom) periods. Turquoise bars, 10-second-long light-on periods (473 nm, 2 mW, 10 Hz, 10 ms pulse width). Shaded areas, s.d. Note that abrupt downward lines in the shaded regions reflects blinking/squinting. n-p, Quantifications of peak amplitude (n), area under curve (o), and number of blinks/squints (p). One-way ANOVA (Tukey’s multiple comparisons test); F[2, 15] = 30.44 (peak amplitude), F[2, 15] = 21.11 (area under curve), F[2, 17] = 7.412 (blinks/squints); n = 6, 7, 5 mice for control, Tacr1, Gpr83, respectively. Error bars, s.e.m.
Figure 3.
Figure 3.. Tacr1- and Gpr83-expressing SPB neurons exhibit different responses to cutaneous stimuli, which is explained by their distinct synaptic inputs from primary sensory neuron subtypes.
a, Schematic of whole-cell patch clamp recordings from Tacr1+ and Gpr83+ SPB neurons using an ex vivo skin-spinal cord preparation. b, c, Representative traces of action potential (AP) firing evoked by von Frey filament indentations (b) and saline application with different temperatures (c). Underbars, time when stimuli were applied to the skin. d, Summary radar plots. e-g, Quantifications of peak instantaneous firing rates following application of mechanical (e) and temperature (innocuous (f) and noxious (g)) stimuli. Mann-Whitney test (two-tailed) (comparison for individual stimuli); Two-way ANOVA (comparison for different groups of stimuli), F[1, 29] = 9.77 (e), F[1, 57] = 4.41 (f); n = 16, 15 neurons for Tacr1+, Gpr83+, respectively. h, Schematic of whole-cell patch clamp recordings from Tacr1+ and Gpr83+ SPB neurons using a spinal cord slice preparation. The genetic labeling strategies are described in the methods. i, Representative images of tdTomato-expressing Tacr1+ and Gpr83+ SPB neurons in acute spinal cord slices. n = 39, 35 neurons for Tacr1+, Gpr83+, respectively. j, l, n, Representative traces of light-activated currents (left) and AP firing (right) upon photostimulation of CGRP+ (j), Mrgprb4+ (l), and Ntrk2+ (n) primary afferent terminals. The light-activated EPSCs were abolished in the presence of tetrodotoxin (TTX) and reinstated in the presence of 4-aminopyridine (4-AP) in addition to TTX, indicating the monosynaptic nature of the synaptic connections. Turquoise bars, 0.1 ms (EPSCs) and 1 ms (APs) LED (473 nm) stimulations. k, m, o, Quantifications of peak current density. Mann-Whitney test (two-tailed); n = number of neurons. Error bars, s.e.m.
Figure 4.
Figure 4.. Tacr1- and Gpr83-expressing SPB neurons form dedicated, bilateral, non-somatotopically organized synaptic inputs to the PBNL.
a, c, Schematics of unilateral lumbar injections of AAV viruses for whole-mount AP staining. b, Top view of whole-mount AP-stained axonal projections of densely labeled Tacr1+ and Gpr83+ spinal PNs. d, Single axon traces of sparsely labeled Tacr1+ and Gpr83+ SPB neurons. r, rostral; c, caudal, d, dorsal; v, ventral. e, f, Quantifications of the numbers of SPB neurons that exhibit dedicated vs. collateral-forming axons (e) and SPB neurons that innervate the PBNL contralaterally, ipsilaterally, or bilaterally (f). g, Schematic of virus injections. h, i, Synaptic terminals of Tacr1+ (h) or Gpr83+ (i) SPB neurons representing hindlimb regions (GFP), thoracic body regions (BFP), and forelimb regions (tdTomato), are intermingled within their respective PBNL target subnuclei. n = 3 mice each for Tacr1+ and Gpr83+ SPB neurons.
Figure 5.
Figure 5.. Activation of Tacr1- and Gpr83-expressing SPB neurons induces distinct affective behaviors in a stimulus intensity-dependent manner.
a, Schematic of the optogenetic stimulation-coupled real-time place preference assay. b, c, Quantifications of % of time spent in stimulated side for 6.5 mW (b) and 1 mW (c) photostimulations (10 Hz, 10 ms pulse width). One-way repeated measures ANOVA (Dunnett’s multiple comparisons test); F[1.626, 8.131] = 19.10 (Tacr1), F[1.580, 7.901] = 14.41 (Gpr83) (b); F[1.903, 13.32] = 7.20 (Tacr1), F[1.817, 12.72] = 8.42 (Gpr83) (c); n = number of mice. d, Schematic of the optogenetic stimulation-coupled lever-pressing assay. Mice received 5 second-long photostimulation (473 nm, 10 Hz, 10 ms pulse width) upon pressing an active lever. e, f, Fold changes of number of lever press are plotted over sessions. Turquoise boxes, 8 days of light-on sessions. n = 7 (control, 0.4 mW; Tacr1, 0.4 mW; Gpr83, 0.4 mW; Tacr1, 1 mW), n = 6 (control, 1 mW), n = 8 mice (Gpr83, 1 mW). Two-way repeated measures ANOVA; F[1, 12] = 5.26 (0.4 mW), F[1, 12] = 5.22 (1 mW) (e); F[1, 12] = 2.50 (0.4 mW), F[1, 11] = 10.14 (1 mW). g, Distribution of Fos+ neurons in the PBNEL following photostimulation of Gpr83+ SPB axon terminals. h-j, Quantifications of the number of Fos+ neurons in different PBNL subnuclei (h), % of CGRP+ neurons that are Fos+ (i), and % of Fos+ neurons that are CGRP+ (j). One-way ANOVA (Tukey’s multiple comparisons test); F[2, 8] = 7.41 (PBNIL), F[2, 8] = 22.03 (PBNDL), F[2, 8] = 64.36 (PBNEL); F[2, 8] = 74.94 (i); n = 4, 4, 3 mice for control, 0.4 mW, and 6.5 mW, respectively. Error bars, s.e.m.

References

    1. Abraira VE & Ginty DD The sensory neurons of touch. Neuron 79, 618–639, doi:10.1016/j.neuron.2013.07.051 (2013). - DOI - PMC - PubMed
    1. Basbaum AI, Bautista DM, Scherrer G & Julius D Cellular and molecular mechanisms of pain. Cell 139, 267–284, doi:10.1016/j.cell.2009.09.028 (2009). - DOI - PMC - PubMed
    1. Todd AJ Neuronal circuitry for pain processing in the dorsal horn. Nature reviews. Neuroscience 11, 823–836, doi:10.1038/nrn2947 (2010). - DOI - PMC - PubMed
    1. Wercberger R & Basbaum AI Spinal cord projection neurons: a superficial, and also deep analysis. Current Opinion in Physiology 11, 109–115 (2019). - PMC - PubMed
    1. Owens DM & Lumpkin EA Diversification and specialization of touch receptors in skin. Cold Spring Harb Perspect Med 4, doi:10.1101/cshperspect.a013656 (2014). - DOI - PMC - PubMed

Publication types

Substances