. 2020 Nov;587(7834):477-482.
doi: 10.1038/s41586-020-2864-x. Epub 2020 Oct 28.

Single-cell mutation analysis of clonal evolution in myeloid malignancies

Affiliations

Single-cell mutation analysis of clonal evolution in myeloid malignancies

Linde A Miles et al. Nature. 2020 Nov.

Abstract

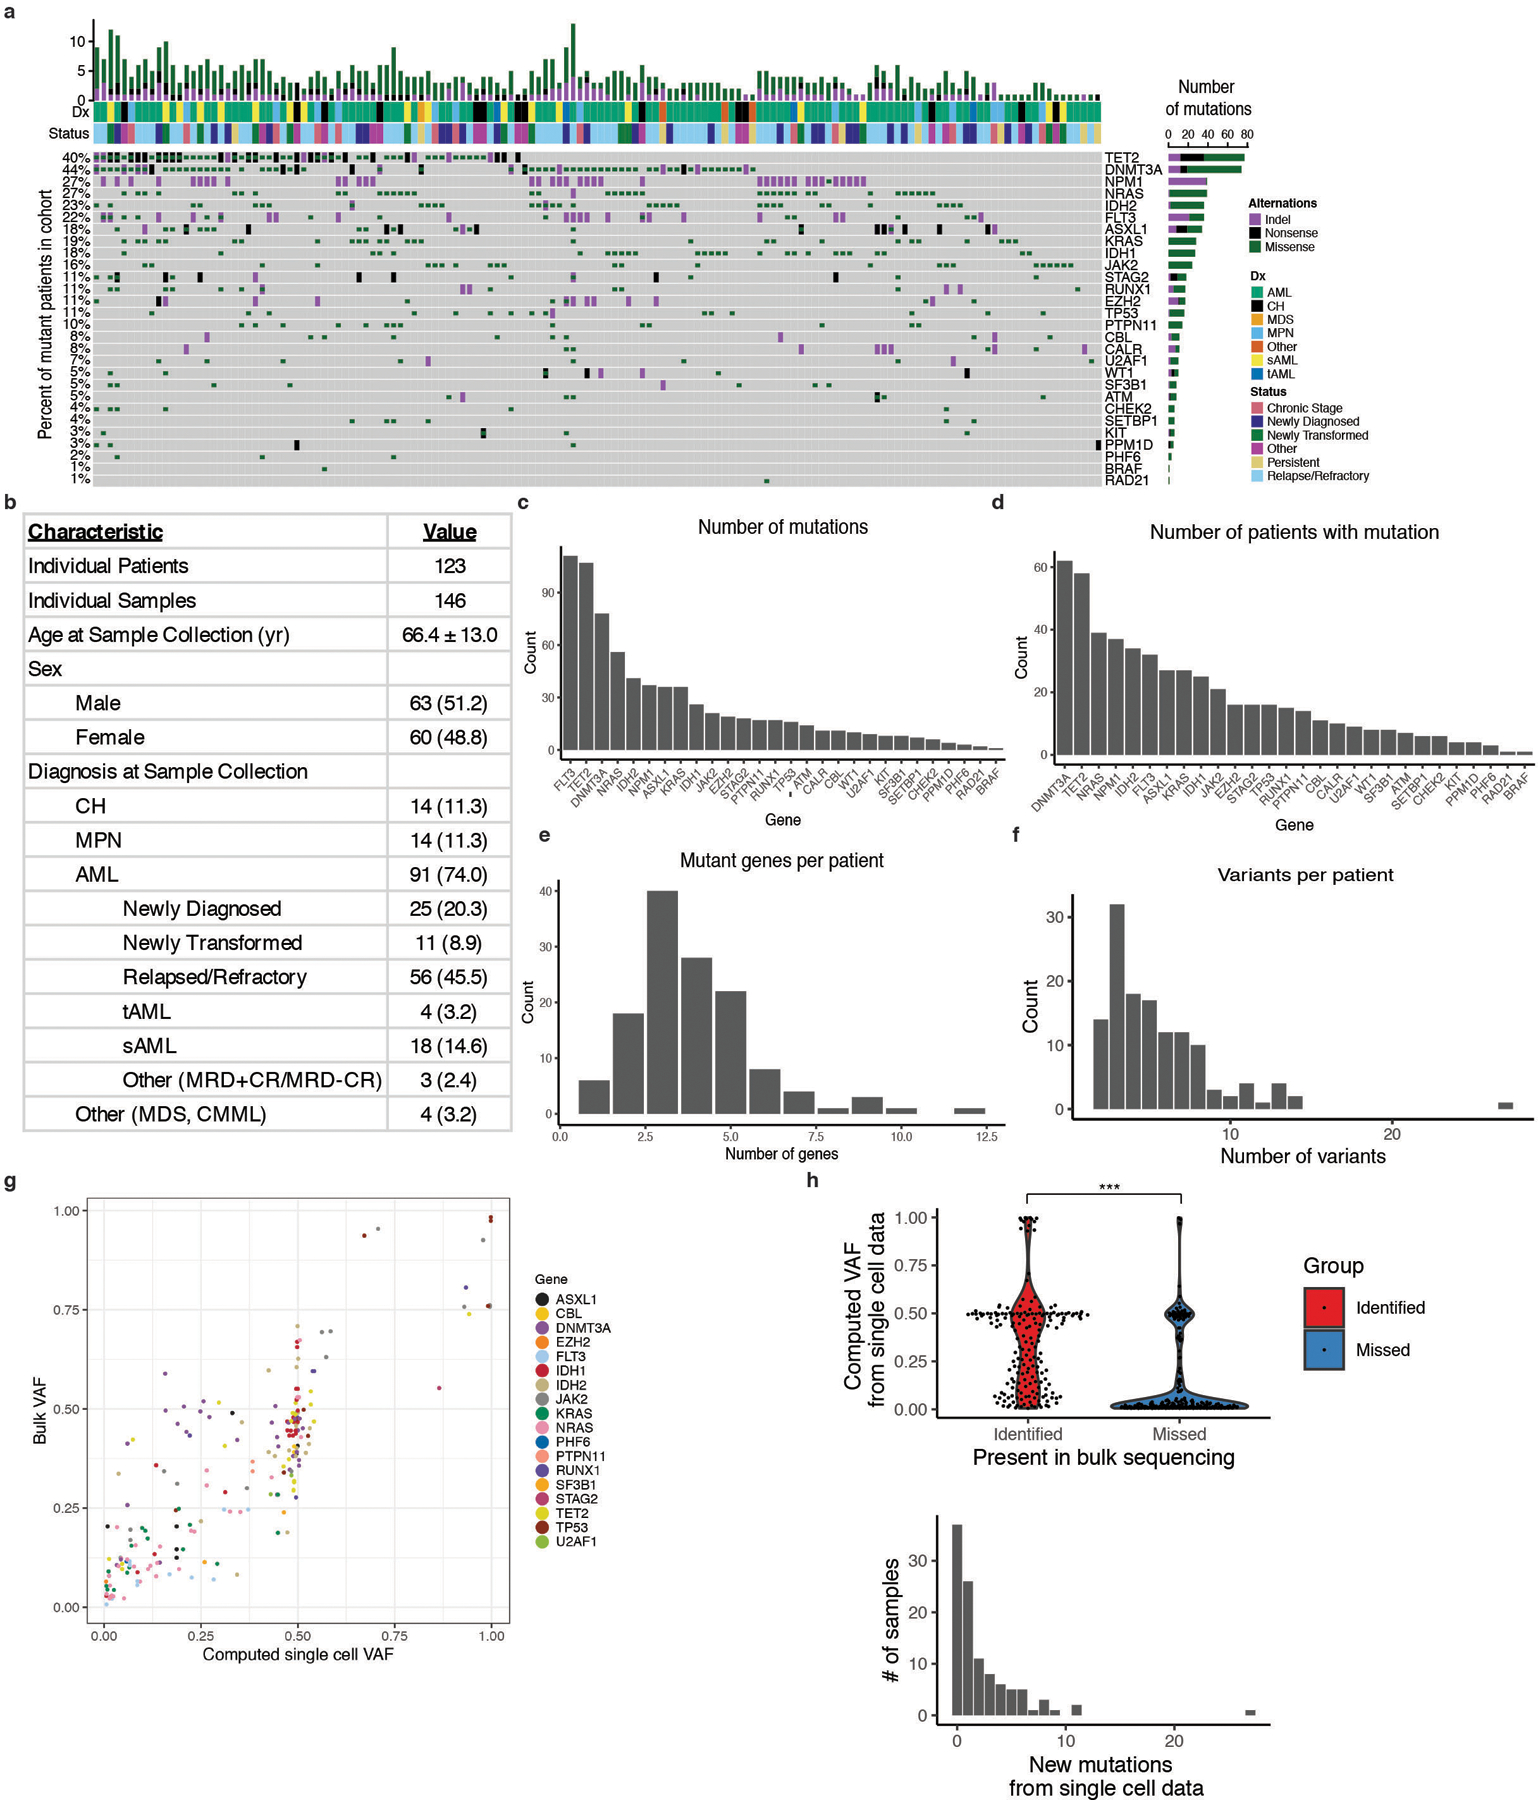
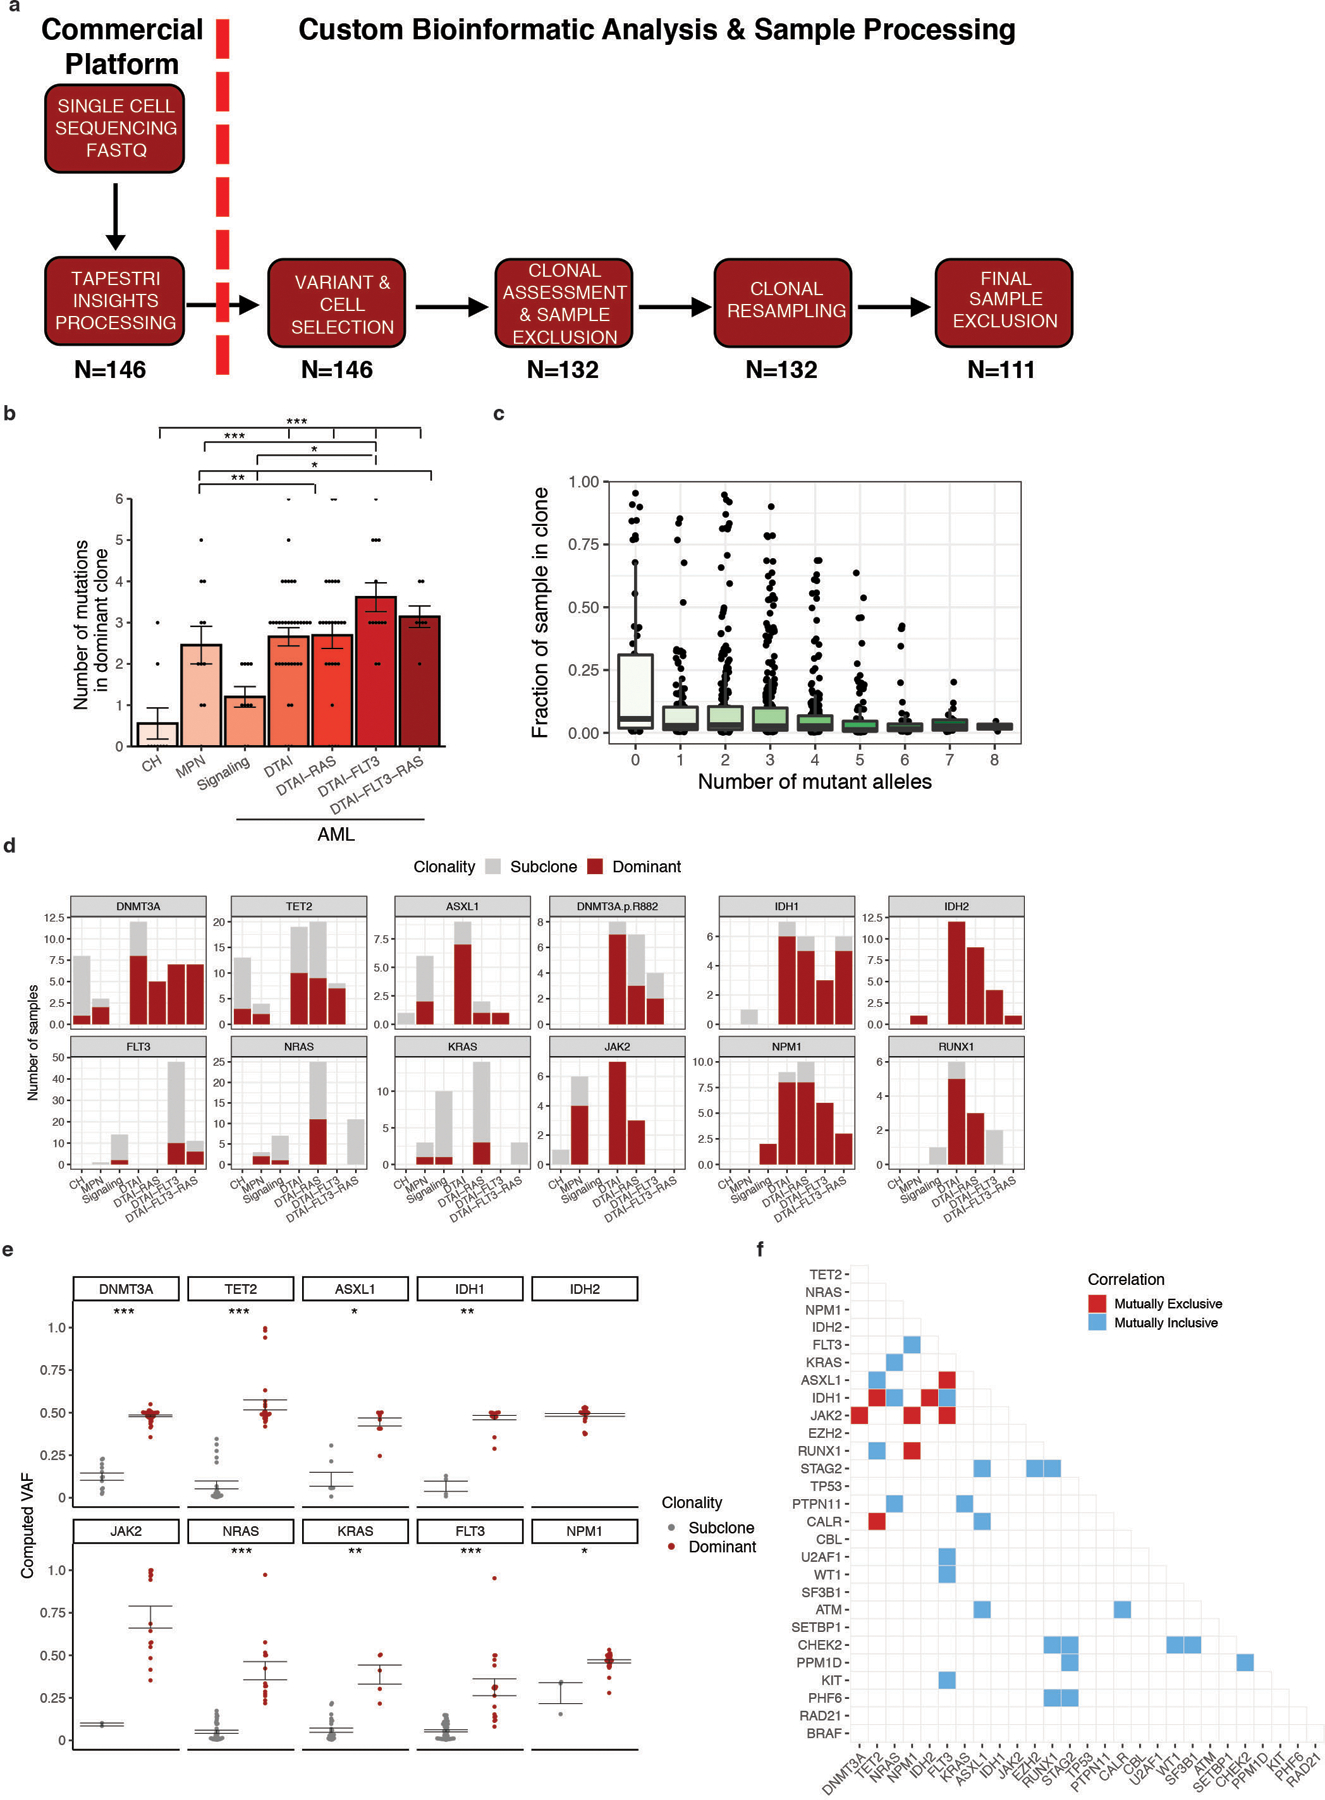
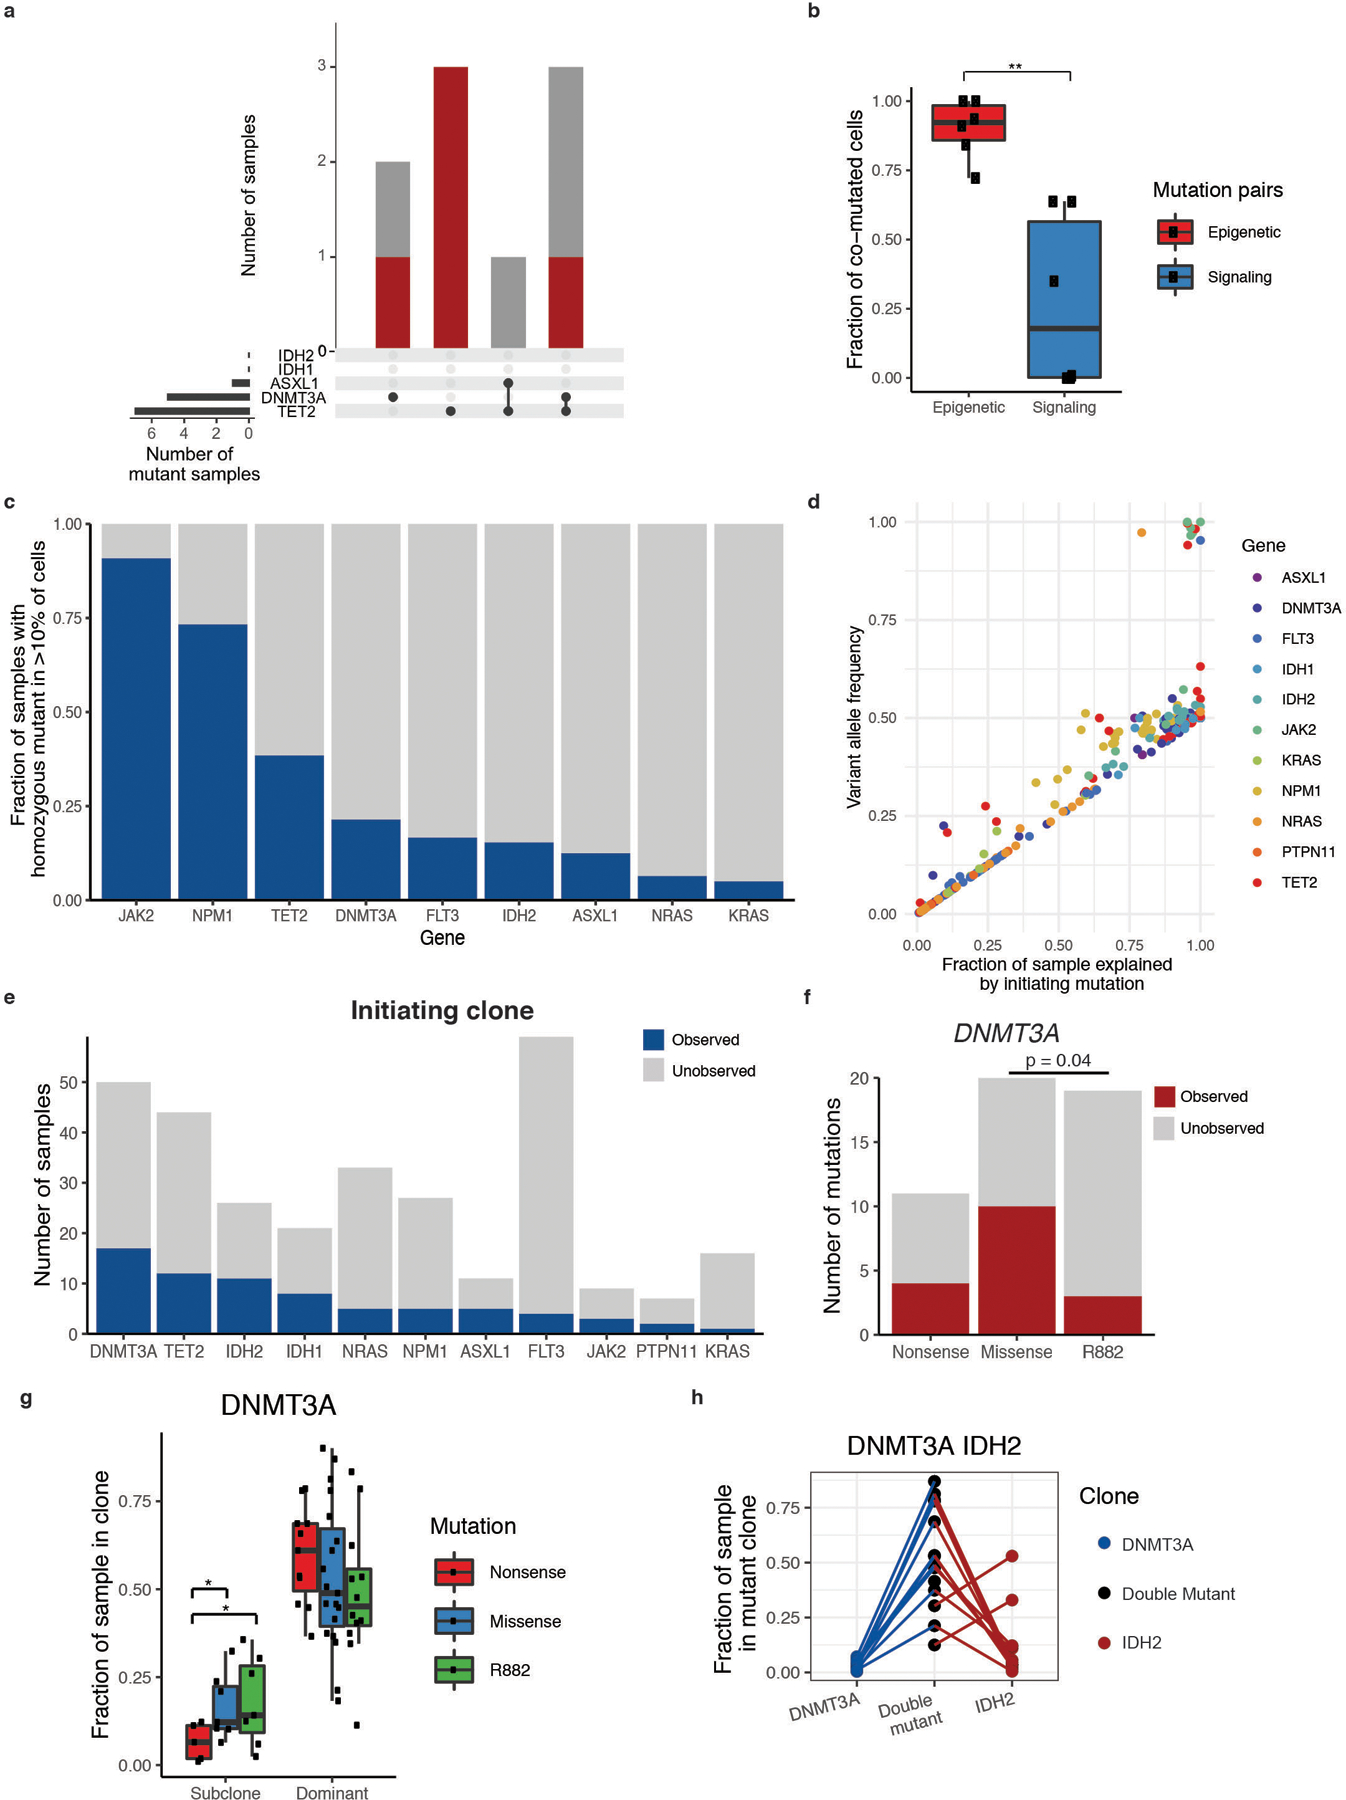
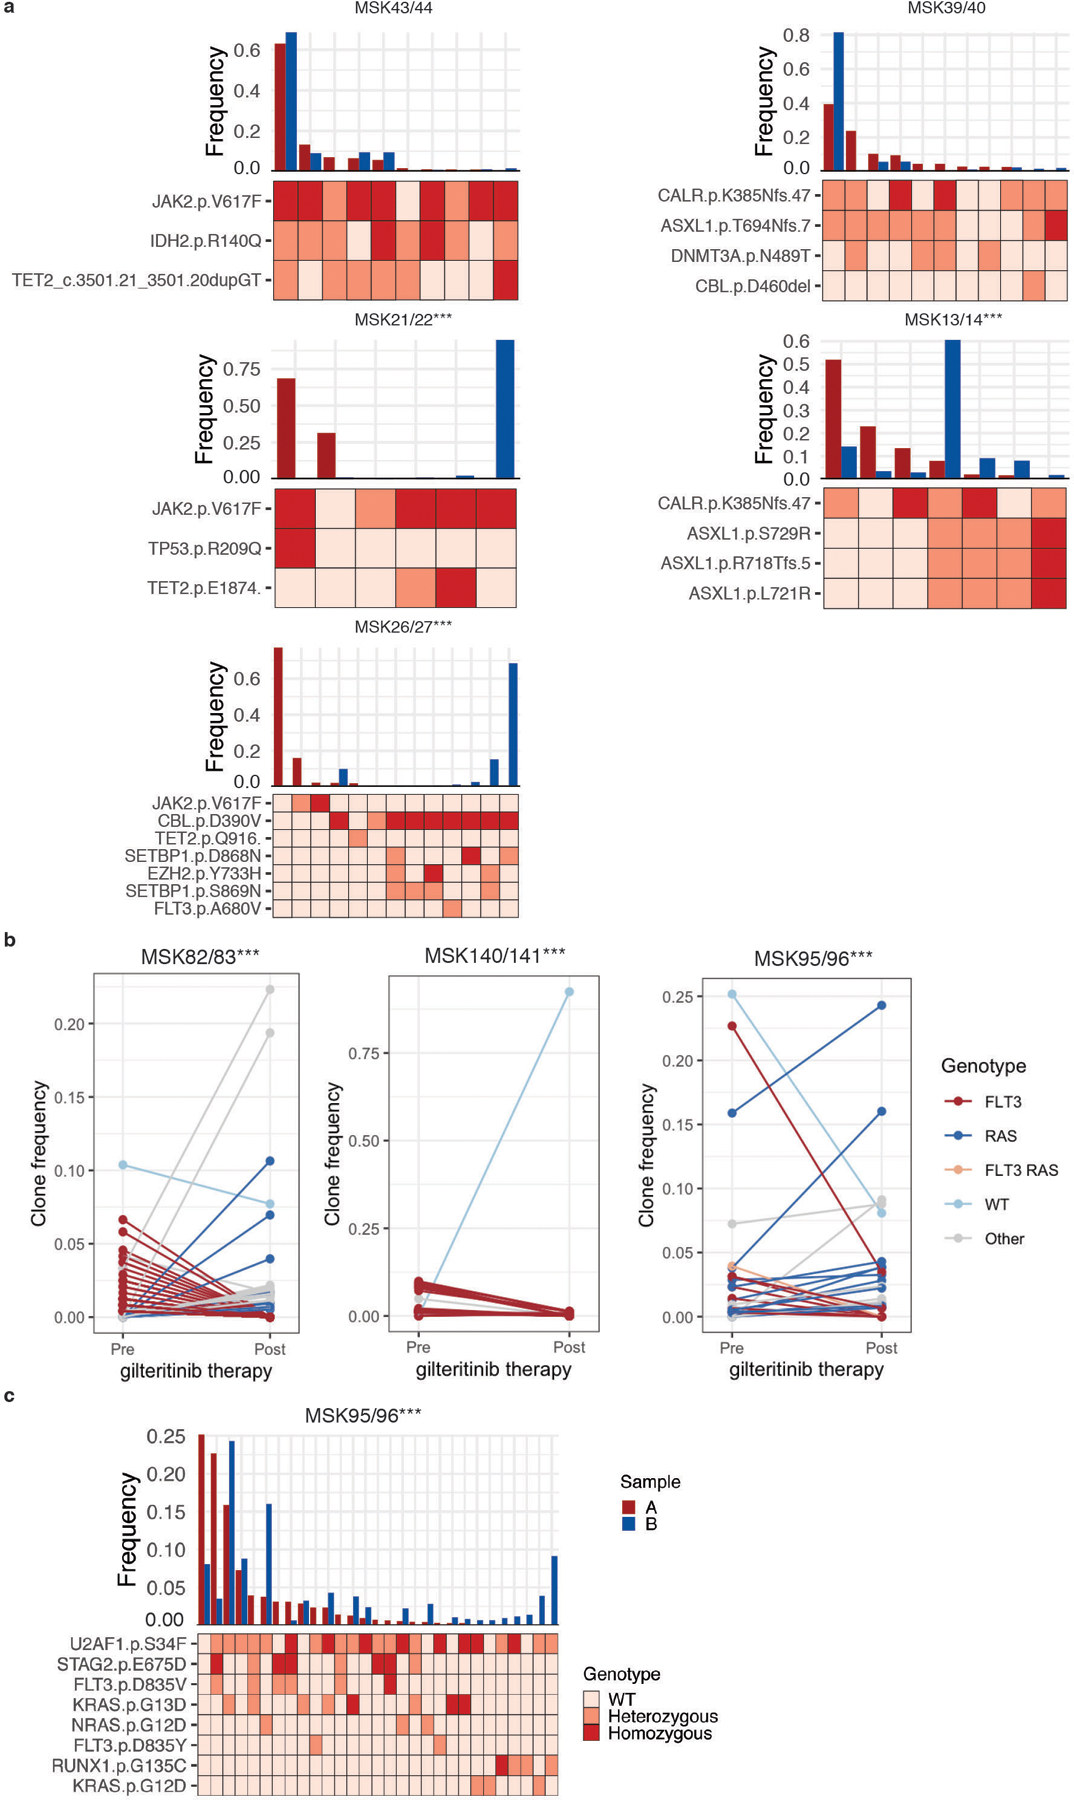
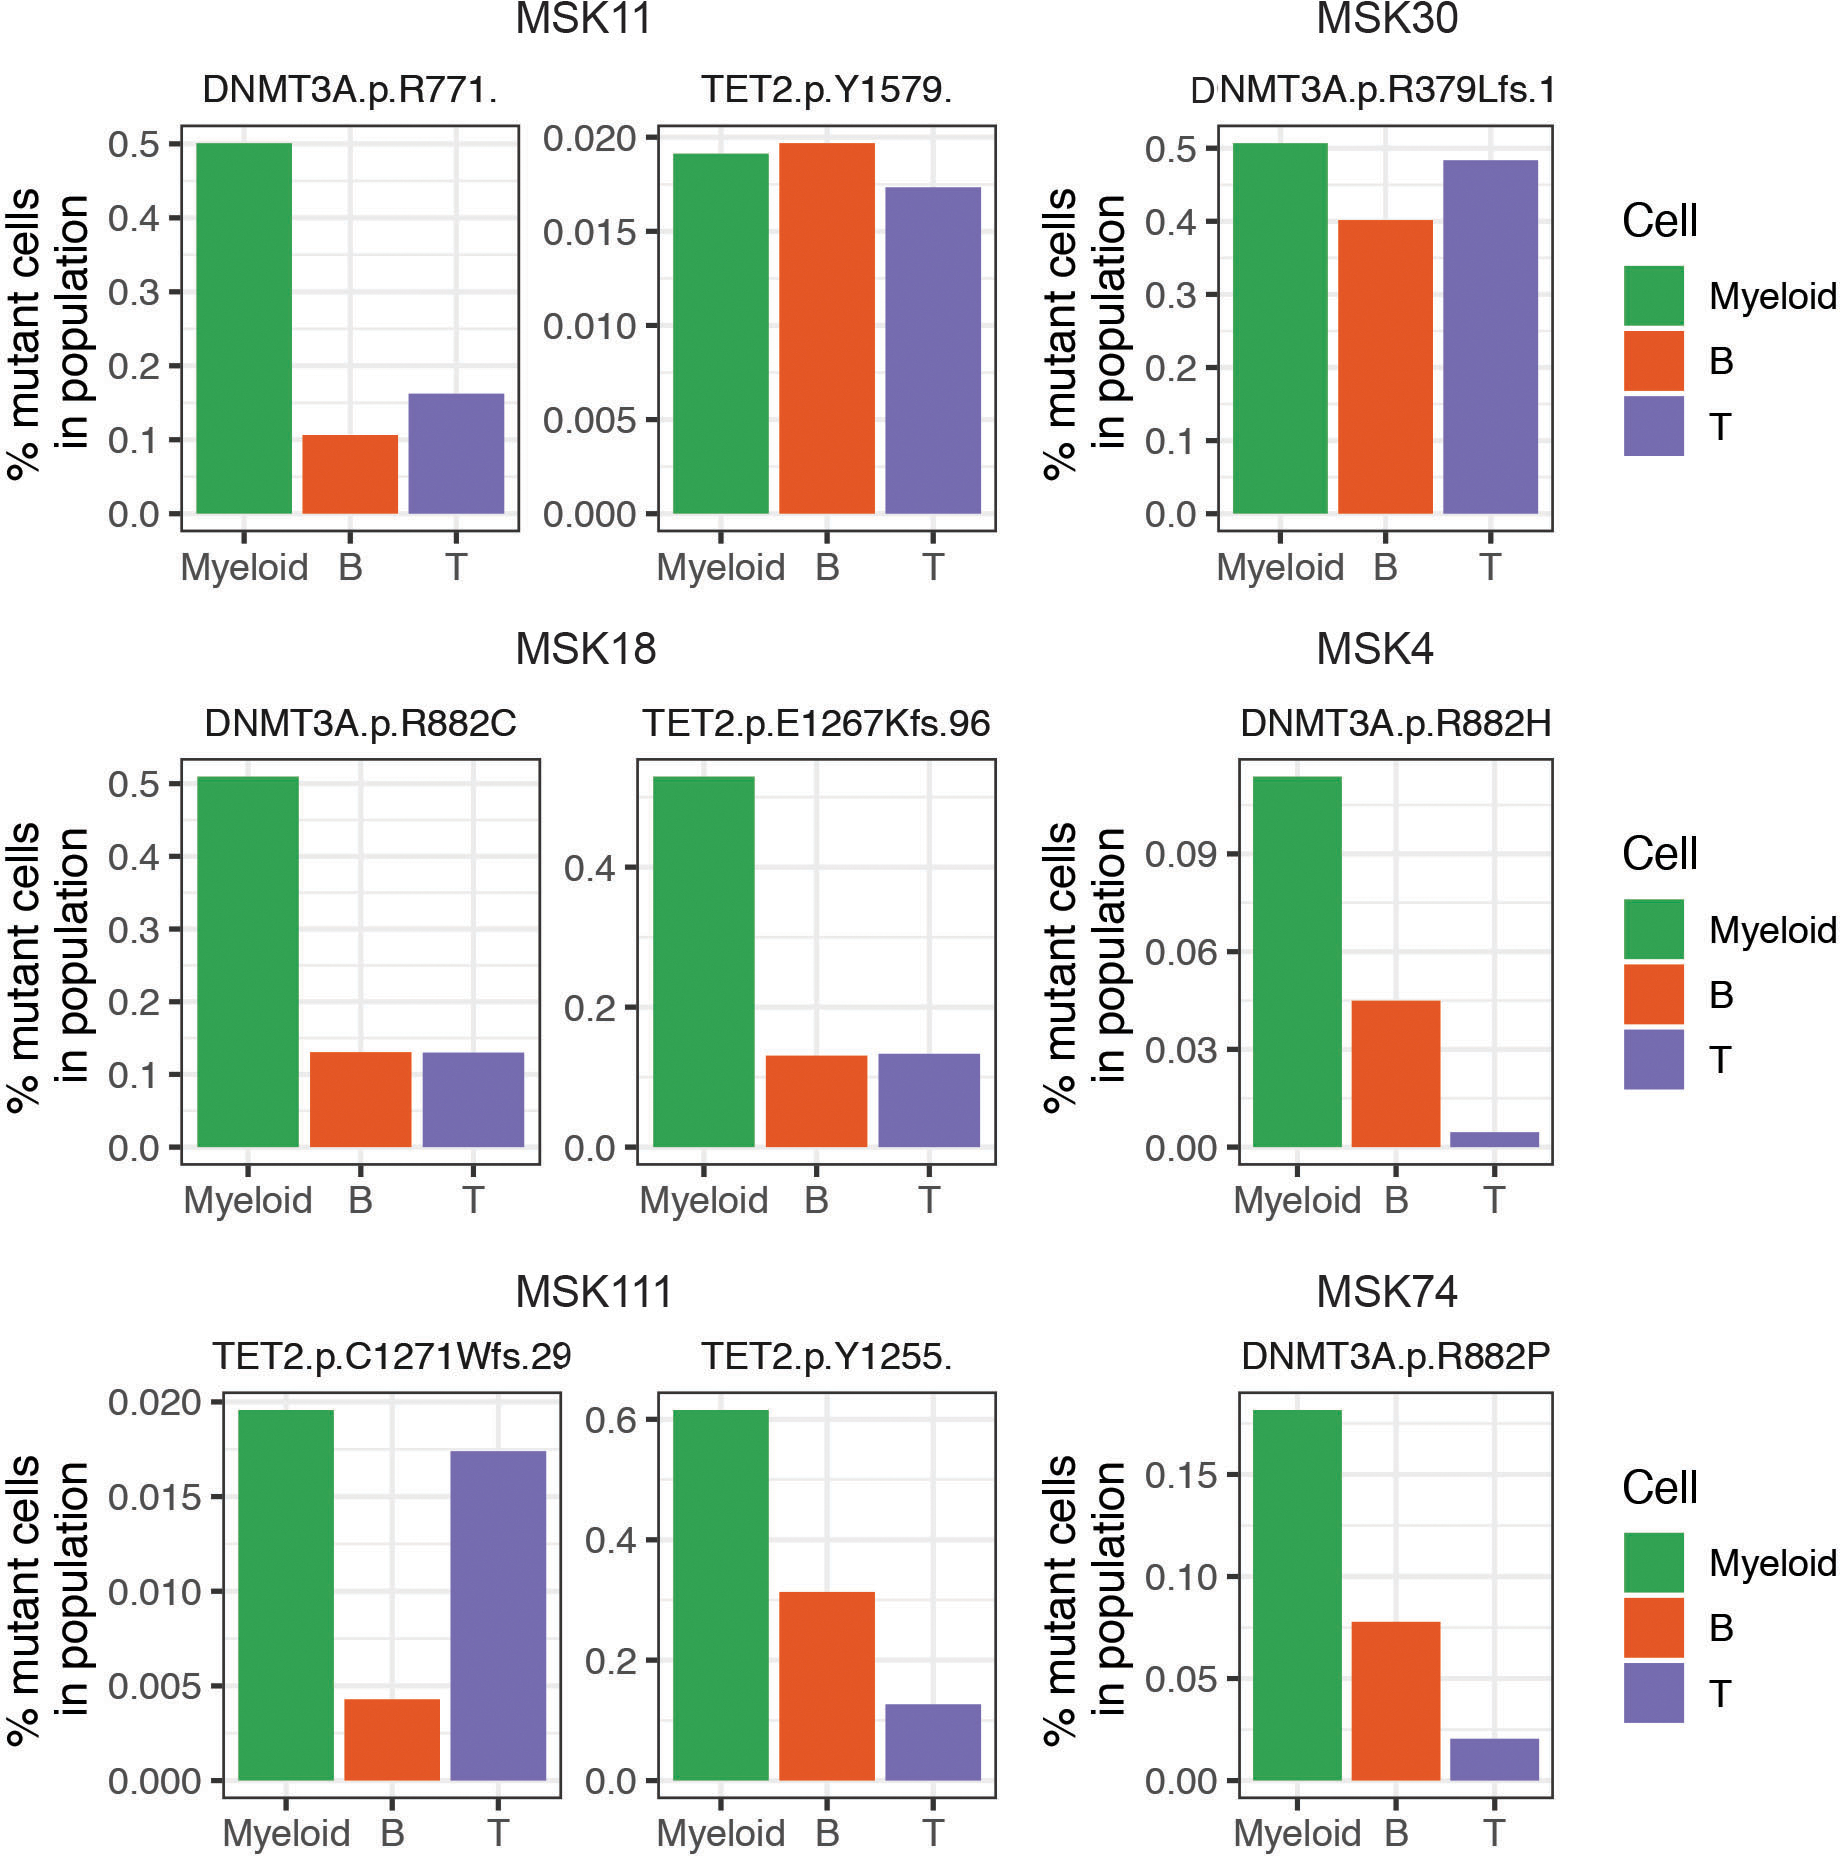
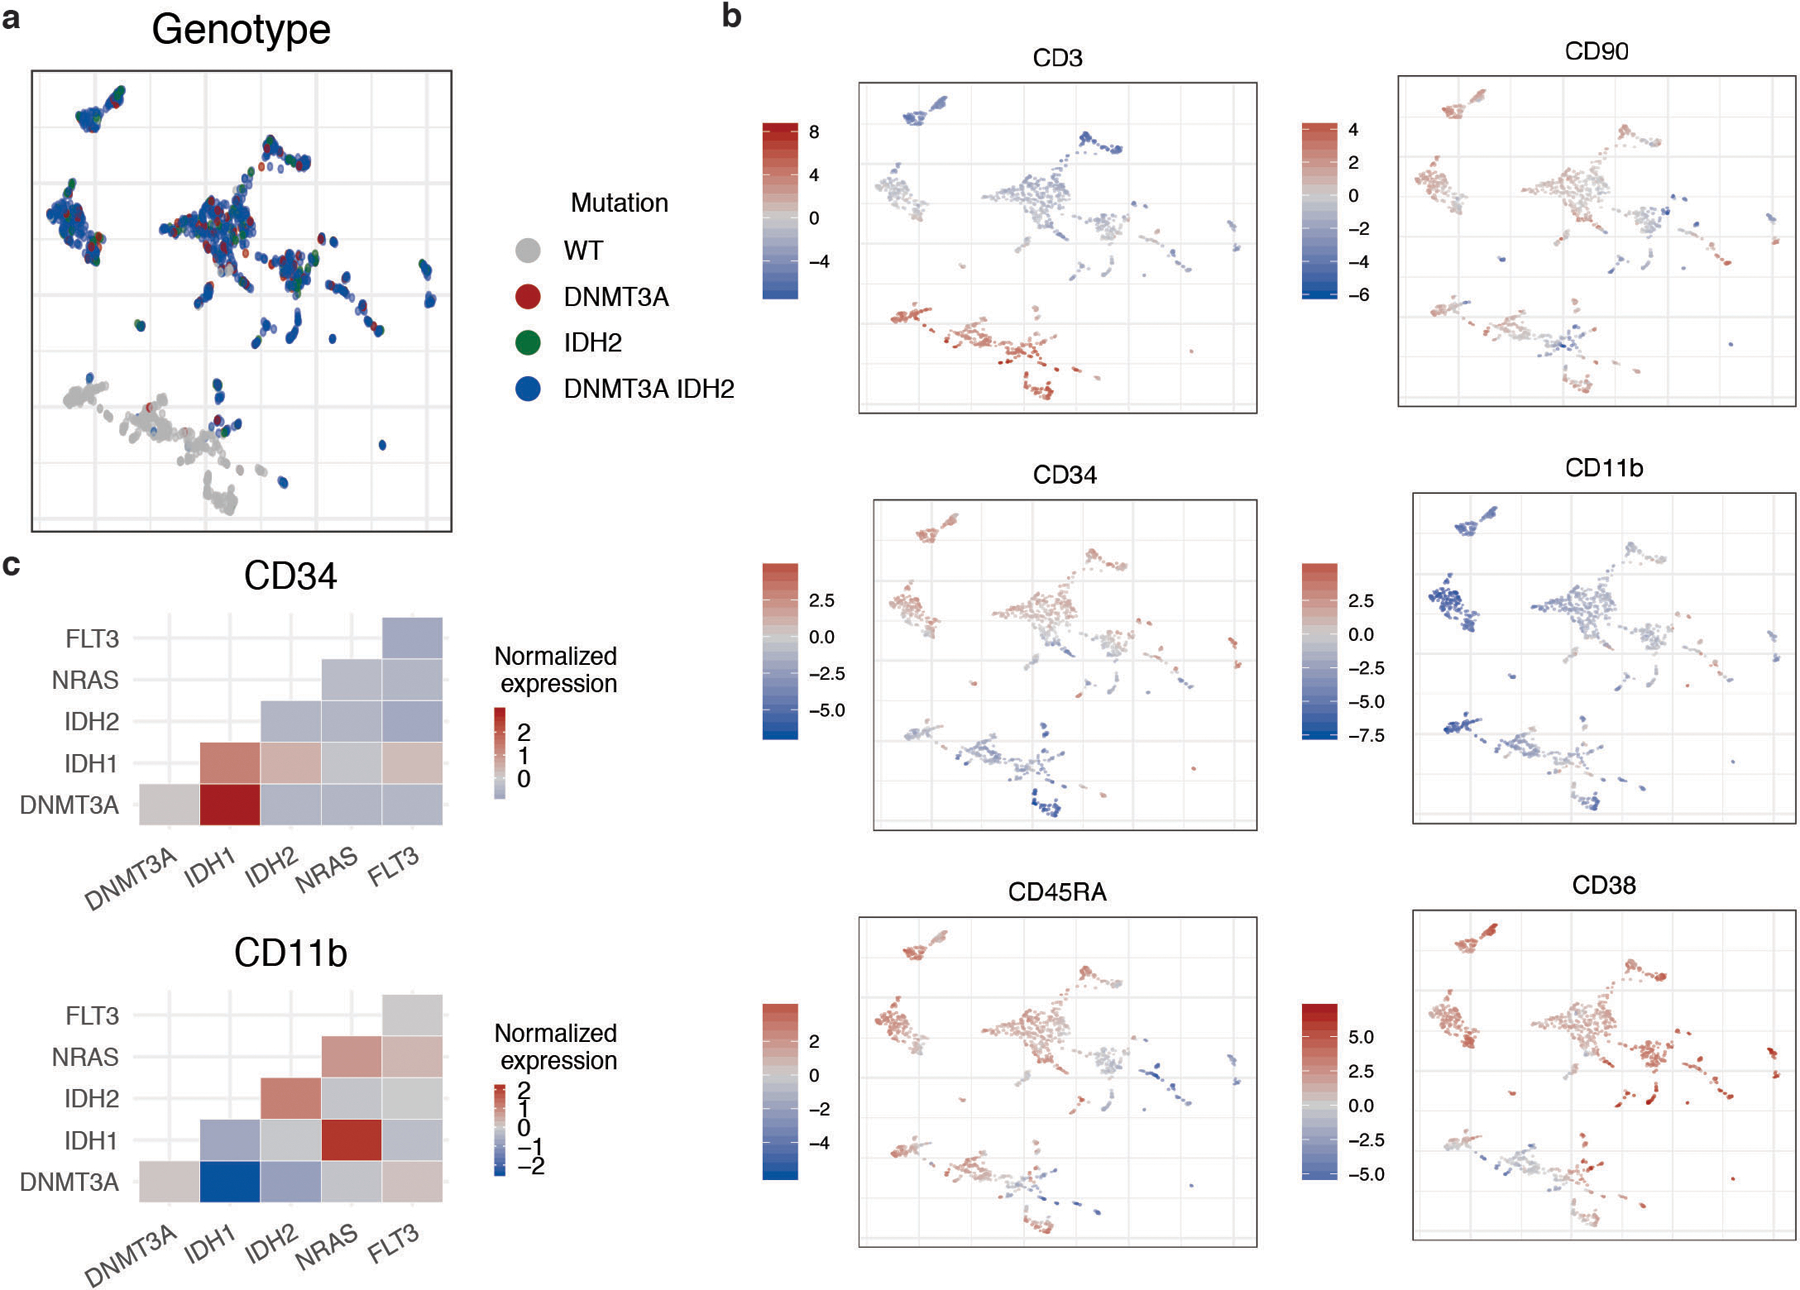
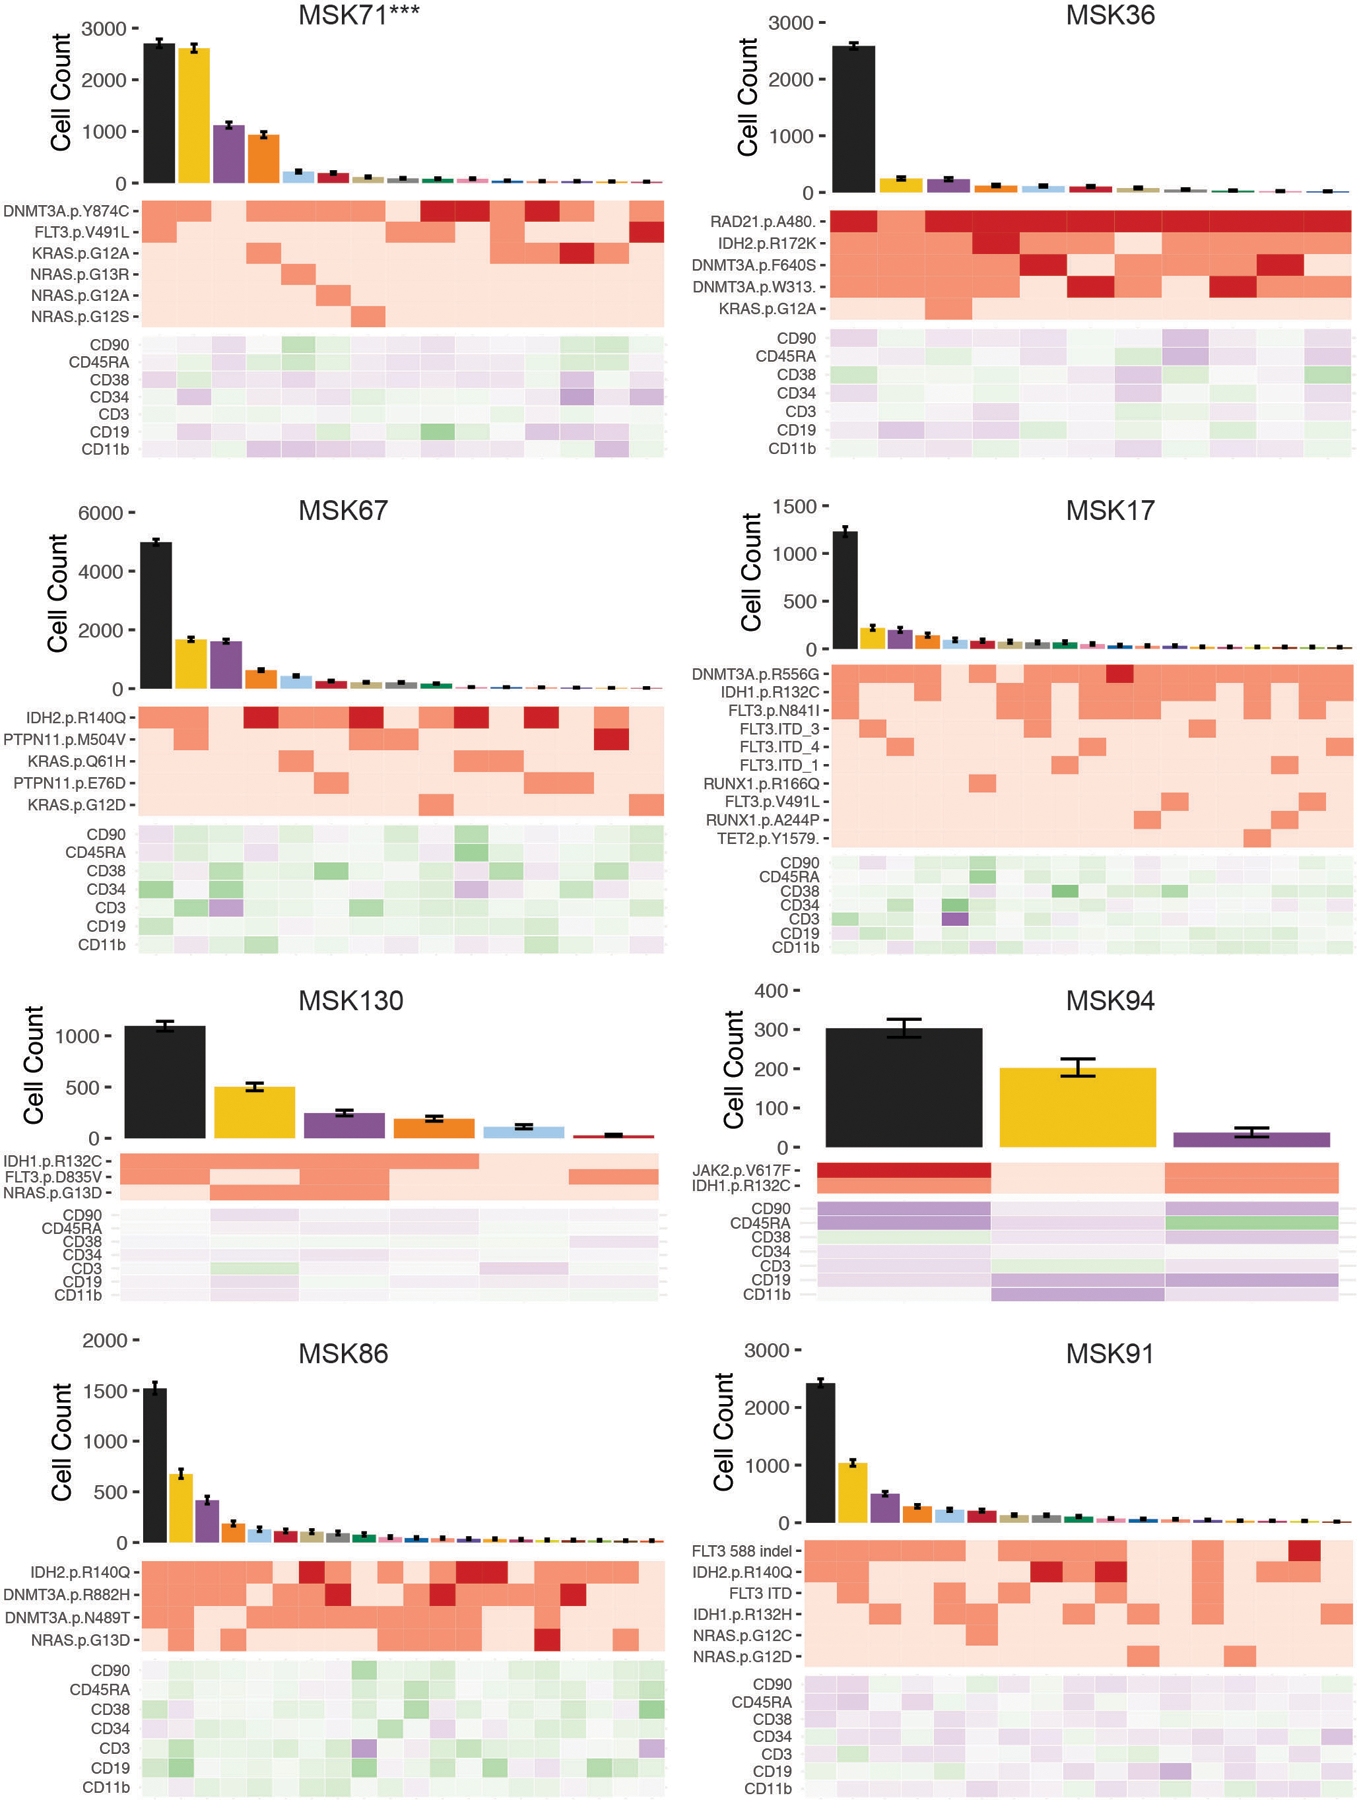
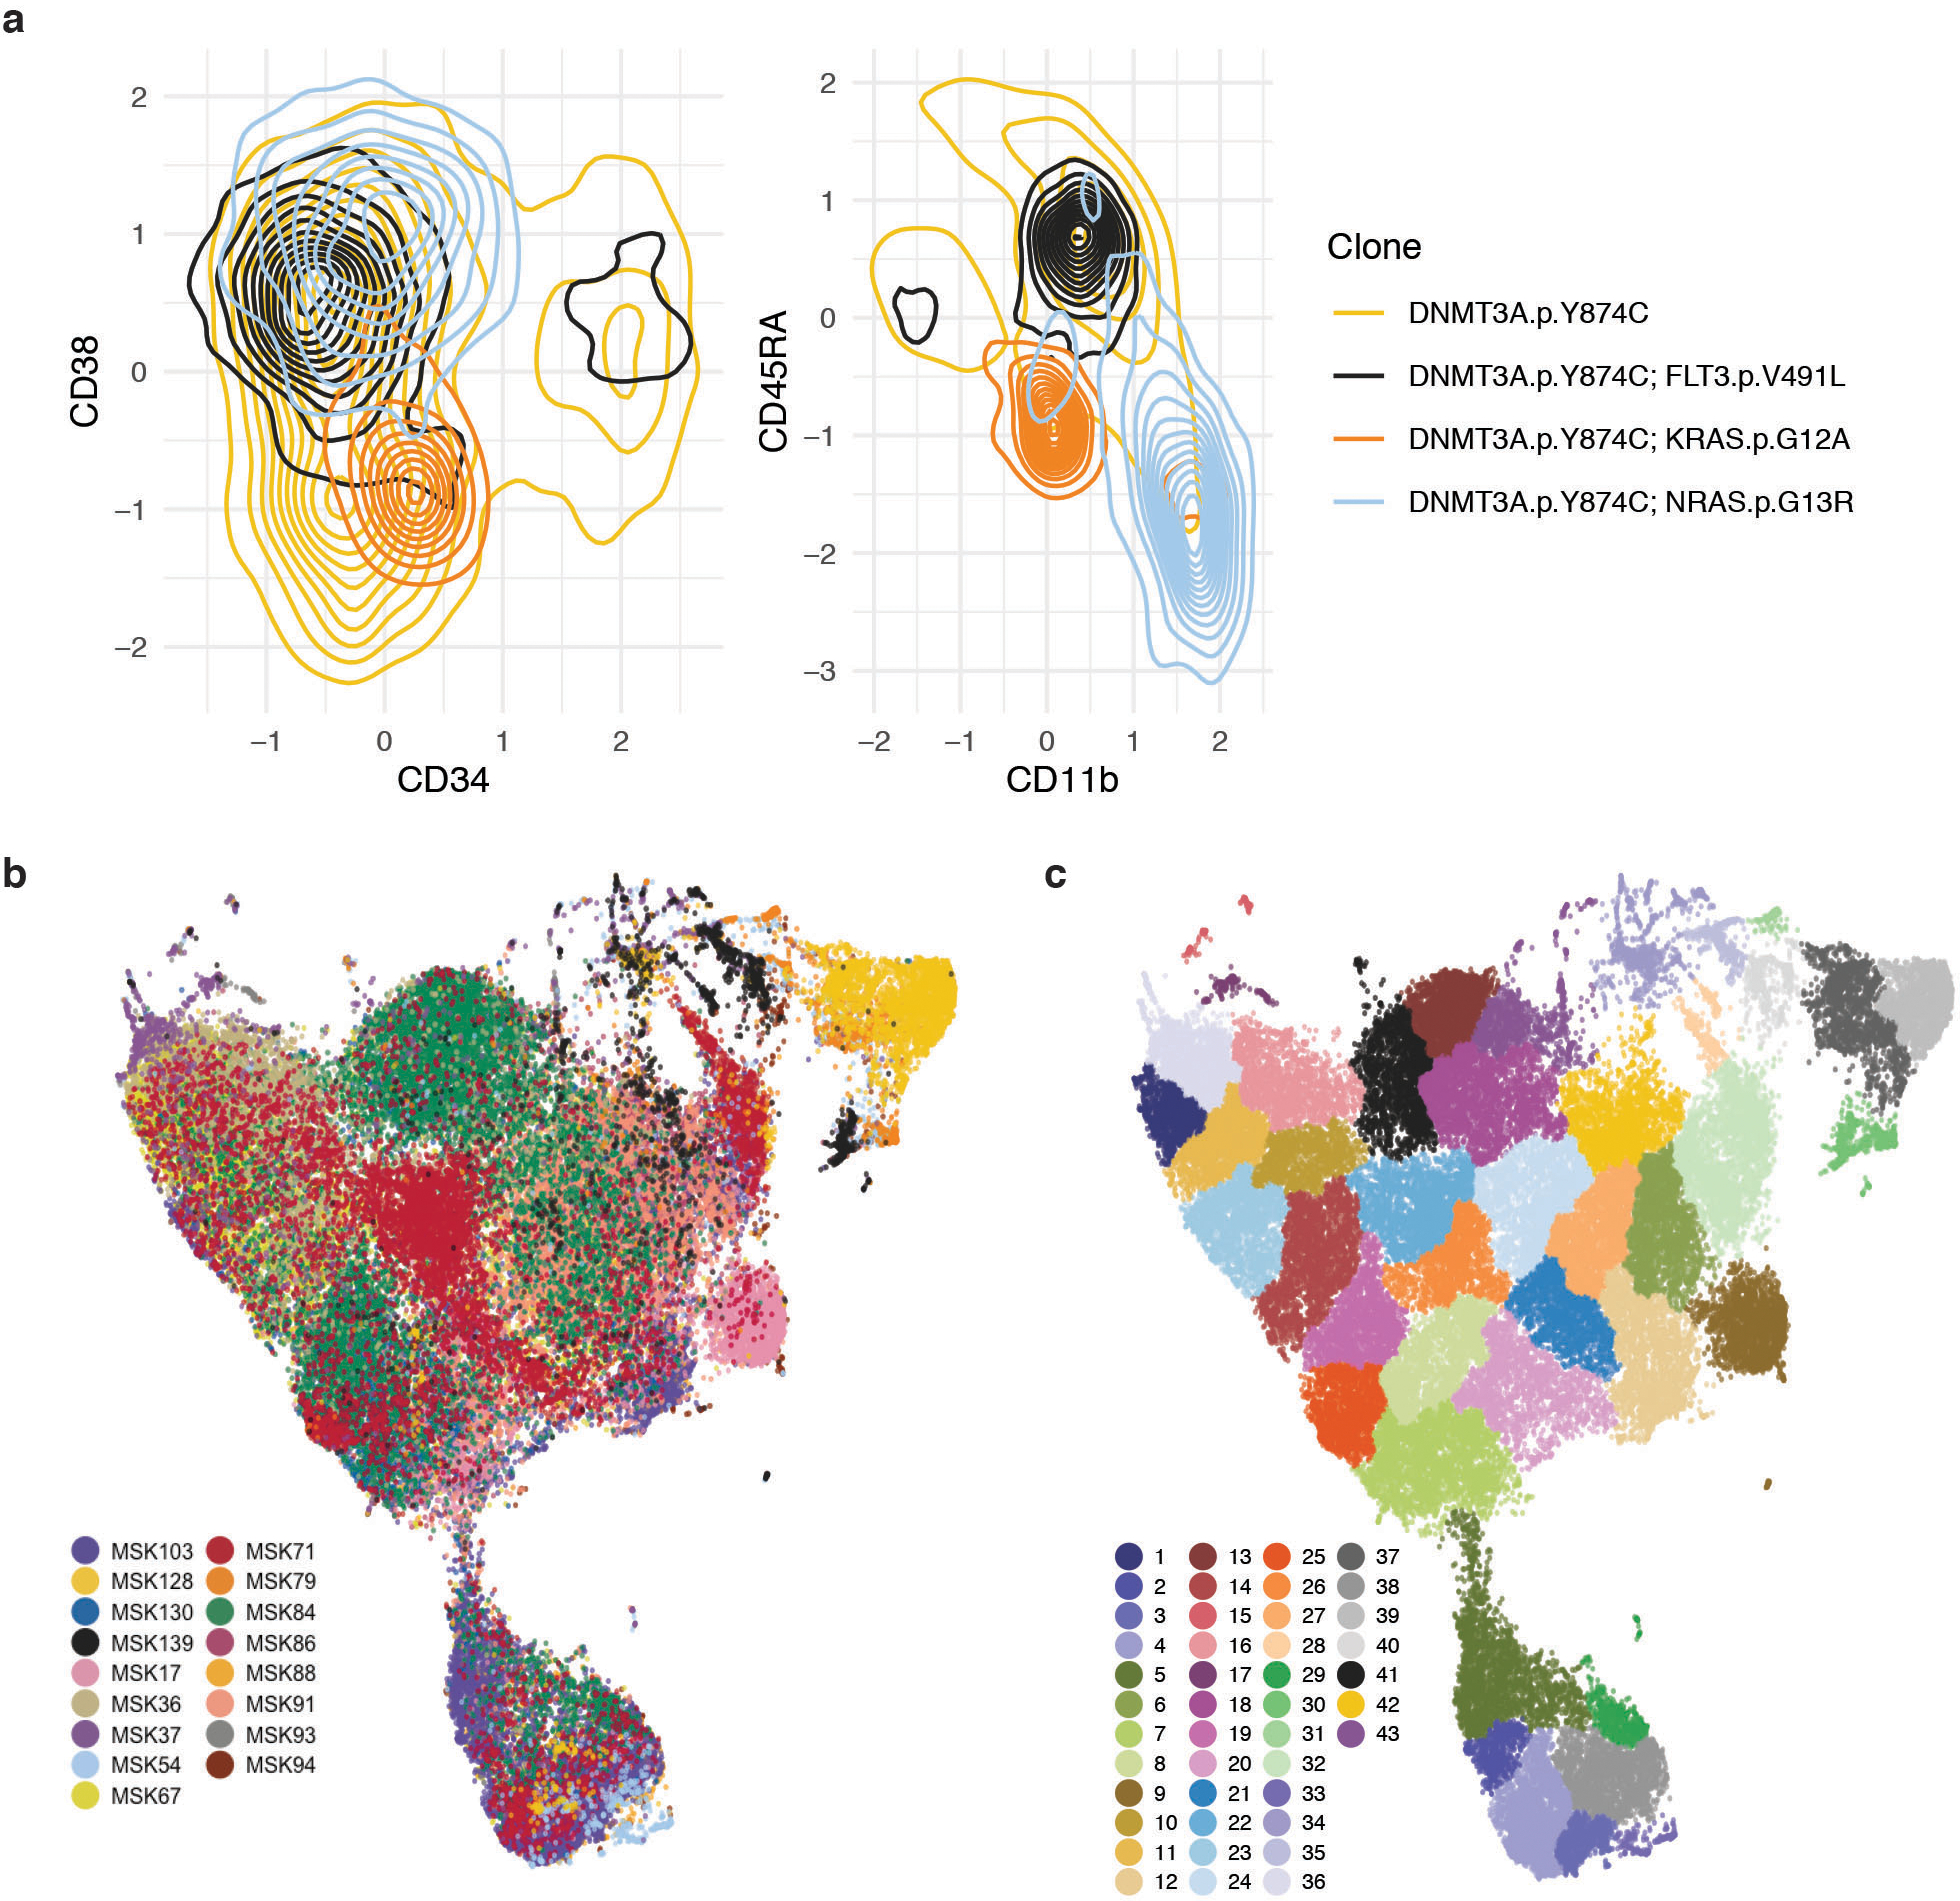
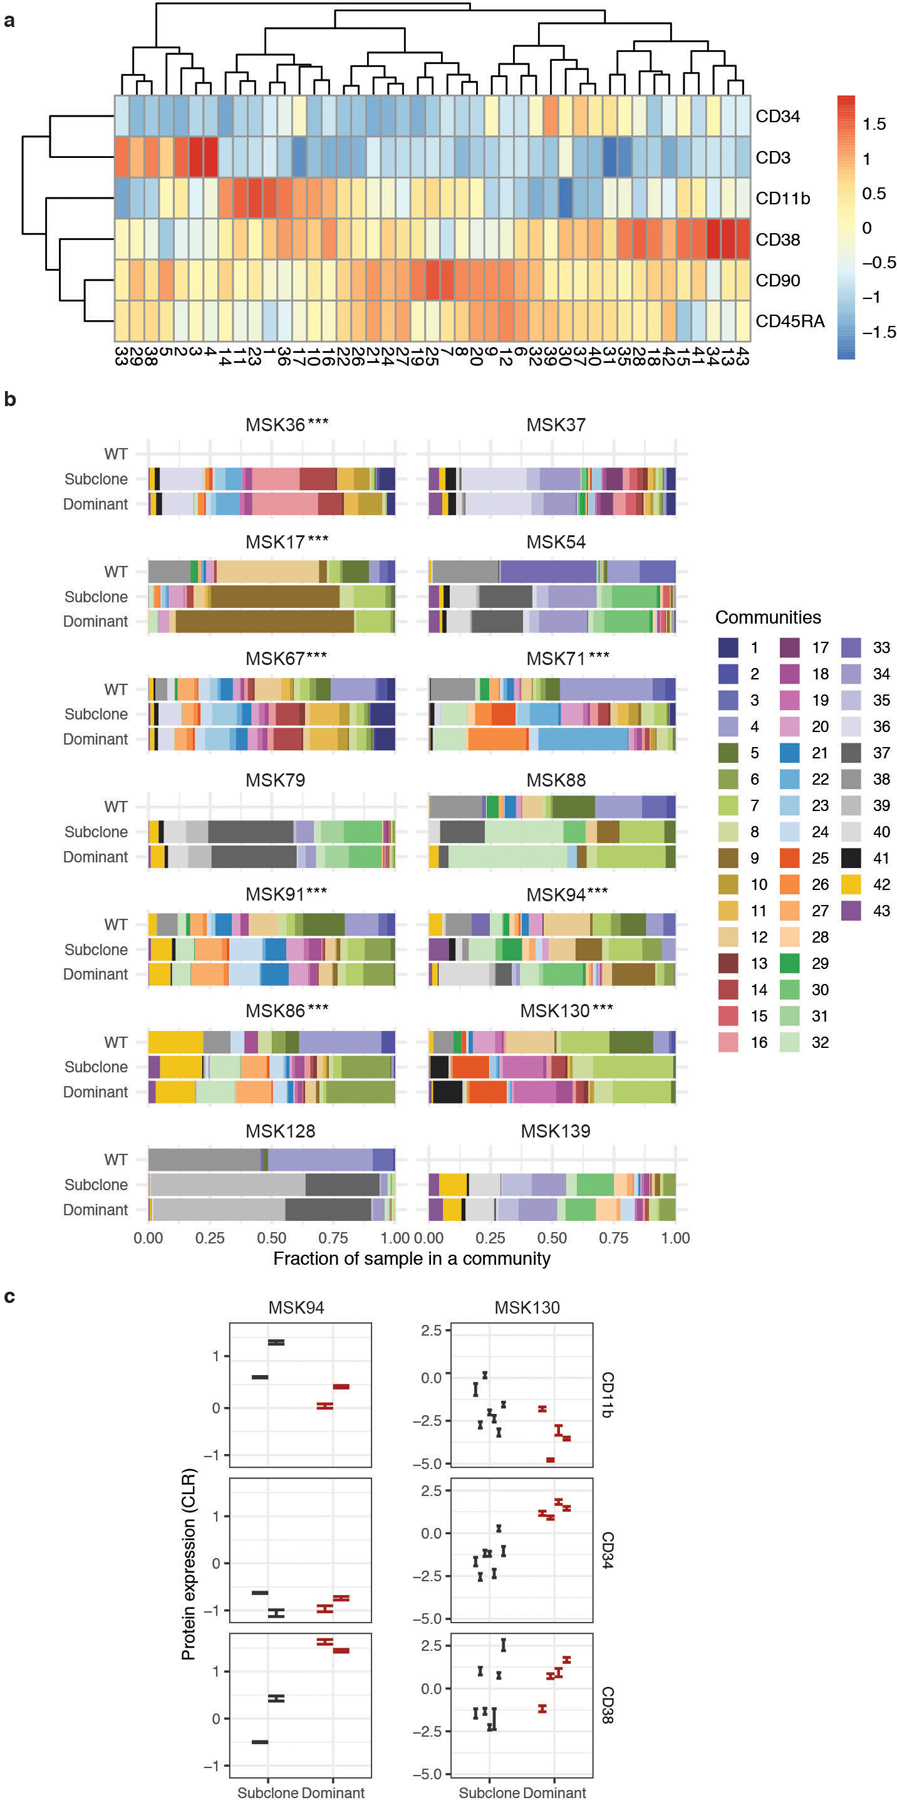
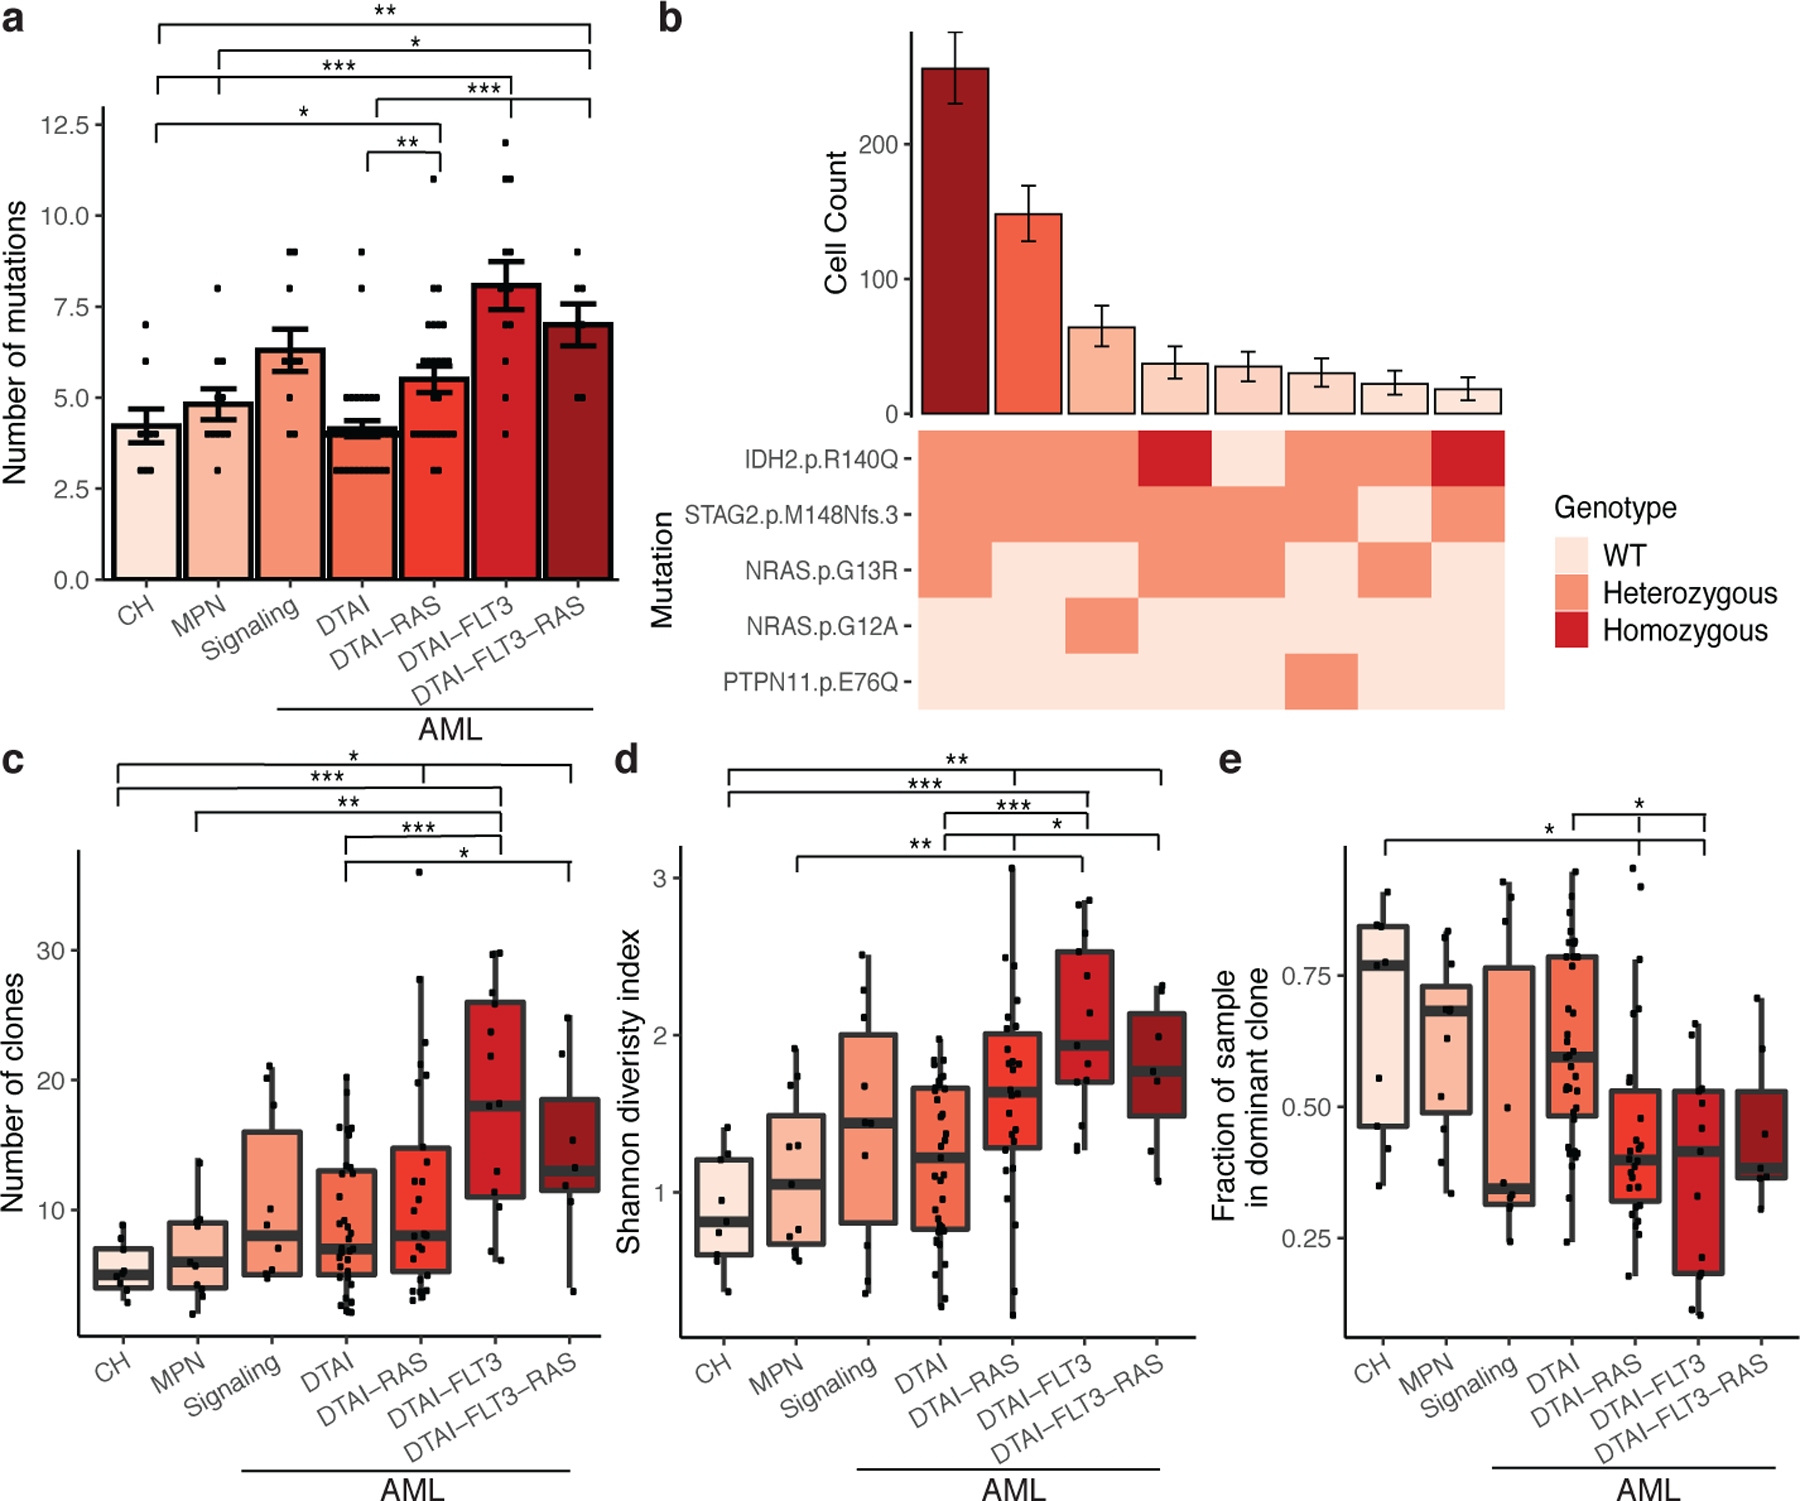
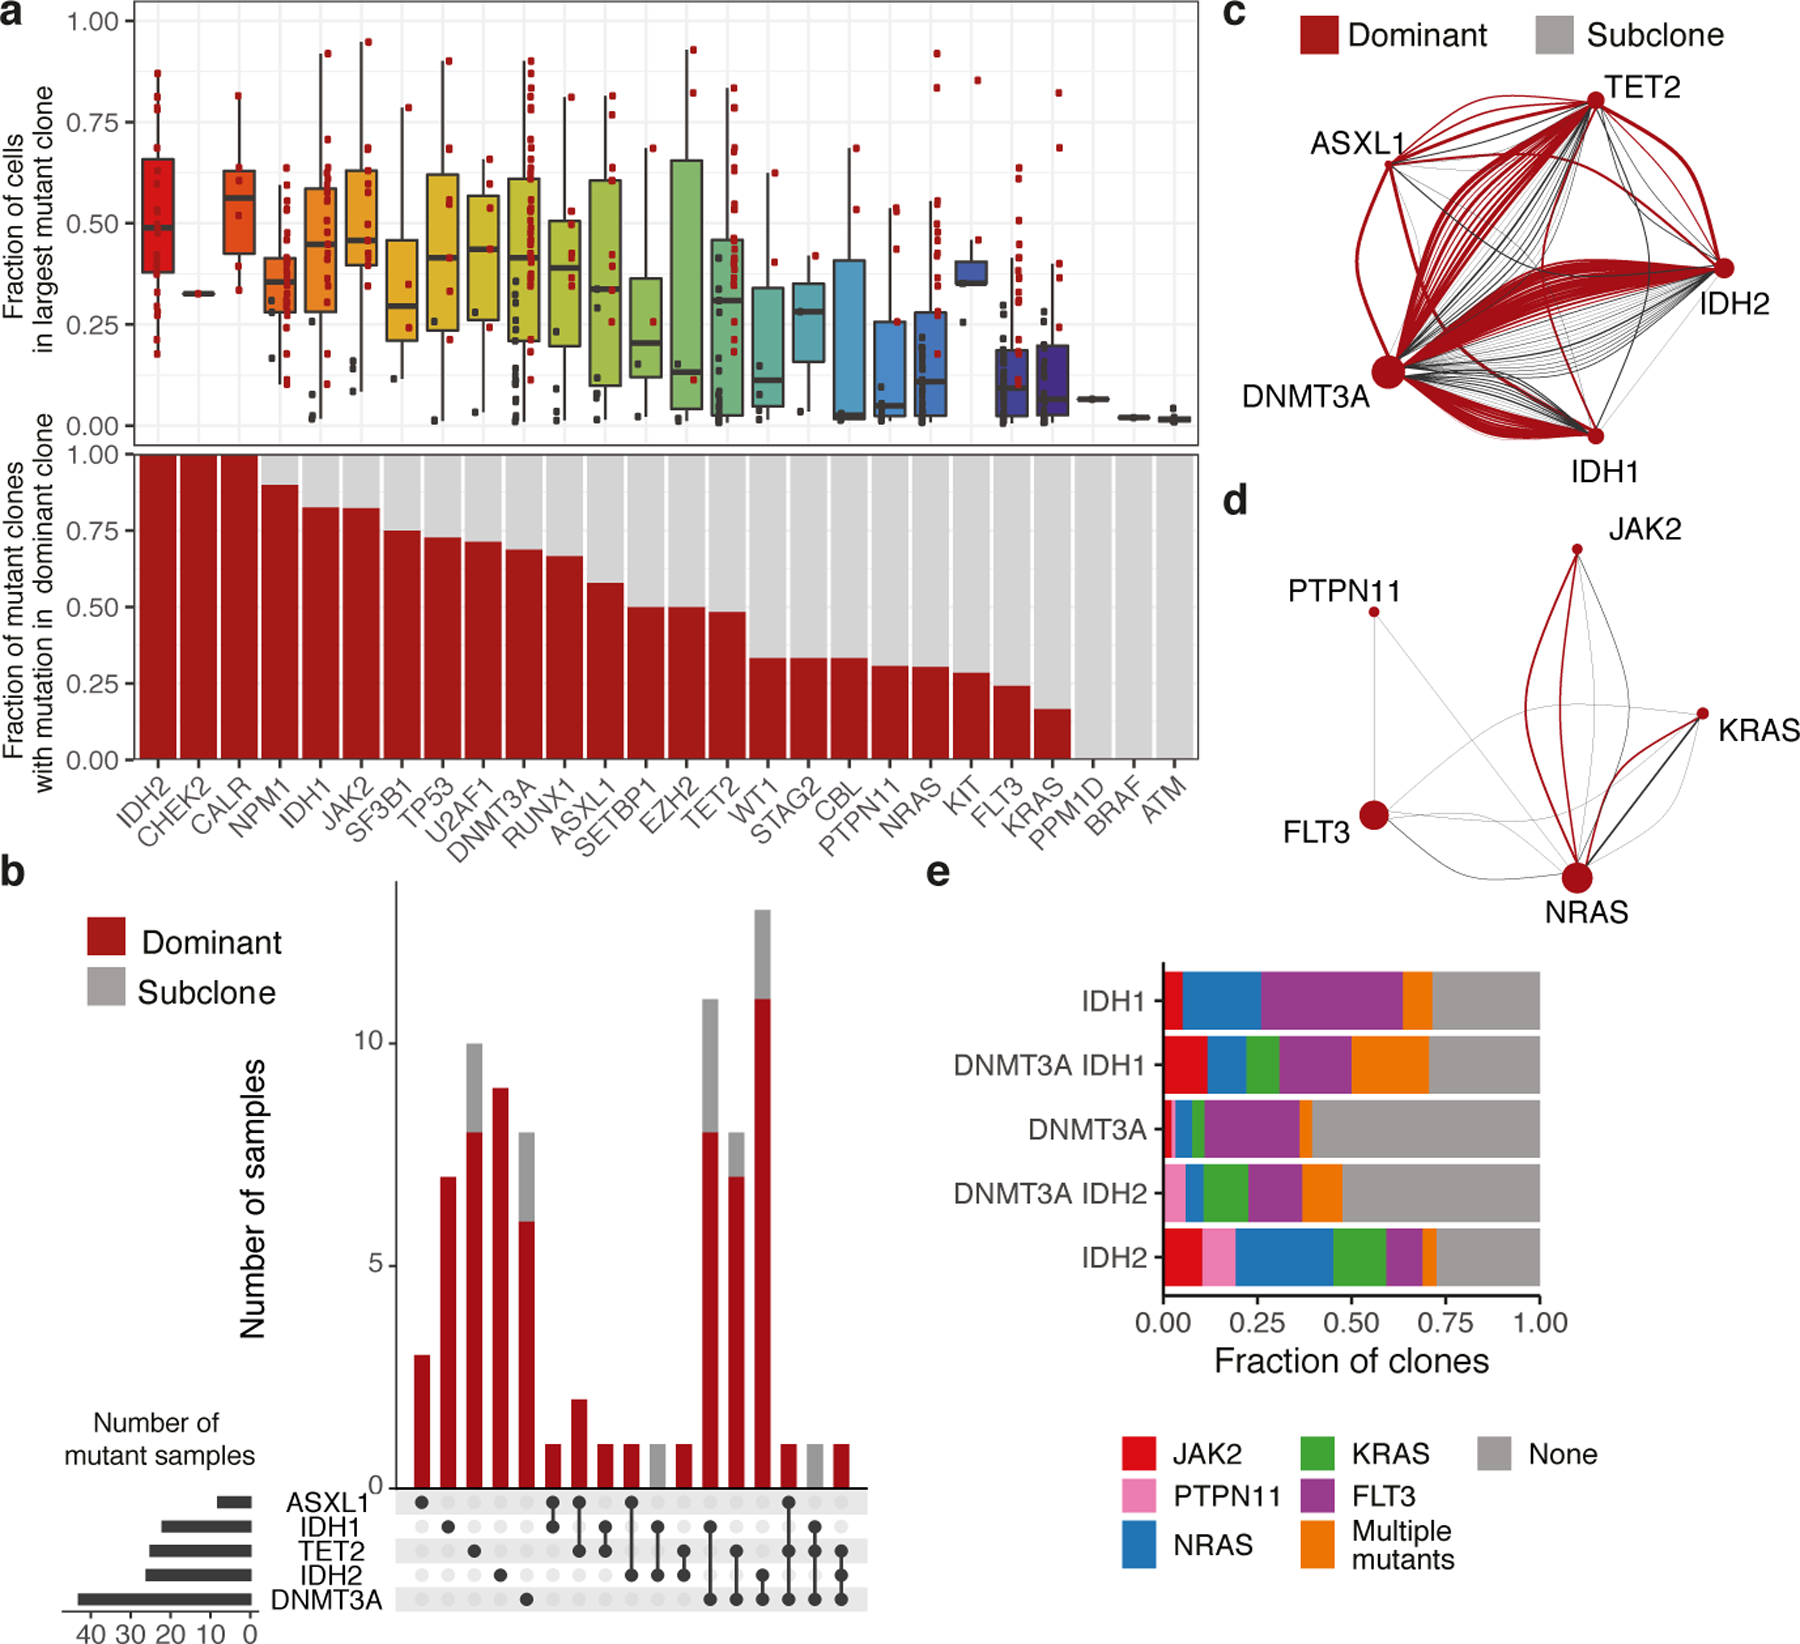
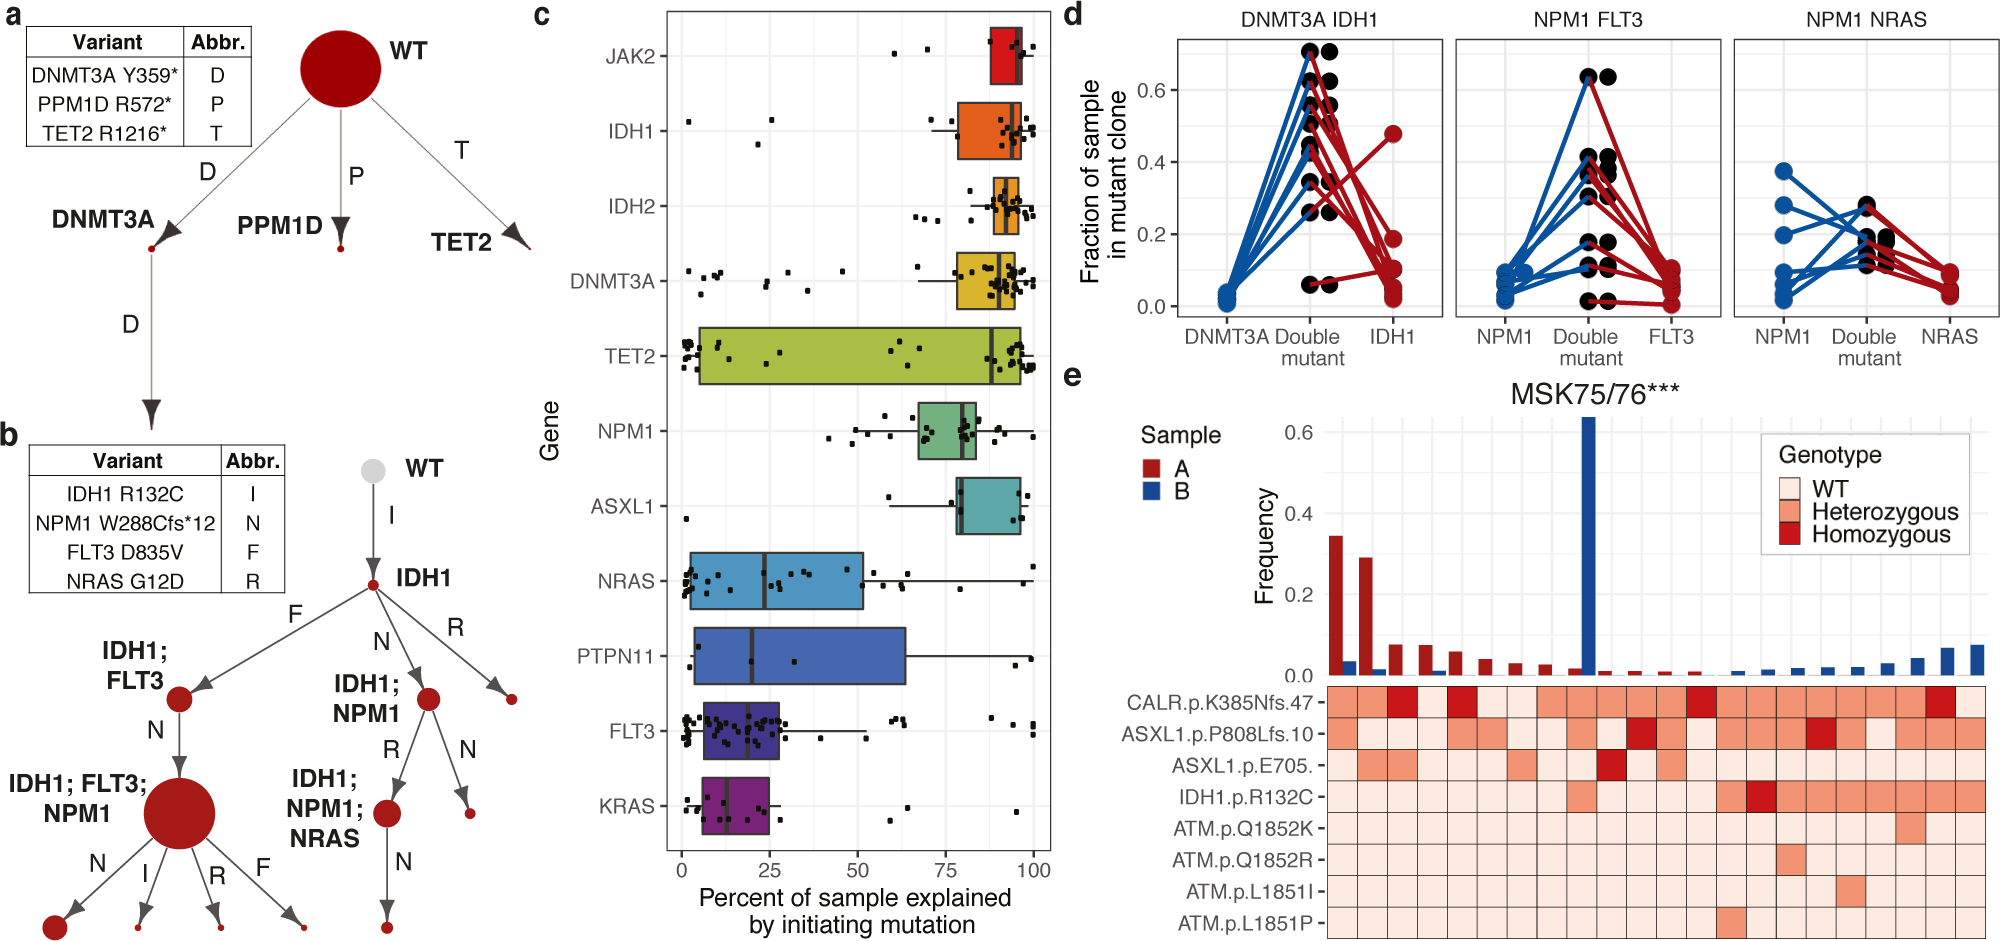
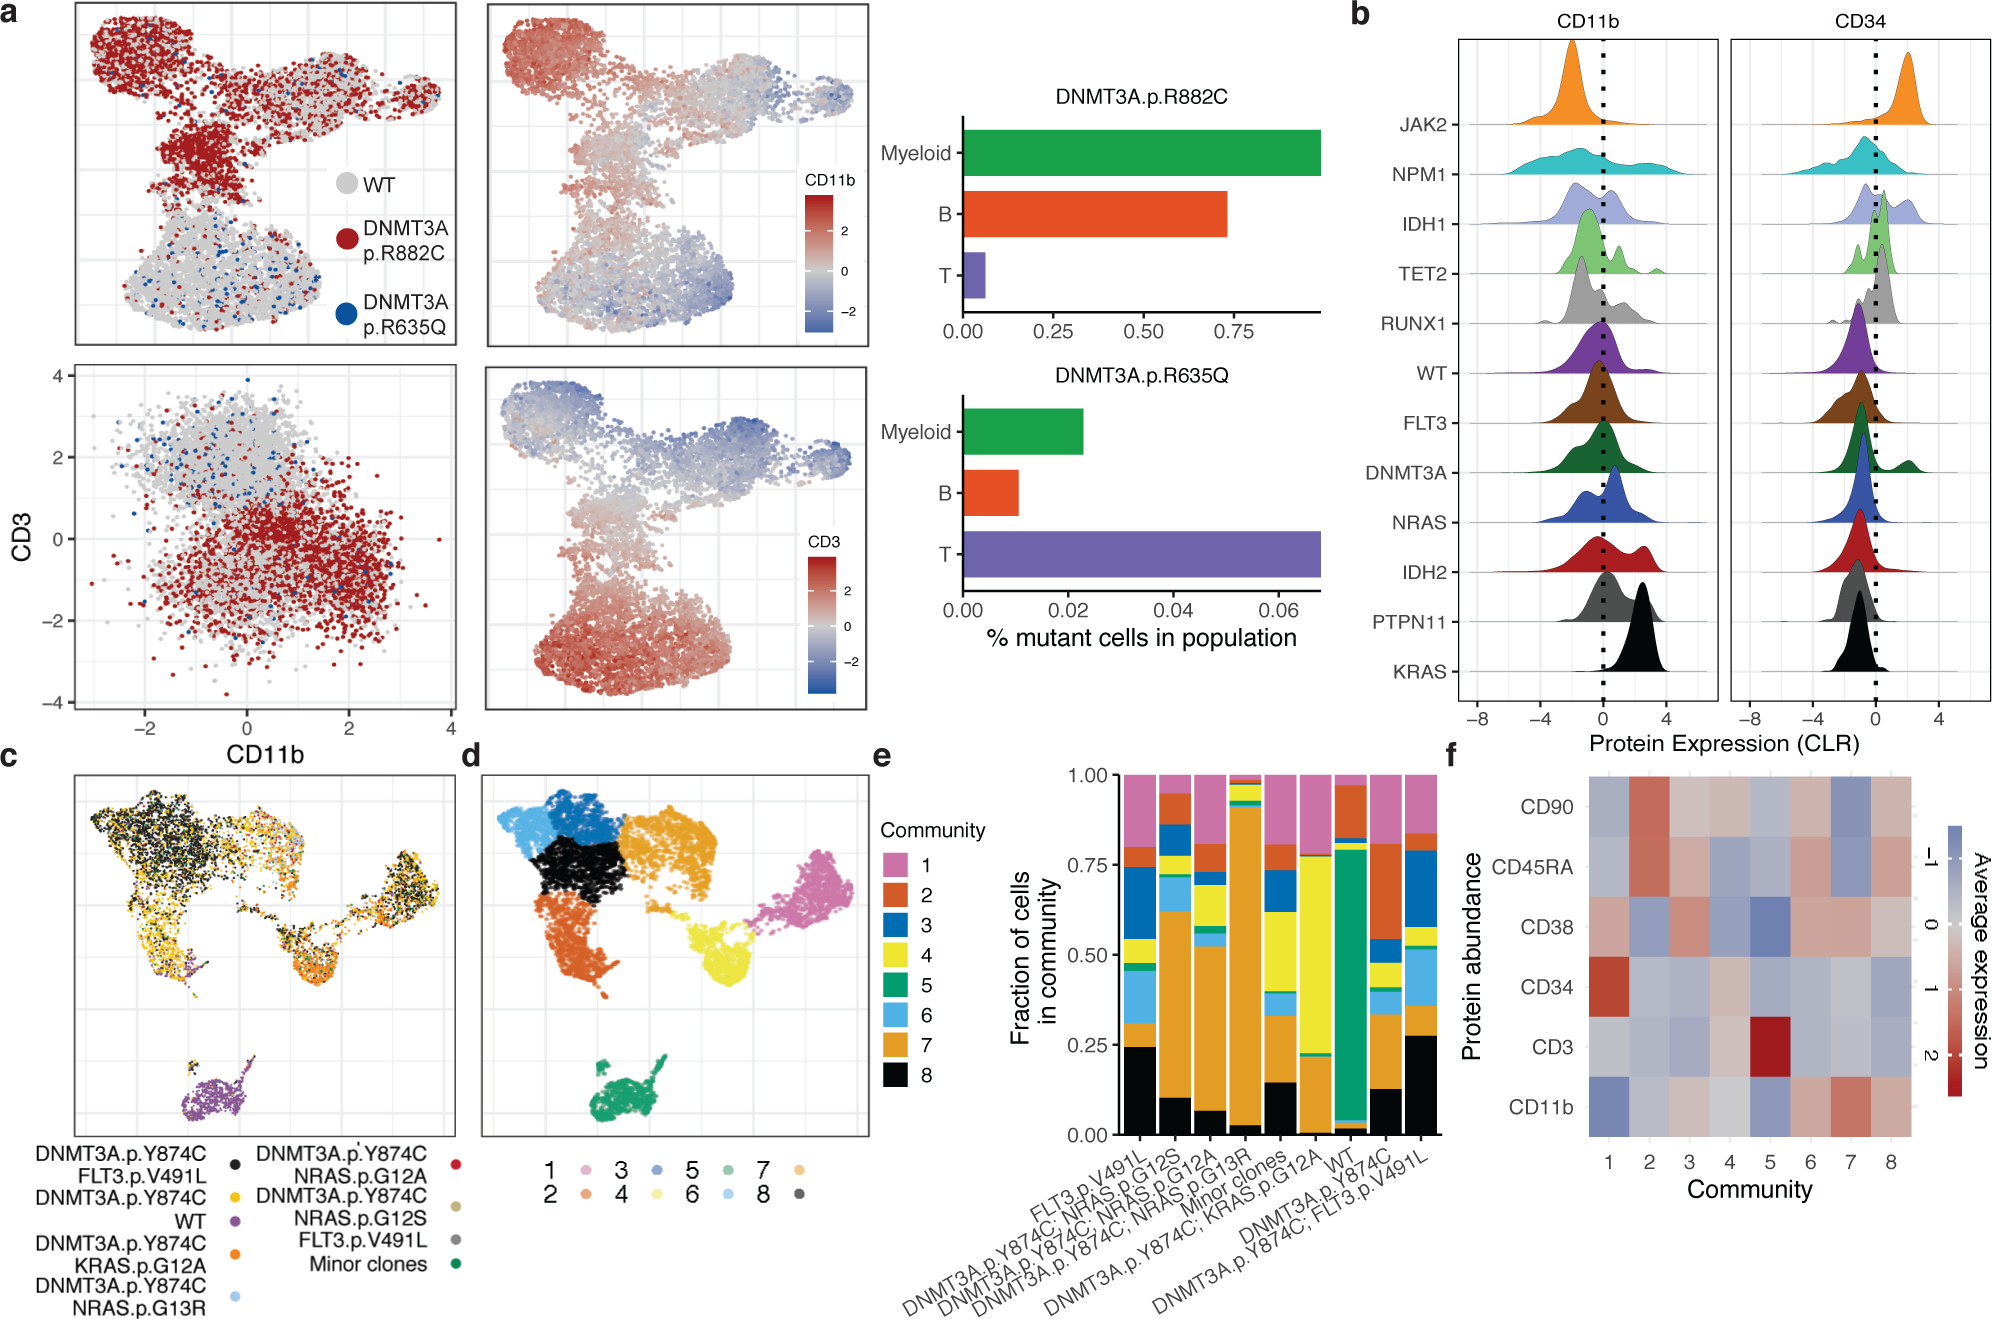
Myeloid malignancies, including acute myeloid leukaemia (AML), arise from the expansion of haematopoietic stem and progenitor cells that acquire somatic mutations. Bulk molecular profiling has suggested that mutations are acquired in a stepwise fashion: mutant genes with high variant allele frequencies appear early in leukaemogenesis, and mutations with lower variant allele frequencies are thought to be acquired later1-3. Although bulk sequencing can provide information about leukaemia biology and prognosis, it cannot distinguish which mutations occur in the same clone(s), accurately measure clonal complexity, or definitively elucidate the order of mutations. To delineate the clonal framework of myeloid malignancies, we performed single-cell mutational profiling on 146 samples from 123 patients. Here we show that AML is dominated by a small number of clones, which frequently harbour co-occurring mutations in epigenetic regulators. Conversely, mutations in signalling genes often occur more than once in distinct subclones, consistent with increasing clonal diversity. We mapped clonal trajectories for each sample and uncovered combinations of mutations that synergized to promote clonal expansion and dominance. Finally, we combined protein expression with mutational analysis to map somatic genotype and clonal architecture with immunophenotype. Our findings provide insights into the pathogenesis of myeloid transformation and how clonal complexity evolves with disease progression.


Conflict of interest statement

Declaration of Interests

L.A.M. and A.D.V. received travel support and honoraria from Mission Bio. A.T.O., R.D.D., P.M., C.A., M.M., and S.S. are employed by Mission Bio and own equity in Mission Bio. A.R.A. is a cofounder and shareholder of Mission Bio. A.Z. has received honoraria from Illumina. M.P.C. has consulted for Janssen Pharmaceuticals. A.D.G. has served on advisory boards or as a consultant for AbbVie, Aptose, Celgene, Daiichi Sankyo, and Genentech, received research funding from AbbVie, ADC Therapeutics, Aprea, Aptose, AROG, Celularity, Daiichi Sankyo, and Pfizer, and received honoraria from Dava Oncology. R.R. has consulted for Constellation, Incyte, Celgene, Promedior, CTI, Jazz Pharmaceuticals, Blueprint, Stemline, Galecto, Pharmessentia, and Abbvie, and received research support from Incyte, Stemline, and Constellation. A.D.V. is on the Editorial Advisory Board of Hematology News. R.L.L. is on the supervisory board of QIAGEN and Mission Bio and is a scientific advisor to Loxo (until Feb 2019), Imago, C4 Therapeutics, and Isoplexis. He receives research support from and consulted for Celgene and Roche and has consulted for Lilly, Jubilant, Janssen, Astellas, Morphosys, and Novartis. He has received honoraria from Roche, Lilly, and Amgen for invited lectures and from Celgene and Gilead for grant reviews. R.L.B., T.R.M., I.S.C., C.F., M.A.P., M.B., B.D., C.L.D., K.B., and S.E.M. disclose no competing interests.

Figures

Extended Figure 1.
Extended Figure 1.. ScDNA sequencing patient cohort.
A) Oncoprint of patient samples analyzed by single cell DNA sequencing. B) Table describing patient cohort characteristics. Standard deviation calculated for mean age of patients at sample collection date. Absolute number of samples denoted with percent of total samples in parentheses. C) Number of individual mutations identified for each gene covered on our custom amplicon panel by single cell DNA sequencing (n =146 biologically independent samples for C-F). Genes are ranked by the number of identified protein coding mutations from highest to lowest. Genes with zero identified mutations are not listed. D) Number of patients with protein coding mutations in a given gene. Genes are ranked by decreasing number of patients identified with mutations. E) Number of patients with a given number of identified mutant genes via single cell sequencing. F) Number of patients with a given number of identified protein altering variants via single cell sequencing. G) Correlation of bulk sequencing SNV data VAF versus single cell SNV data VAF from MSKCC samples. Statistical significance was calculated by Pearson correlation coefficient. H) Violin plot of computed VAF from single cell DNA sequencing for mutations found in both scDNA-seq and in bulk sequencing (identified; red), or mutations only identified in scDNA-seq (missed; blue) (top panel). Samples identified by single cell DNA sequencing only were found to be low VAF mutations (p < 2.2×10⁻¹⁶; two-sample Mann-Whitney test). Bar plot of the number of new mutations in each sample identified by single cell DNA sequencing only (bottom panel).
Extended Figure 2.
Extended Figure 2.. Analysis of clonal architecture by disease type and gene mutation.
A) scDNA sequencing data processing and analysis workflow. FASTQ sequencing files for each sample were uploaded and processed through Mission Bio Tapestri Insights platform for variant calling and cell finding (Commercial Platform). Included samples for further analysis harbored ≥1 variant which leads to a protein sequence change (non-synonymous/insertion/deletion) and included 50 cells with definitive genotyping for all protein coding variants within the sample (n=146). This data was used for analysis in Figure 1. Clones present in each sample were identified and samples removed if they contained less than 2 clones for clonal analysis studies. Samples were subjected to random resampling of cells using a bootstrapping approach to identify the stability of identified clones (n=132). Following bootstrapping, clones with lower 95% confidence intervals <10 were removed as were variants identified only within those clones. Samples which harbored only 1 variant or presented with <2 clones after bootstrapping analysis were removed (n=111). The number of samples at each step of processing is shown below the different steps of the workflow. B) Number of mutations in the most dominant clone identified in each sample (n =111 biologically independent samples) stratified by cohort. Mean value for each cohort shown by height of bar with standard error of measurement (SEM) depicted with error bars. A two-sided t-test with false discovery rate (FDR) correction was used to determine statistical significance pairwise between all groups. For clarity, only significant p-values referenced in text are shown. * P < 0.1; ** P < 0.01; ***P < 0.001. C) Association between clone size and the number of mutant alleles in the clone. Every clone (n = 111 biologically independent samples) identified in clinical cohort is depicted by black circle. Centerline: median; box: IQR; whiskers 1.5xIQR. D) Barplot depicting the prevalence of dominant clones for each DTAI gene across patient cohorts. Color of bar plot annotates if mutation occurs in the dominant clone (red) or subclone (grey). Absence of bar denotes no clones were identified with the indicated mutation in a given cohort. E) Association of VAF with presence of mutation in either the dominant clone (red) or subclone (grey) for select genes (n = 101 biologically independent samples). Standard error of measurement depicted with error bars. A two-sided t-test with false discovery rate (FDR) correction was used to determine statistical significance pairwise between all groups. * P < 0.1; ** P < 0.01; ***P < 0.001. Absence of p value for IDH2 and JAK2 due to lack of samples with subclonal mutations. F) Pairwise interaction matrix of mutually exclusive (red square) and inclusive (blue square) on a per sample basis. Pairwise interactions with no color did not garner a significant p-value.
Extended Figure 3.
Extended Figure 3.. Clonal dominance, initiating mutation, and co-mutation patterns in MM patients.
A) Upset plot of co-occurring DTAI mutations in CH samples with more than 1 DTAI variant. Bar graph (top panel) depicts the number of samples with each mutant gene(s) and color of bar annotating whether mutation(s) occur in the dominant clone (red) or subclones (grey). Black circles and connecting line in bottom panel demark the combination of mutations in each corresponding bar plot. B) Divergent frequency of co-mutated cells for epigenetic modifier genes (red) and signaling genes (blue). Individual samples (n=6 samples) shown with black square. Centerline: median; box: IQR; whiskers 1.5xIQR. A two-sided Student’s t-test was used to determine statistical significance * P < 0.1; ** P < 0.01; ***P < 0.001. C) Fraction of mutant samples harboring a homozygous mutation for the indicated given gene (at least >10% of cells). Homozygous sample denoted in blue. D) Correlation of VAF computed by scDNA sequencing to fraction of a mutant sample explained by the genetic trajectory starting with an initiating mutation in a given gene. Genes used as the initiating mutation for a given sample are denoted by colored squares (colors described in figure). Statistical significance calculated by Spearman’s rank correlation coefficient test (ρ = 0.93; p ≤ 2.2 × 10⁻¹⁶). E) Number of samples where a monoallelic clone for a given gene is observed. Dark blue denotes total number of mutant samples where single-mutant clone is present for a given gene and grey represents mutant samples where single-mutant clone is unobserved. F) Number of DNMT3A mutant samples where single-mutant clones are observed (red) or unobserved (grey) with samples categorized by DNMT3A R882 hotspot mutations, nonsense mutations, or missense mutations. A two-sided Fisher’s exact test was used to determine statistical significance (p ≤ 0.04) between DNMT3AR882 and other missense mutations. G) Differences in dominant and subclone size in DNMT3A mutant samples (n=61 biologically independent clones). Fraction of sample in the dominant clone or subclone(s) for DNMT3A nonsense (red), R882-missense (green), and non-R882 missense (blue) mutations shown. Centerline: median; box: IQR; whiskers 1.5xIQR. Each mutant clone denoted by black square. A two-sided t-test correction was used to determine statistical significance pairwise between all groups. For clarity, only significant p-values referenced in text are shown. * P < 0.1. H) As in Main Figure 3E, fraction of sample in single and double mutant clones in DNMT3A/IDH2 mutant samples. Each sample is indicated by a connecting line, absence of a line for single mutants indicates absence of clone.
Extended Figure 4.
Extended Figure 4.. Clonal evolution in MM patients.
A) Paired samples from patients (n=6) that underwent MPN to AML transformation were analyzed. Samples with significant changes in clonal architecture or “clonal sweeps” were evaluated using a two-sided two proportions z-test; ***P<0.001. Sample A (red) denotes the MPN sample and sample B (blue) denotes the AML sample. Clonotype plot depicts the frequency of a clone with given genotype in Sample A and B ranked by decreasing frequency based on Sample A (top panel). Heatmap (bottom panel) shows the genotype of each identified protein coding mutation in the given clone with zygosity (wildtype = light pink, heterozygous = orange, homozygous = red). Paired samples MSK75/76 are highlighted in Main Figure 3F. B) Clonal sweeps, or significant clonal architecture alterations, following gilteritinib therapy of FLT3-mutant patients (n=3). Line graphs for each pair of samples depict individual clones and the change in clone frequency between pre- (left) and post- (right) therapy samples. Clones harboring FLT3 mutations (red), RAS mutations (blue), or WT clones (light blue) are significantly altered after gilteritinib therapy in each patient. FLT3/RAS mutations (orange) and clones harboring additional mutations (Other; grey) are also included. Statistical significance was assessed using a two-sided two proportions z-test; ***P<0.001 (A-B). C) As in (A), clonotype plot of paired sample (n=1 sample/timepoint) from AML patient (MSK95/96) that under gilteritinib therapy: sample A (red, pre-therapy) and sample B (blue, post-therapy).
Extended Figure 5.
Extended Figure 5.. Contribution of clonal hematopoiesis (CH) mutations to mature cell lineages.
Bar graphs of the mutant cell percentage found in Myeloid (CD11b high; green), B-cell (CD19 high; orange), and T-cell (CD3 high; purple) cells in samples from patients with CH. DNMT3A and/or TET2 mutations found in each sample are listed above each graph. Double mutant samples are shown on the left and single mutant samples are depicted on the right.
Extended Figure 6.
Extended Figure 6.. Simultaneous molecular and immunophenotypic profiling of AML patient samples.
A) UMAP plot of MSK54 with cells clustered by immunophenotype. Genotype (WT= grey; DNMT3A = red; IDH2 = green; DNMT3A/IDH2 double mutant = blue) overlaid onto each cell. B) UMAP from A with protein expression (high expression = red; low expression = blue) for each of the 6 antibody targets (CD3, CD11b, CD34, CD38, CD45RA, CD90) overlaid onto each cell. Relative protein expression is normalized across individual sample by centered log transformation (CLR). C) Immunophenotype changes based on co-occurring mutations in clones. Heatmap of normalized protein expression of CD34 (top panel) and CD11b (bottom panel) in DNMT3A and IDH1/2 single-mutant clones vs. DNMT3A and IDH1/2 mutant clones with co-occurring NRAS or FLT3 mutations. High protein expression depicted in red and low protein expression depicted in blue.
Extended Figure 7.
Extended Figure 7.. Clonal architecture analysis using single cell DNA + Protein sequencing of select AML samples.
Samples shown have significant differences in community representation between the dominant clone and subclones further discussed in Extended Figure 8. MSK71 (depicted with ***) is highlighted in Main Figure 4C–F. Clonotype plot depicts the number of cells identified with a given genotype and ranked by decreasing frequency (top panel). Mean cell counts for each clone is depicted with 95% confidence intervals derived from random resampling analysis. Heatmap (middle panel) shows the genotype of each identified protein coding mutation in the given clone with zygosity (wildtype = light pink, heterozygous = orange, homozygous = red). Heatmap of the relative protein expression for each cell surface protein (n=7) in each identified clone (purple = high expression; green = low expression).
Extended Figure 8.
Extended Figure 8.. Neighborhood analysis of all single cell DNA+Protein AML samples.
A) Divergences in cell surface protein expression of CD34, CD38, CD11b, and CD45RA determined by presence of signaling effector mutation. Density plots of cells from MSK71 (further detailed in Figure 4C–F and Extended Figure 7) of DNMT3A mutant cells (yellow = single-mutant) with co-occurring FLT3 (black), KRAS (orange), or NRAS (light blue) mutations. Concentration of cells with a given immunophenotype depicted by the density of lines. B) UMAP plot of samples (n=17) analyzed by DNA+Protein single cell sequencing with cells clustered by cell surface protein expression of 6 antibody targets (CD3, CD11b, CD34, CD38, CD45RA, CD90). Cells from the same sample are denoted with same color. C) Neighborhood analysis of all samples from UMAP from (B) with communities of cells identified by neighborhood analysis in overlaid colors.
Extended Figure 9.
Extended Figure 9.. Clone- and gene- specific alterations to cell surface protein expression and community representation in AML samples.
A) Column normalized heatmap of cell surface protein expression for each community identified in phenoGraph analysis on UMAP from Extended Figure 8B–C. Expression is depicted by color with blue being low expression and red annotating high expression. B) Community representation changes across all samples (n=14) in WT, the dominant clone, and all subclones. The fraction of each sample within each community is shown with communities depicted by corresponding color. Samples without communities shown for WT cells were found to not have any WT cells present in analysis. Changes in immunophenotype due to community representation changes for samples MSK94 (p ≤ 9.95 × 10⁻³) and MSK130 (p ≤ 2.45 × 10⁻⁸) are highlighted in C. A two proportions z-test for each sample was used to determine statistical significance between dominant clone communities and communities present in subclone ***P < 0.001. C) Cell surface protein expression of CD11b, CD34, and CD38 between dominant clone (red) and subclones (black) in a FLT3-ITD mutant sample (MSK130; right panel; n=2274 total cells) and JAK2 mutant sample (MSK94; left panel; n=6012 total cells). Each error bar represents a distinct community that is significantly expanded or contracted, (error bar indicates ± standard error of measure, from the mean expression of indicated protein in a given community). A Student’s t-test was used to determine statistical significance * P < 0.1; ** P < 0.01; ***P < 0.001.
Figure 1.
Figure 1.. Single cell DNA sequencing of patients with myeloid malignancies.
A) Bar plot of the number of identified mutations in each sample (n =111 biologically independent samples; A, C-E) with samples by cohort. Mean value indicated by height of bar with error bars depicting standard error measurement. A two-sided t-test with false discovery rate (FDR) correction was used to determine statistical significance pairwise between groups (A, C-E). For clarity, only significant p-values referenced in text are shown. * P < 0.1; ** P < 0.01; ***P < 0.001 (A, C-E). B) Bar plot depicts the number of cells identified with a given genotype and ranked by decreasing frequency (top panel). Mean cell counts for each clone depicted with 95% confidence intervals. Heatmap indicates mutation zygosity for each clone (wildtype = light pink, heterozygous = orange, homozygous = red). C-E) Boxplot depicting the number of unique clones per sample for each cohort (C), clonal diversity calculated by the Shannon diversity index (D), and the fraction of cells in the dominant clone (E) for each sample (center line: median; box: interquartile range (IQR); whiskers: 1.5xIQR; C-E).
Figure 2.
Figure 2.. Elucidation of clonal dominance and co-mutation by single cell DNA sequencing.
A) Boxplot (center line, median; box, IQR; whiskers, 1.5xIQR) indicating the fraction of cells for a sample in the largest mutant clone (top panel). Dominant clones indicated in red dots and subclones in black dots. Barplot indicating the proportion of mutant clones where the indicated gene is mutated in the most dominant identified clone (red bar; bottom panel) (n=485 clones, n=111 samples). B) Upset plot of co-occurring mutations for AML samples with mutations in DTAI genes. Bar graph depicts number of samples with each mutant gene(s). Presence in dominant clone (red) or subclones (grey) is indicated. Grid (bottom panel) indicates combination of mutations in each corresponding barplot. C-D) Co-occurrence spectrum of DTAI mutations (C) or signaling mutations (D). Size of vertex represents number of samples mutated for given gene. Edge color denotes dominant clones (red) and subclone (grey), with edge width representative of clone size. E) Within AML patients, barplot indicates fraction of clones with co-occurring signaling mutations in DNMT3A, IDH1, and IDH2 mutant clones. Different signaling mutations are colored as indicated.
Figure 3.
Figure 3.. Identification of initiating mutations and clonal expansion through assessing optimal genetic trajectories.
A-B) Representative genetic trajectories from CH (A, MSK68) and DTAI samples. (B, MSK129). Size of circle denotes relative clone size with observed clones in red and unobserved clones in grey (with fixed size). C) Fraction of each sample explained by indicated putative initiating mutation (center line, median; box, IQR; whiskers, 1.5xIQR; n =80 biologically independent samples, n=383 clones) D) Fraction of sample in single and double mutant clones in DNMT3A/IDH1 (n=9), FLT3/NPM1c (n=9) and RAS/NPM1c (n=7) mutant samples. Each sample indicated by connecting line, absence of a line for single mutants indicates absence of clone. E) Clonotype plot of paired sample from a patient that underwent leukemic transformation (MSK75/76; n=1/timepoint): sample A (red, MPN) and sample B (blue, AML). Height of bar depicts frequency of a clone in each sample. Heatmap indicates mutation zygosity for each clone (wildtype = light pink, heterozygous = orange, homozygous = red).
Figure 4.
Figure 4.. Simultaneous single cell DNA and cell surface protein expression sequencing.
A) UMAP plot of CH sample MSK15 (n=1) with cells clustered by immunophenotype. Genotype overlaid onto each cell (top left panel, WT-grey; DNMT3AR882C-red; DNMT3AR635Q-blue). Relative protein expression for CD11b and CD3 overlaid onto each cell (high = red; low = blue) in UMAP (middle panel). Protein expression of CD3 and CD11b with genotype indicated by color (lower left panel). Bar graph of mutant cell percentage found in Myeloid, B-cell, and T-cell communities (right panel). B) Histogram of CLR normalized protein expression of CD34 and CD11b for cells mutated with select genes. C-D) UMAP for sample MSK71 clustered by immunophenotype with corresponding clones from Extended Figure 7 (denoted with ***) depicted in overlaid colors (C) or communities determined by phonograph (D). E) Fraction of cells in a given clone clustered in 8 communities present in MSK71 depicted by color of corresponding community from (D). F) Heatmap depicts CLR of indicated proteins for each community from (D) (high=red; low=blue).

Comment in

References

    1. Genovese G et al. Clonal hematopoiesis and blood-cancer risk inferred from blood DNA sequence. N Engl J Med 371, 2477–2487, doi: 10.1056/NEJMoa1409405 (2014). - DOI - PMC - PubMed
    1. Jan M et al. Clonal evolution of preleukemic hematopoietic stem cells precedes human acute myeloid leukemia. Sci Transl Med 4, 149ra118, doi: 10.1126/scitranslmed.3004315 (2012). - DOI - PMC - PubMed
    1. Papaemmanuil E et al. Genomic Classification and Prognosis in Acute Myeloid Leukemia. N Engl J Med 374, 2209–2221, doi: 10.1056/NEJMoa1516192 (2016). - DOI - PMC - PubMed
    1. Patel JP et al. Prognostic relevance of integrated genetic profiling in acute myeloid leukemia. N Engl J Med 366, 1079–1089, doi: 10.1056/NEJMoa1112304 (2012). - DOI - PMC - PubMed
    1. Cancer Genome Atlas Research, N. et al. Genomic and epigenomic landscapes of adult de novo acute myeloid leukemia. N Engl J Med 368, 2059–2074, doi: 10.1056/NEJMoa1301689 (2013). - DOI - PMC - PubMed

Methods References

    1. Patel JP et al. Prognostic relevance of integrated genetic profiling in acute myeloid leukemia. N Engl J Med 366, 1079–1089, doi: 10.1056/NEJMoa1112304 (2012). - DOI - PMC - PubMed
    1. Papaemmanuil E et al. Genomic Classification and Prognosis in Acute Myeloid Leukemia. N Engl J Med 374, 2209–2221, doi: 10.1056/NEJMoa1516192 (2016). - DOI - PMC - PubMed
    1. Rampal R et al. Genomic and functional analysis of leukemic transformation of myeloproliferative neoplasms. Proc Natl Acad Sci U S A 111, E5401–5410, doi: 10.1073/pnas.1407792111 (2014). - DOI - PMC - PubMed
    1. Tefferi A & Vardiman JW Classification and diagnosis of myeloproliferative neoplasms: the 2008 World Health Organization criteria and point-of-care diagnostic algorithms. Leukemia 22, 14–22, doi: 10.1038/sj.leu.2404955 (2008). - DOI - PubMed
    1. Cheng DT et al. Memorial Sloan Kettering-Integrated Mutation Profiling of Actionable Cancer Targets (MSK-IMPACT): A Hybridization Capture-Based Next-Generation Sequencing Clinical Assay for Solid Tumor Molecular Oncology. J Mol Diagn 17, 251–264, doi: 10.1016/j.jmoldx.2014.12.006 (2015). - DOI - PMC - PubMed

Publication types