. 2020 Nov;587(7835):626-631.
doi: 10.1038/s41586-020-2857-9. Epub 2020 Oct 28.

Macrophage-derived glutamine boosts satellite cells and muscle regeneration

Affiliations

Macrophage-derived glutamine boosts satellite cells and muscle regeneration

Min Shang et al. Nature. 2020 Nov.

Abstract

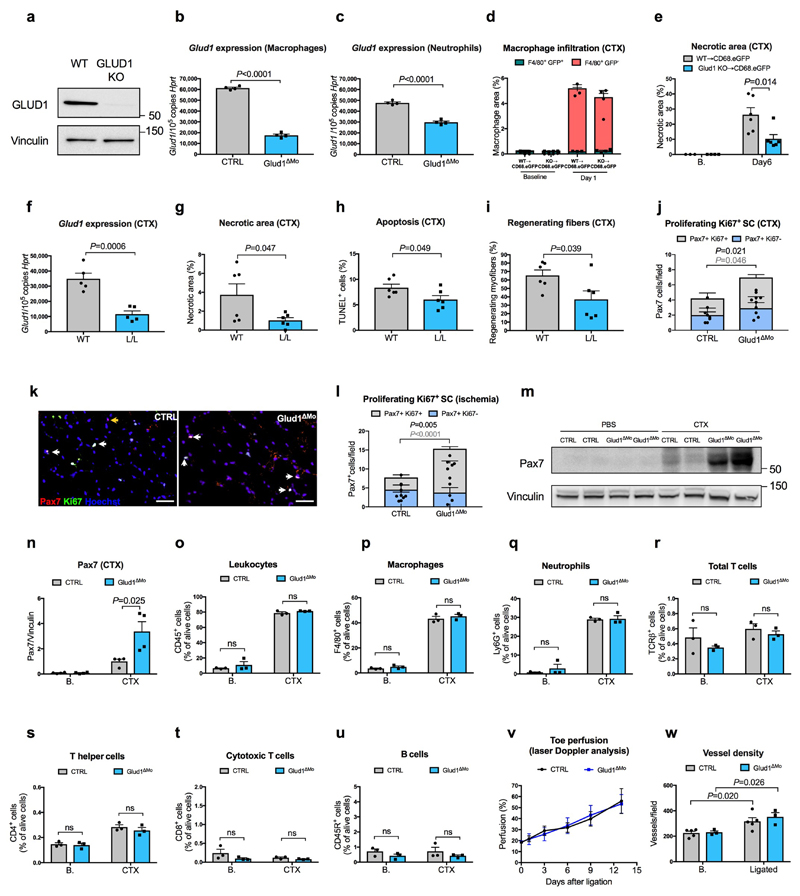
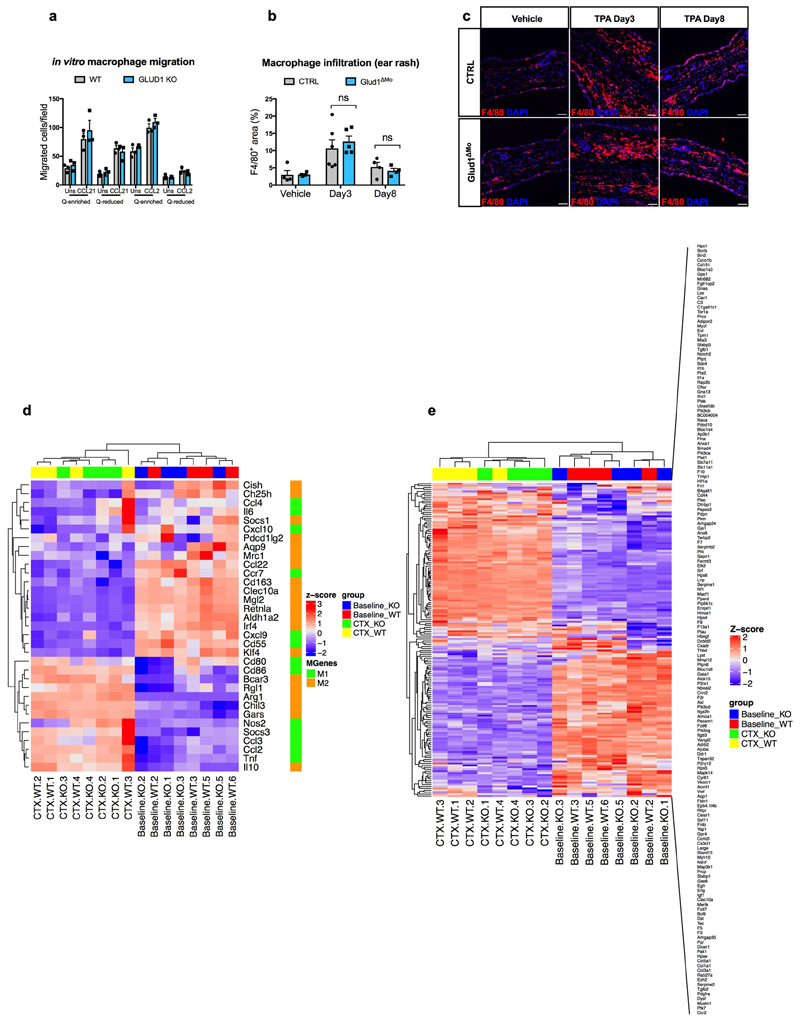
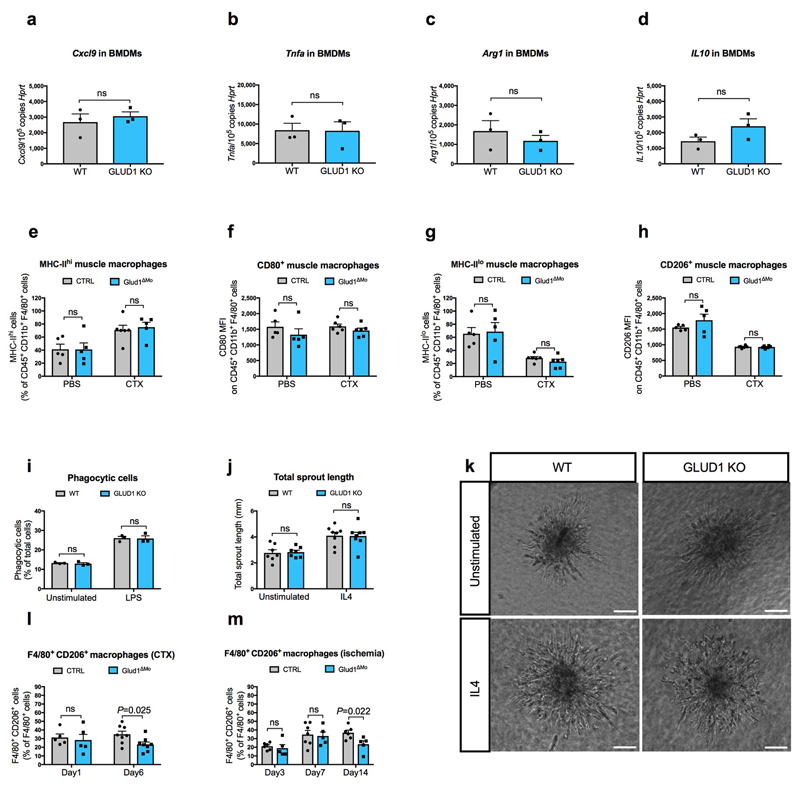
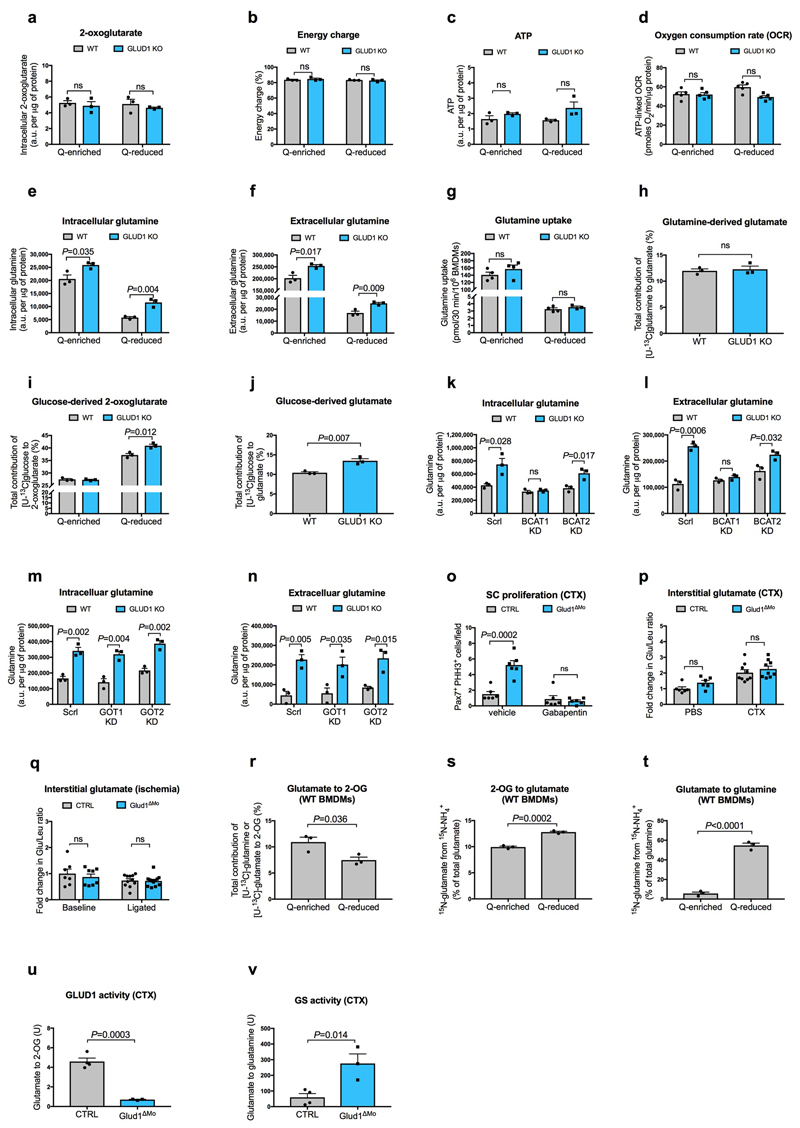
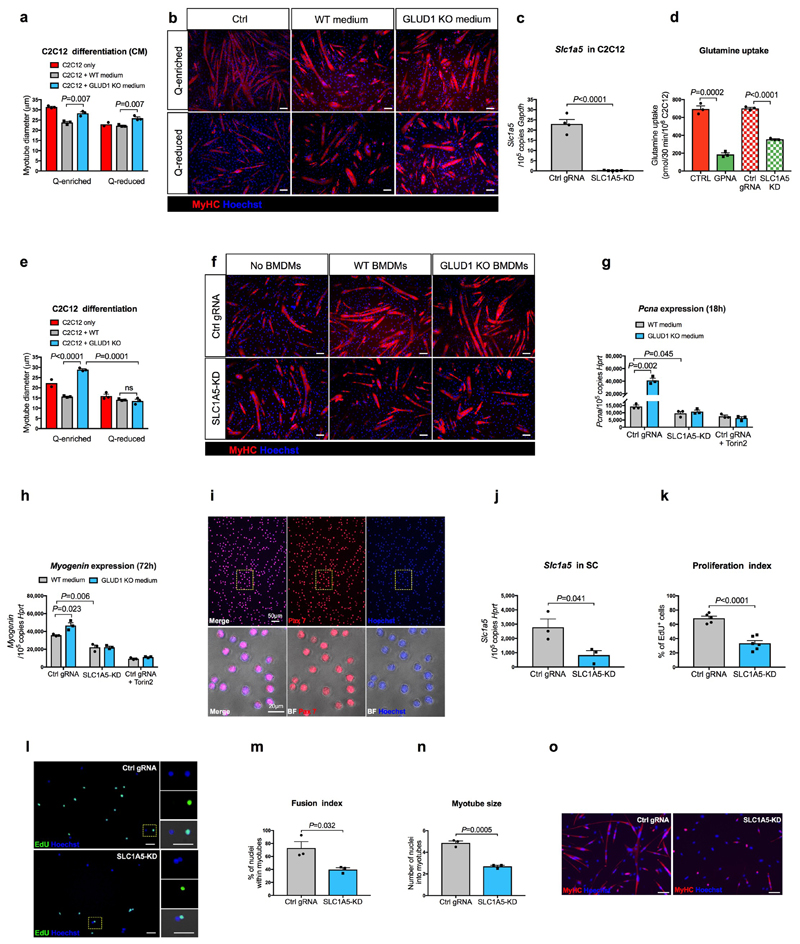
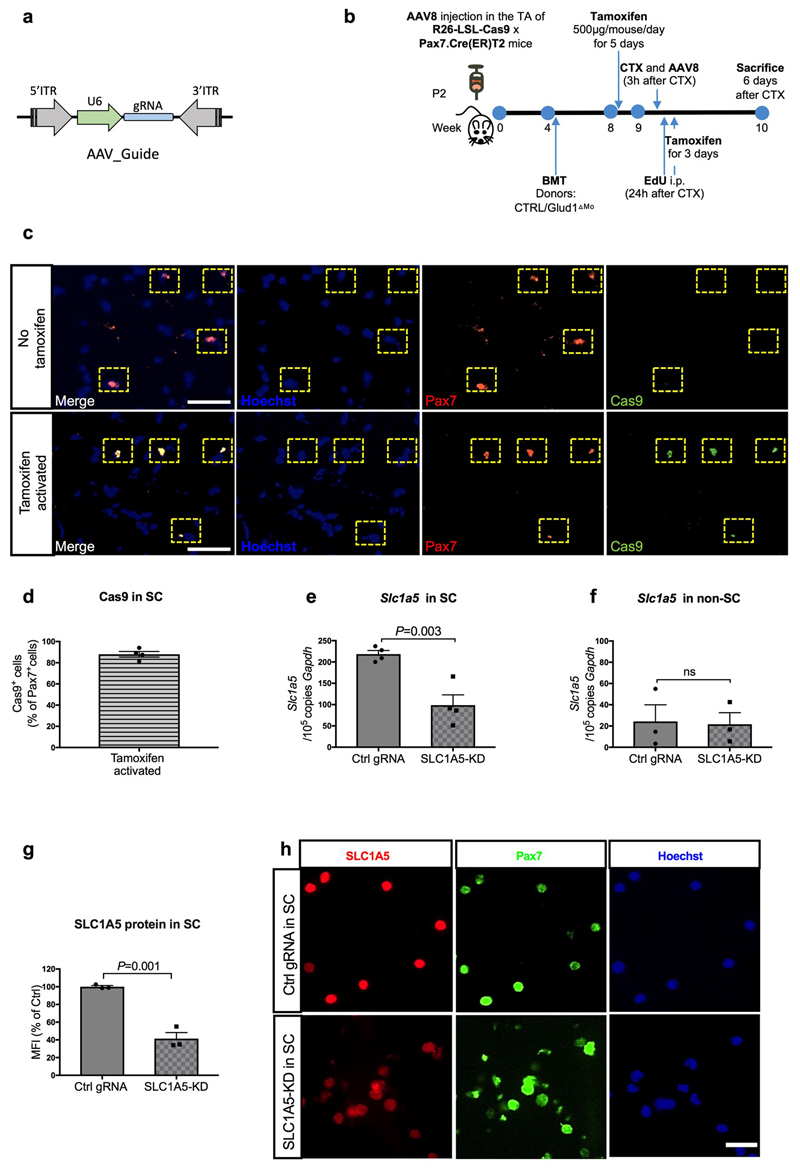
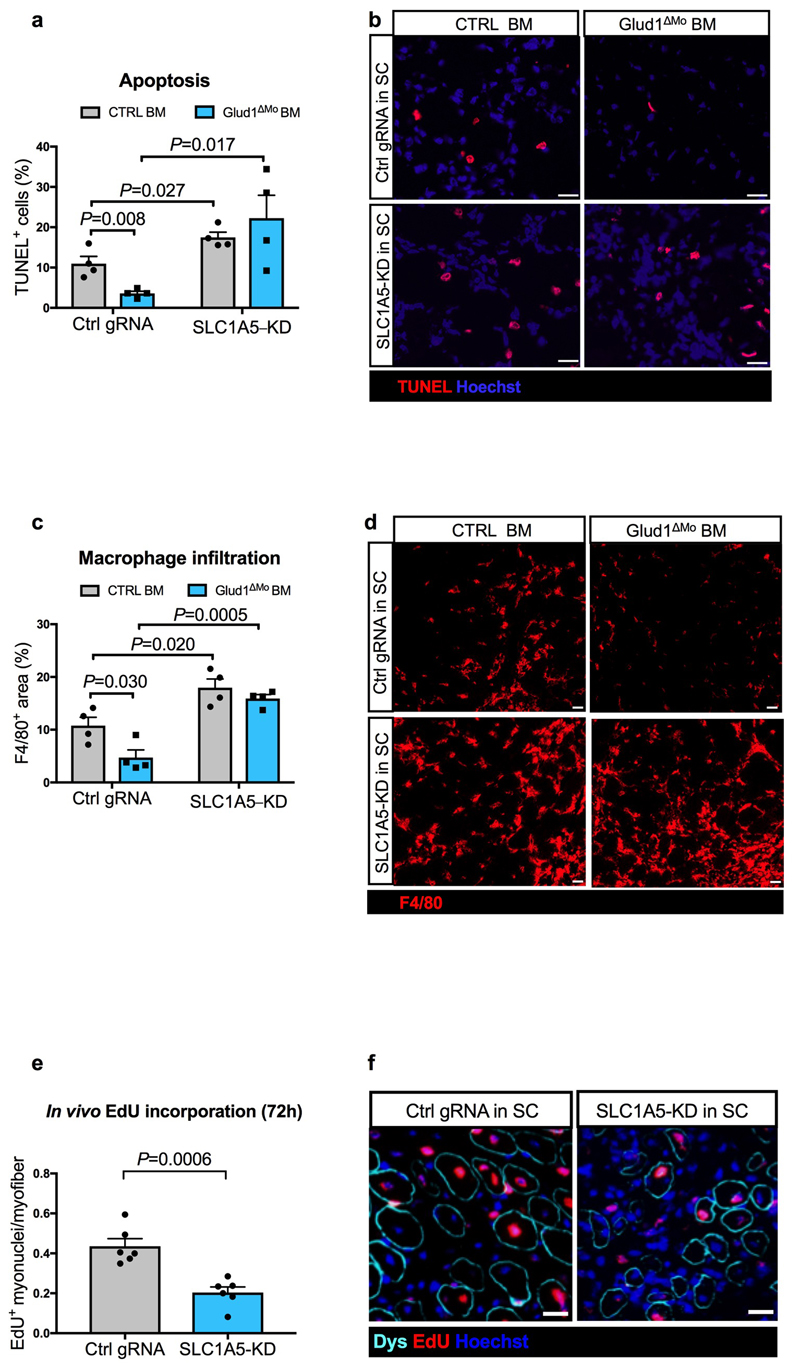
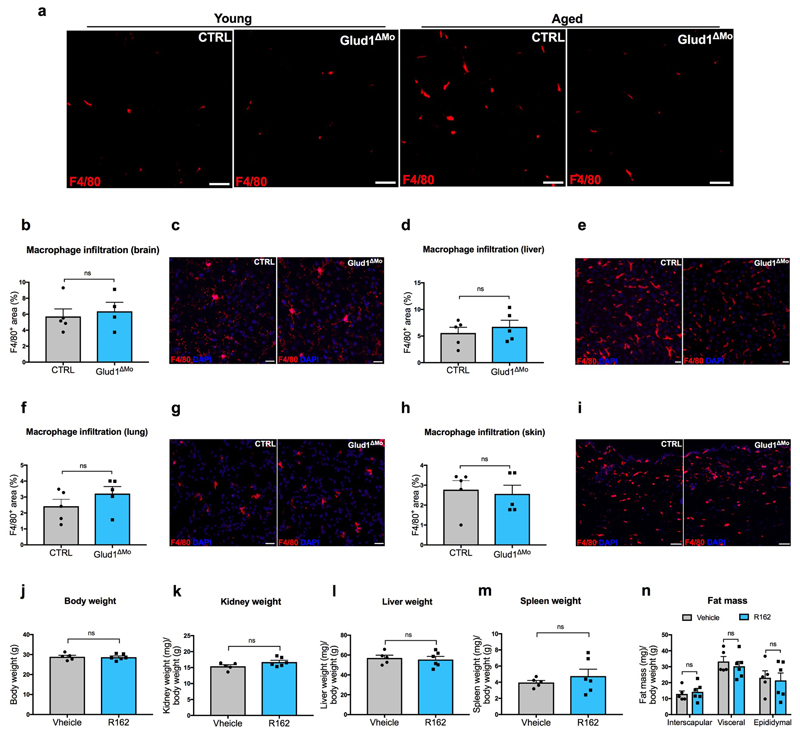
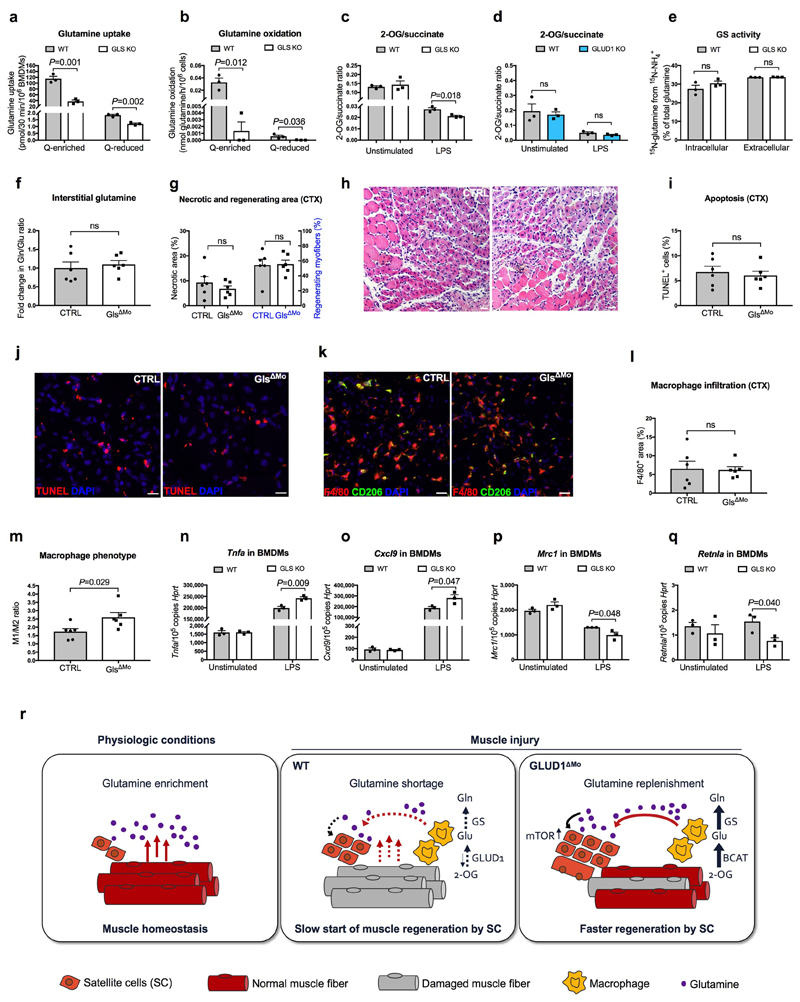
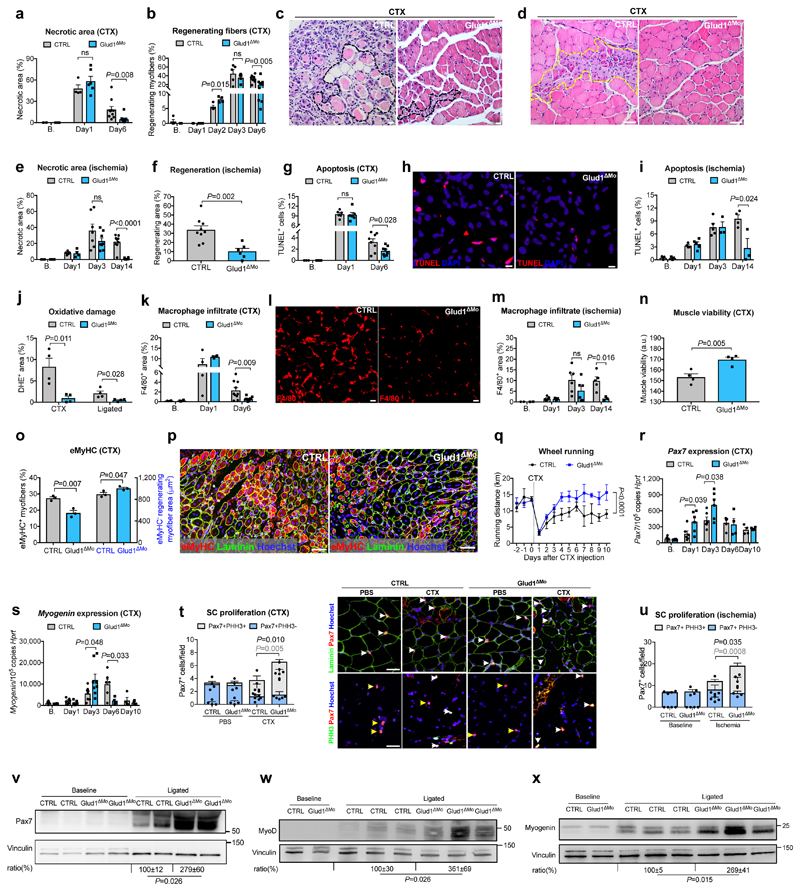
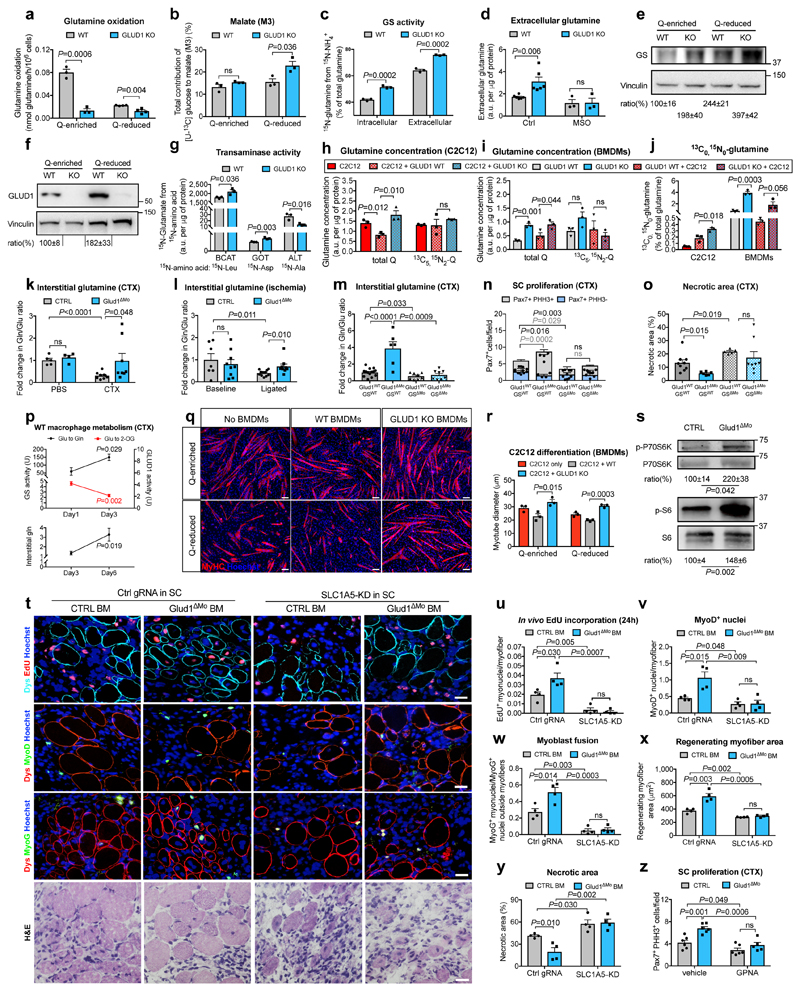
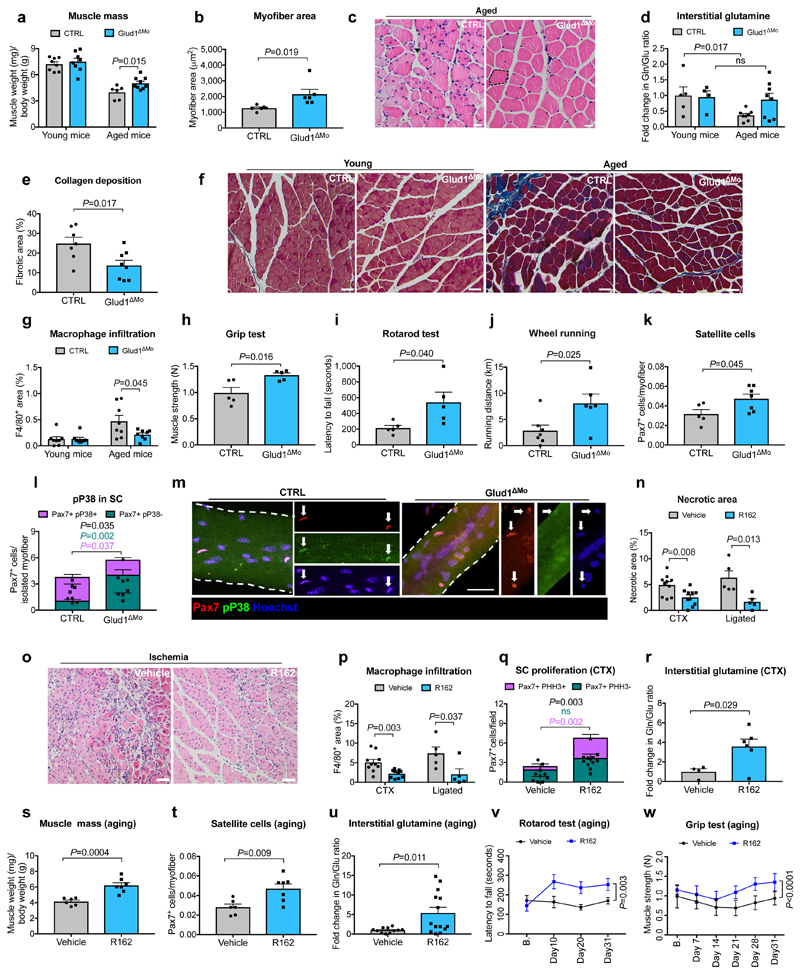
Muscle regeneration is sustained by infiltrating macrophages and the consequent activation of satellite cells1-4. Macrophages and satellite cells communicate in different ways1-5, but their metabolic interplay has not been investigated. Here we show, in a mouse model, that muscle injuries and ageing are characterized by intra-tissue restrictions of glutamine. Low levels of glutamine endow macrophages with the metabolic ability to secrete glutamine via enhanced glutamine synthetase (GS) activity, at the expense of glutamine oxidation mediated by glutamate dehydrogenase 1 (GLUD1). Glud1-knockout macrophages display constitutively high GS activity, which prevents glutamine shortages. The uptake of macrophage-derived glutamine by satellite cells through the glutamine transporter SLC1A5 activates mTOR and promotes the proliferation and differentiation of satellite cells. Consequently, macrophage-specific deletion or pharmacological inhibition of GLUD1 improves muscle regeneration and functional recovery in response to acute injury, ischaemia or ageing. Conversely, SLC1A5 blockade in satellite cells or GS inactivation in macrophages negatively affects satellite cell functions and muscle regeneration. These results highlight the metabolic crosstalk between satellite cells and macrophages, in which macrophage-derived glutamine sustains the functions of satellite cells. Thus, the targeting of GLUD1 may offer therapeutic opportunities for the regeneration of injured or aged muscles.


Conflict of interest statement

Competing Financial Interests

No competing financial interests to declare.

Figures

Extended Data Figure 1
Extended Data Figure 1. Infiltrating GLUD1-deficient macrophages improve muscle repair.
a, WB for GLUD1 in BMDMs from CTRL and Glud1ΔMo mice. Vinculin was used as loading control. Representative image of 3 independent blots. b,c, RT-qPCR of Glud1 in F4/80+ macrophages (b), and Glud1 in Ly6G+ neutrophils (c), sorted from TA muscles 1 day post-CTX (n=4). d, Monocyte-derived macrophages (F4/80+ GFP-) and tissue-resident macrophages (F4/80+ GFP+) in TA muscles 1day post-CTX. Injured mice were CD68.eGFP transgenic mice reconstituted with WT (WT→CD68.eGFP) (n=3) or Glud1ΔMo bone marrow cells (Glud1 KO→CD68.eGFP) (n=4). e, Necrotic area on H&E stained sections from TA muscles 6 days post-CTX. Injured mice were CD68.eGFP transgenic mice reconstituted with WT (WT→CD68.eGFP) or Glud1ΔMo bone marrow cells (KO→CD68.eGFP) (n=6). Baseline: WT→CD68.eGFP (n=3); KO→CD68.eGFP (n=4). f, RT-qPCR of Glud1 in F4/80+ macrophages, sorted from spleens upon tamoxifen-induced macrophage-specific Glud1 deletion in Glud1L/L;CSF1R:Cre-ERT mice (L/L in short); tamoxifen injected littermates (Glud1L/L and negative for CSF1R:Cre-ERT; WT in short) were used as controls (n=5). g-i, Quantification of necrosis (g), apoptosis (h), and regenerating fibers (i), from TA muscles 6 days post-CTX in tamoxifen-injected Glud1 L/L;CSF1R:Cre-ERT (L/L) mice and littermate controls (Glud1 L/L and negative for CSF1R:Cre-ERT; WT in short) (n=6). j-l, Quantification of proliferating (Ki67-expressing) SC in TA muscles (j) 1 day post-CTX injury (CTR n=4, Glud1ΔMo n=5), with representative images (k), or in crural muscles (l) 3 days post-ligation (n=5). The yellow arrows indicate Pax7+ Ki67- cells, and the white arrows indicate Pax7+ Ki67+ cells. m,n, WB for Pax7 in TA muscles lysates (m) from CTRL or Glud1ΔMo mice 1 day post-CTX (n=4), and densitometric quantification (n). Vinculin was used as loading control. Numbers represent fold change vs. Vinculin. o-u, FACS quantification of total CD45+ leukocytes (o), F4/80+ macrophages (p), Ly6G+ neutrophils (q), TCR)+ total T cells (r), CD4+ T cells (s), CD8+ cytotoxic T cells (t), and CD45R+ B cells (u), in TA muscles at baseline or 1 day post-CTX (n=3). v, Laser Doppler analysis 1, 3, 6, 9 and 13 days post-ligation (CTRL n=5 for all the time points; Glud1ΔMo Day0/1/3/6 n=4, Day9/13 n=3). Toe perfusion of non-ligated control was defined as 100%. w, Quantification of vessel density in crural muscles 14 days post-ligation (CTRL n=5; Glud1ΔMo n=3). A representative (everywhere except for n) or a pool (n) of at least two independent experiments is shown. Unpaired two-tailed t-test was everywhere applied; ns, not significant (P>0.05). Scale bars: 50 μm (k). Graphs show mean ± SEM.
Extended Data Figure 2
Extended Data Figure 2. GLUD1 loss in macrophages does not alter either their recruitment or M1/M2/wound-healing gene expression patterns.
a, Crystal-violet-stained bone-marrow derived macrophages (BMDMs), migrating towards CCL21, CCL2 or PBS (Uns) in glutamine (Q)-enriched or Q-reduced media (n=3). b,c, Quantification (b) and representative images (c) of F4/80 staining in ear-sections with acetone (vehicle) or upon phorbol ester (TPA)-induced cutaneous rash, 3 days and 8 days after TPA applying (Vehicle n=4; TPA Day3 n=6,5 CTRL and Glud1ΔMo, respectively; TPA Day8 n=4). d, Heatmap analysis of M1 and M2 macrophage gene expression in CD45+ F4/80+ macrophages sorted from TA muscles at baseline and 1 day post-CTX (n=4). e, Heatmap analysis of wound healing gene expression in CD45+ F4/80+ macrophages sorted from TA muscles at baseline and 1 day post-CTX (n=4). a-c experiments show representative values of 2 independent experiments, d-e show values from one single experiment. Unpaired two-tailed t-test was applied in b; ns, not significant (P>0.05). Scale bars: 50 μm (c). Graphs show mean ± SEM.
Extended Data Figure 3
Extended Data Figure 3. GLUD1 loss in macrophages does not alter either M1/M2 polarization or their related functions.
a-d, RT-qPCR of Cxcl9 (a), Tnfa (b), Arg1 (c), and Il10 (d) in BMDMs isolated from CTRL and Glud1ΔMo mice (n=3). e-h, FACS analysis of different M1 (e, f) or M2 (g, h) polarization states in CD45+ CD11b+ F4/80+ macrophages isolated from TA muscles at baseline (n=5) or 1 day post-CTX (n=6). i, Quantification of macrophage phagocytosis. BMDMs were treated with LPS or PBS (unstimulated) prior to the assay (n=3). j,k, Quantification (j), and representative images (k) of total endothelial sprout length of spheroid containing HUVEC and WT or Glud1ΔMo BMDMs. BMDMs were treated with IL4 prior to the assay; unstimulated BMDMs were used as control (Unstimulated n=7; IL4 n=8). l-m, CD206+ F4/80+ area in TA muscles 1 day (n=5) and 6 days (n=8) post-CTX (l) or in crural muscles 3 days (CTRL n=6; Glud1ΔMo n=5), 7 days (CTRL n=7; Glud1ΔMo n=5) and 14 days (CTRL n=6; Glud1ΔMo n=5) post-ligation (m). All experiments show representative values of at least 2 independent experiments. Unpaired two-tailed t-test was everywhere applied; ns, not significant (P>0.05). Scale bars: 50 μm (k). Graphs show mean ± SEM.
Extended Data Figure 4
Extended Data Figure 4. GLUD1 loss in macrophages enhances GS-mediated glutamine release.
a, Quantification (by GC-MS) of intracellular 2-oxoglutarate content in BMDMs cultured in Q-enriched or Q-reduced media (n=3). b,c, LC-MS measurement of total cellular energy charge ([ATP + 1/2ADP]/[ATP + ADP + AMP]) (b) and ATP content (c) in BMDMs (n=3). d, Oxygen consumption rate (OCR) in BMDMs (n=5). e-f, Quantification of intracellular (e) and extracellular (f) glutamine content in BMDMs cultured in Q-enriched or Q-reduced media (n=3). g, [U-14C]-glutamine uptake in BMDMs cultured in Q-enriched (n=4) or Q-reduced (WT n=4; Glud1ΔMo n=3) media. h, Evaluation of [U-13C]-glutamine-derived carbon incorporation into glutamate in BMDMs (n=3). i-j, Evaluation of [U-13C]-glucose-derived carbon incorporation levels into 2-oxoglutarate (i) and glutamate (j) in BMDMs (n=3). k-l, Quantification of intracellular (k) and extracellular (l) glutamine content in BMDMs upon silencing of BCAT1 or BCAT2 (n=3). m-n, Quantification of intracellular (m) and extracellular (n) glutamine content in BMDMs upon silencing of GOT1 or GOT2 (n=3). o, Quantification of SC on TA muscles 1 day post-CTX injury, stained for PHH3 and Pax7. CTRL and Glud1ΔMo mice were treated 2 times per day with the BCAT1 inhibitor Gabapentin, or vehicle as control (n=6). p, Fold change in glutamate to leucine ratio in the interstitial fluid of TA muscles 1day post-CTX, relative to PBS-injected CTRL muscle (PBS n=6; CTX n=9). q, Fold change in glutamate to leucine ratio in the interstitial fluid of crural muscles 3 days post-ligation, relative to CTRL baseline muscle (Baseline n=7,8 CTRL, Glud1ΔMo, respectively; ligated n=11,12 CTRL, Glud1ΔMo, respectively). r, Evaluation of the conversion of glutamate to 2-OG by analyzing [U-13C]-glutamine (Q-enriched condition) or [U-13C]-glutamate (Q-reduced condition) incorporation into 2-OG in WT BMDMs (n=3). s, Evaluation of the conversion of 2-OG to glutamate by analyzing 15NH4 + incorporation into glutamate in WT BMDMs (n=3). t, Evaluation of glutamine synthetase (GS) activity by analyzing 15NH4 + incorporation into glutamine in BMDMs (n=3). u,v, Evaluation of the conversion of GLUD1 activity (u), and glutamine synthetase (GS) activity (v), in muscle-infiltrating macrophages, sorted 1 day post-CTX. One unit for the conversion of glutamate to 2-OG is the amount of enzyme that will generate 1 μmole of NADH per minute at pH 7.6 at 37°C. One unit of GS activity is defined as the enzyme producing 1 nmole of gamma-glutamyl hydroxamic acid per minute (CTRL n=4; Glud1ΔMo n=3). The control condition (CTRL) in u,v is the same one displayed in Fig. 2p at day 1. All experiments (except for o) show representative values of at least 2 independent experiments, o shows values from one single experiment. Unpaired two-tailed t-test was everywhere applied; ns, not significant (P>0.05); a.u., arbitrary unit. Graphs show mean ± SEM.
Extended Data Figure 5
Extended Data Figure 5. Harnessing glutamine uptake in vitro.
a,b, Quantifications (a) and representative images (b) of myotube diameter in C2C12 cells cultured in BMDM-conditioned media (CM) (n=3 except for Q-reduced C2C12 where n=2). c, RT-qPCR of SLC1A5 knockdown efficiency in C2C12 cells. Cells were transduced with a LV co-expressing Cas9 and a gRNA targeting the Slc1a5 locus (SLC1A5-KD) (n=5) or a non-targeting control gRNA (Ctrl gRNA) (n=4). d, [U-14C]-glutamine uptake in SLC1A5-deficient C2C12 cells (SLC1A5 KD) generated by coexpressing Cas9 along with a gRNA targeting the Slc1a5 locus. Parental cells (CTRL) and cells transduced with a non-targeting control gRNA (Ctrl gRNA) were used as negative controls. C2C12 cells treated with SLC1A5 inhibitor gamma-L-Glutamyl-p-Nitroanilide (GPNA) were used as a positive control (n=3). e-f, Quantification (e) and representative images (f) of myotube diameter in control or SLC1A5-KD C2C12 cells co-cultured with BMDMs under glutamine deprivation (n=3 except Ctrl C2C12 n=2). g, RT-qPCR analysis of the proliferation marker Pcna in control or SLC1A5-KD C2C12 cells, or control C2C12 treated with the mTOR inhibitor Torin2, cultured for 18 hours in BMDM-conditioned, Q-reduced growth media, where the only glutamine present comes from WT or GLUD1 KO BMDMs. A non-targeting control gRNA (Ctrl gRNA) was used as control (n=3). h, RT-qPCR analysis of the differentiation marker Myogenin in control or SLC1A5-KD C2C12 cells, or control C2C12 treated with the mTOR inhibitor Torin2, cultured for 72 hours in BMDM-conditioned, Q-reduced differentiation media, where the only glutamine present comes from WT or GLUD1 KO BMDMs. A non-targeting control gRNA (Ctrl gRNA) was used as control (n=3). i, Representative images of an immunofluorescence for Pax7 on a pure SC population, freshly isolated from hindlimb muscles of WT mice. j, RT-qPCR for Slc1a5 in SC, transduced with the same LV as above. The graph shows values of 3 biological repetitions per condition. k-l, Quantification (k) and representative images (l) of EdU by immunofluorescence in control or SLC1A5-KD SC. A non-targeting control gRNA (Ctrl gRNA) was used as a control (Ctrl gRNA n=5; SLC1A5-KD n=6). m-o, Quantification (m,n) and representative images (o) of fusion index and myotube size in control or SLC1A5-KD SC 5 days of culture in differentiation media. A non-targeting control gRNA (Ctrl gRNA) was used as a control. The graph shows values of 3 biological repetitions per condition. All experiments show representative values of at least 2 independent experiments. Unpaired two-tailed t-test was everywhere applied; ns, not significant (P>0.05). Scale bars: 50 μm (b,f,l); 100 μm (o). Graphs show mean ± SEM.
Extended Data Figure 6
Extended Data Figure 6. Selective and inducible knockdown of Slc1a5 in SC.
a, Schematic representation of the AAV8 expression vector for in vivo targeting of SC. U6, Pol III promoter driving the expression of the gRNA targeting the Slc1a5 locus or a non-targeting control gRNA. Since the mice used in this experiment are LSL-Cas9 x PAX7:Cre-ERT mice, Cas9 is exclusively activated in Pax7+ cells upon tamoxifen administration and, genome editing of the Slc1a5 locus will occur selectively in SC. b, Schematic overview of an AAV8-based CRISPR/Cas9-mediated in vivo genome editing. c-d, Representative images (c) and quantification (d) for Pax7 and Cas9 staining on uninjured muscles before and after tamoxifen administration (n=4). e-f, RT-qPCR for Slc1a5 in freshly isolated SC (n=4) (e) and all other mononuclear cells (non-SC) (n=3) (f) upon in vivo genome editing of the Slc1a5 locus (SLC1A5-KD) specific in SC. Non-targeting control gRNA (Ctrl gRNA) was used as a control. g-h, Quantification (g) and representative images (h) of SLC1A5 and Pax7 stainings on freshly isolated SC, upon in vivo genome editing of the Slc1a5 locus (SLC1A5-KD) specific in SC (n=3). All experiments show representative values of at least 2 independent experiments. Unpaired two-tailed t-test was everywhere applied; ns, not significant (P>0.05). Scale bars: 50 μm (c); 20 μm (h). Graphs show mean ± SEM.
Extended Data Figure 7
Extended Data Figure 7. Slc1a5 knockdown in SC impairs the recovery of the muscle from CTX-induced damage.
a-d, Quantification of TUNEL+ cells (a), F4/80+ area (c) and representative images (b,d) respectively, in TA muscle 6 days post-CTX obtained from LSL-Cas9 x PAX7:Cre-ERT mice treated with an AAV8 vector encoding for Ctrl gRNA (Ctrl gRNA) or Slc1a5 gRNA (SLC1A5-KD) (n=4). e,f, Quantification (e) and representative images (f) of EdU+ myonuclei in TA muscle 6 days post-CTX, upon in vivo genome editing of the Slc1a5 locus (SLC1A5-KD) specific in SC. EdU was given by i.p. injection at 24h, 48h and 72h after CTX injection (n=6). a-d show representative values of 2 independent experiments, e-f show values of 1 experiment. Unpaired two-tailed t-test was everywhere applied; ns, not significant (P>0.05). Scale bars: 20 μm (b,d,f). Graphs show mean ± SEM.
Extended Data Figure 8
Extended Data Figure 8. Macrophage-specific genetic deletion or pharmacologic inhibition of GLUD1 alters only the basal inflammation and weight of muscle tissue in aged mice.
a, Representative images of F4/80+ area in crural muscles of young and aged mice. b-i, Quantification and representative images of F4/80+ area in brain (b,c), liver (d,e), lung (f,g), and skin (h,i) of aged mice (n=5 except in b for Glud1ΔMo n=4). j-n, Body weight (j) and mass to body weight ratio of kidney (k), liver (l), spleen (m), and fat tissues (n) of aged mice upon R162 treatment (CTRL n=5; Glud1ΔMo n=6). a-i show representative values of at least 2 independent experiments, j-n show values of 1 experiment. Unpaired two-tailed t-test was everywhere applied, ns, not significant (P>0.05). Scale bars: 50 μm (a,i); 20 μm (c,e,g). Graphs show mean ± SEM.
Extended Data Figure 9
Extended Data Figure 9. GLS loss in macrophages is not advantageous for muscle repair.
a,b, [U-14C]-glutamine uptake (a) and glutamine oxidation (b) in WT or GLS KO BMDMs cultured with Q-enriched or Q-reduced media (n=3). c,d, 2-oxoglutarate (2-OG) to succinate ratio in WT or GLS KO BMDMs (c) and 2-OG to succinate ratio in WT or GLUD1 KO BMDMs (d). BMDMs were treated with 50ng/mL LPS or PBS (unstimulated) prior to the assay (n=3). e, Evaluation of GS activity by analyzing the percentage of the 15NH4 +-derived ammonia incorporation levels into glutamine in BMDMs isolated from CTRL and Gls ΔMo mice (n=3). f, Fold change in glutamine to glutamate ratio in the interstitial fluid of TA muscle 1 day post-CTX, relative to PBS injected CTRL muscle (n= 6). g,h, Quantification of necrotic (right side of the graph) and regenerating (left side of the graph) areas on H&E-stained sections from TA muscles 6 days post-CTX (n= 6) (g) and representative images (h). i,j, Quantification (i) and representative images (j) of TUNEL+ cells in TA muscle 6 days post-CTX (n=6). k-m, Representative images (k) and quantification of F4/80+ area (l), CD206- F4/80+ cells (M1) to CD206+ F4/80+ cells (M2) ratio (m) in TA muscles 6 days post-CTX (n=6). n-q, RT-qPCR of Tnfa (n), Cxcl9 (o), Mrc1 (p) and Retnla (q) in BMDMs isolated from CTRL and GlsΔMo mice. BMDMs were treated with LPS or PBS (unstimulated) prior to the assay (n=3). r, Scheme illustrating the physiological role of Glud1 in macrophages in response to muscle damage. During muscle disruption, ischemia or aging, interstitial glutamine drops likely because of the loss in myofibers (a major glutamine source) and poor blood supply. Infiltrating macrophages respond to glutamine starvation by reducing their oxidative GLUD1 activity in favour of GS activity. Macrophage-derived glutamine is released and progressively fills the muscle interstitium, where it is uptaken by SC promoting their proliferation and differentiation into new fibers, two processes that are favoured by glutamine-dependent mTOR activation. Towards the end of this regenerative process, the newly generated fibers will undertake glutamine production while inflammation will be progressively resolved. GLUD1-deficient macrophages are metabolically pre-adapted towards glutamine synthesis and release, thus preventing this glutamine drop. It follows that, in case of muscle damage, macrophage-specific knockout of Glud1 or pharmacologic GLUD1 blockade strengthens SC activation, ultimately leading to therapeutic muscle regeneration. All experiments show representative values of at least 2 independent experiments. Unpaired two-tailed t-test was everywhere applied; ns, not significant (P>0.05). Scale bars: 20 μm (h); 10 μm (j,k). Graphs show mean ± SEM.
Figure 1
Figure 1. GLUD1 loss in macrophages boosts SC activation and muscle regeneration.
a-d, Post-CTX muscle necrosis (Baseline,B. n=4; Day1 n=4,6 CTRL,Glud1ΔMo, respectively; Day6 n=10) (a) and regeneration (B. n=4,5; Day1 n=5,6; Day2 n=4; Day3 n=5; Day6 n=10) (b), with micrographs of H&E-stainings at Day6 showing necrotic (black-dotted line) (c) or regenerating (yellow-dotted line) fibers (d). e,f, Post-ligation necrosis (e) and regenerating area (f) 14 days post-ligation (B. n=4; Day1 n=5,4; Day3 n=7,8; Day14 n=9,6). g-i, Post-CTX muscle apoptosis by TUNEL staining (B. n=3; Day1 n=6; Day6 n=8) (g), with micrographs of Day6 (h), or post-ligation (B. n=3; Day1 n=4,5; Day3 n=5,3; Day14 n=4,3) (i). j, Oxidative stress by DHE stainings 6 days post-CTX or 14 days post-ligation (n=4). k-m, F/480+ macrophage infiltration post-CTX (B. n=4; Day1 n=4; Day6 n=10) (k), with micrographs of Day6 (I), or post-ligation (B. n=2; Day1 n=5; Day3 n=6; Day14 n=5,3) (m). n, Muscle viability (TTC staining) 6 days post-CTX (n=4). o,p, eMyHC+ myofibers (left) and eMyHC- regenerating myofibers area (right) over cross-section area 6 days post-CTX (n=3) (o) and representative micrographs (p). q, Voluntary running (n=5). r,s, RT-qPCR on muscle extracts for Pax7 (B./Day1/Day3 n=6; Day6 n=4; Day10 n=4) (r) and Myogenin (B./Day1 n=6; Day3 n=8; Day6 n=6,4; Day10 n=4) (s). t,u Quiescent (PHH3-) and proliferating (PHH3+) SC at baseline and 1 day post-CTX (n=4,6), with representative micrographs (t), or 3 days post-ligation (n=4) (u). White arrows indicate Pax7+ or Pax7+/PHH3+ cells; yellow arrows, Pax7+/PHH3- cells, v-x, WB on muscle extracts and densitometry for Pax7 (v), MyoD (w), Myogenin (x). A representative (a-u,w,x) or a pool (v) of at least two independent experiments is shown. Unpaired two-tailed t-test everywhere applied except in q (two-way ANOVA); ns, not significant. Bars: 10 μm (h), 20 μm (c, I), 50 μm (d, p, t). Graphs: mean ± SEM.
Figure 2
Figure 2. Uptake of macrophage-derived glutamine by SC boosts muscle regeneration.
a,b, Glutamine oxidation (n=3,4 WT,KO, respectively) (a), pyruvate-carboxylase activity (n=3) (b) in BMDMs under glutamine (Q)-enriched and Q-reduced conditions (n=4,3). c,d, Intra- and extracellular glutamine production (n=3) (c) and glutamine release under MSO-mediated GS inhibition (n=3) (d) in Q-starved BMDMs. e,f, WB and densitometry for GS (e) and GLUD1 (f) in BMDMs. g, BCAT, GOT, ALT activities in Q-starved BMDMs (n=3). h-j, Total glutamine, [13C5 15N2]-glutamine, [13C0 15N0]-glutamine in C2C12 cells (h,j) and BMDMs (i,j), seeded alone or co-cultured in [13C5,15N2]-glutamine-containing medium (n=3). k,l, Interstitial glutamine 1 day post-CTX (Baseline,B. n=5,4 CTRL,Glud1ΔMo, respectively; CTX n=9,8) (k) or 3 days post-ligation (B. n=7,9; ischemia n=12) (I), m-o, Interstitial glutamine and SC proliferation 1 day post-CTX (m,n), necrosis 6 days post-CTX (o) upon macrophagic GS deletion (Glud1WTGSWT n=14,6,9 in m, n, o, respectively; Glud1ΔMoGSWT n=6,4,6; Glud1WTGSΔMo n=8,5,5; Glud1ΔMoGSΔMo n=8,5,8). p, Glutamate-to-2-OG (GLUD1 activity) and glutamate-to-glutamine (GS activity) conversion in muscle-infiltrating WT macrophages (upper panel) and interstitial glutamine in WT muscles (lower panel) (n=4). q,r, C2C12 myotubes in co-culture with BMDMs (n=3). s, WB and densitometry for phospho-P70S6K (1 day post-CTX) and phospho-S6 (3 days post-CTX) in isolated SC. t-y, Micrographs (t) and quantifications (n=4) of EdU+ myonuclei (u), MyoD+ nuclei (v), myoblast fusion (w), regenerating myofiber area (x), necrosis (y) 6-day post-CTX in mice reconstituted with GLUD1-WT (CTRL BM) or GLUD1-KO (Glud1ΔMo) bone marrows (BM), and knocked-down (KD) or not (Ctrl gRNA) for SLC1A5 in SC. z, PHH3+ SC 1 day post-CTX after GPNA-mediated SLC1A5 inhibition (n=6,6,6,5 from right to left). A representative (a-d,g-j,p-r,t-z) or a pool (e,f,k-o,s) of at least two independent experiments is shown. Unpaired two-tailed t-test everywhere applied; ns, not significant; a.u., arbitrary units. Bars: 20 μm (t), 50 μm (q). Graphs: mean ± SEM.
Figure 3
Figure 3. GLUD1 loss or inhibition in macrophages benefits damaged and aged muscles.
a, Gastrocnemius weight (young mice n=8; aged mice n=6,9 CTRL,Glud1ΔMo, respectively). b, c, Quantification (b) and micrographs (c) of fiber area in H&E-stained gastrocnemius sections (aged mice n=6). d, Intra-TA interstitial glutamine (young mice n=5,4; aged mice n=8). e,f, Quantification (e) for collagen deposition (in blue) in crural muscles of aged mice (n=7,8) on Masson’s trichrome stainings (f). g, Macrophage infiltration in crural muscles of young or aged mice (n=8). h-j, Grip strength (n=5) (h), rotarod test (n=5) (i), voluntary running (n=7,6) (j) in aged mice, k, Intra-TA SC density (n=5,7). l-m Pax7 and phospho-P38 in SC, associated to myofibers isolated from extensor digitorum longus muscles of aged mice (n=4). n,o, Muscle necrosis 6 days post-CTX (n=10) or 14 days post-ligation (n=5) upon R162-mediated GLUD1 inhibition (n), and micrographs showing ischemic necrosis (o). p, Macrophage infiltration 6 days post-CTX (n=10) or 14 days post-ligation (n=5). q, PHH3+/- SC 1 day post-CTX (n=5,6). r, Interstitial glutamine 1 day post-CTX (n=4,6). s-w, Gastrocnemius weight (n=6,7) (s), SC number per isolated TA myofiber (n=6,7) (t), interstitial glutamine (n=11,14) (u), rotarod (n=7) (v) and grip strength test (n=7,8) (w) in vehicle and R162-treated aged mice. A representative of at least two independent experiments is shown in a-r. Unpaired two-tailed t-test everywhere applied except in v and w (two-way ANOVA); ns, not significant. Scale bars: 20 μm (c, f, m, o). Graphs: mean ± SEM.

Comment in

References

    1. Bentzinger CF, Wang YX, Dumont NA, Rudnicki MA. Cellular dynamics in the muscle satellite cell niche. EMBO reports. 2013;14:1062–1072. - PMC - PubMed
    1. Costamagna D, Berardi E, Ceccarelli G, Sampaolesi M. Adult Stem Cells and Skeletal Muscle Regeneration. Current gene therapy. 2015;15:348–363. - PubMed
    1. Saclier M, Cuvellier S, Magnan M, Mounier R, Chazaud B. Monocyte/macrophage interactions with myogenic precursor cells during skeletal muscle regeneration. Febs J. 2013;280:4118–4130. - PubMed
    1. Saclier M, et al. Differentially activated macrophages orchestrate myogenic precursor cell fate during human skeletal muscle regeneration. Stem cells. 2013;31 384396. - PubMed
    1. Tidball JG. Regulation of muscle growth and regeneration by the immune system. Nature reviews. Immunology. 2017;17:165–178. - PMC - PubMed

Publication types

MeSH terms