. 2020 Nov;587(7834):455-459.
doi: 10.1038/s41586-020-2866-8. Epub 2020 Oct 28.

Enteric neurons increase maternal food intake during reproduction

Affiliations

Enteric neurons increase maternal food intake during reproduction

Dafni Hadjieconomou et al. Nature. 2020 Nov.

Erratum in

Abstract

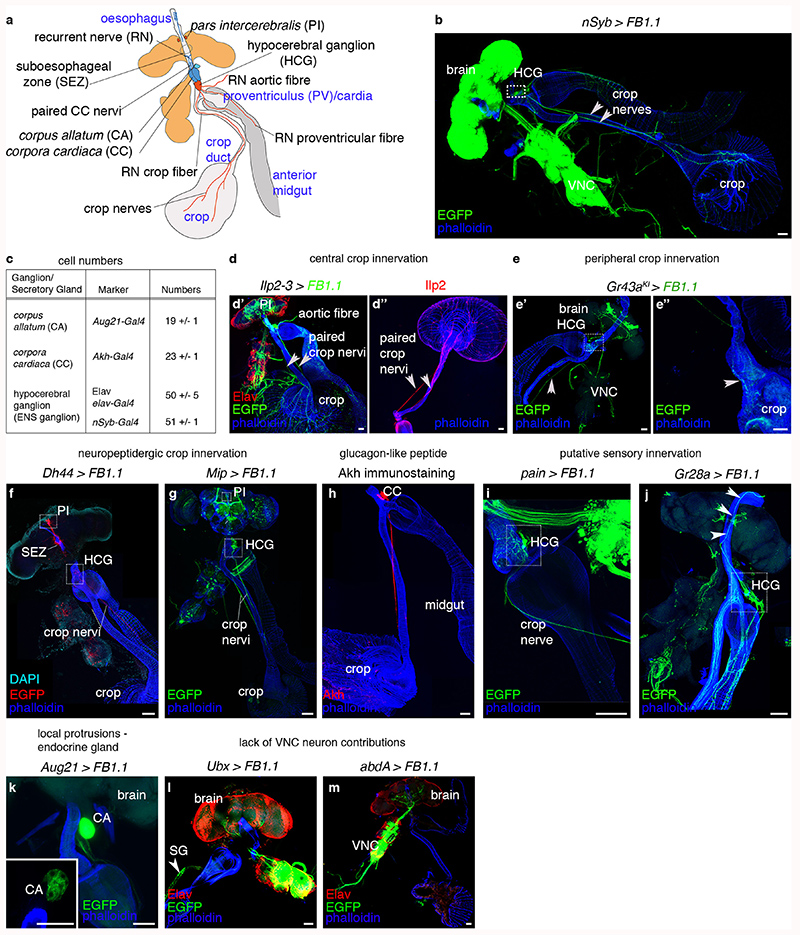
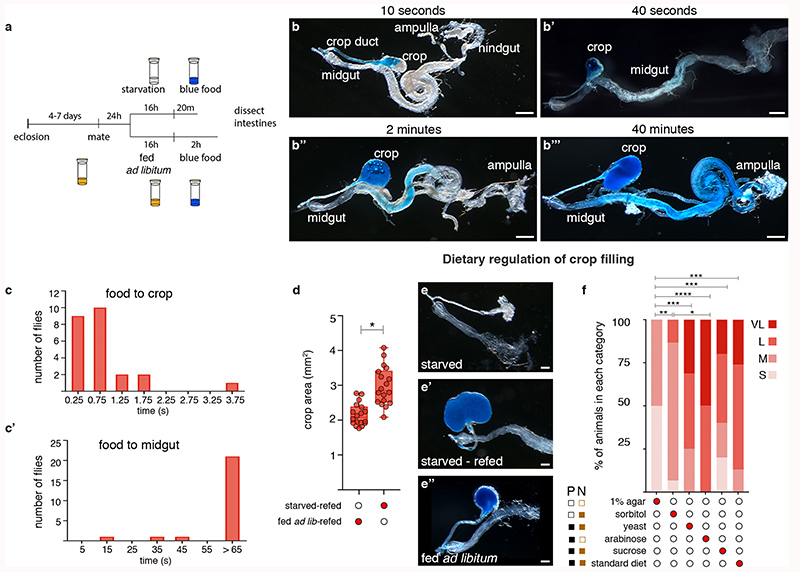
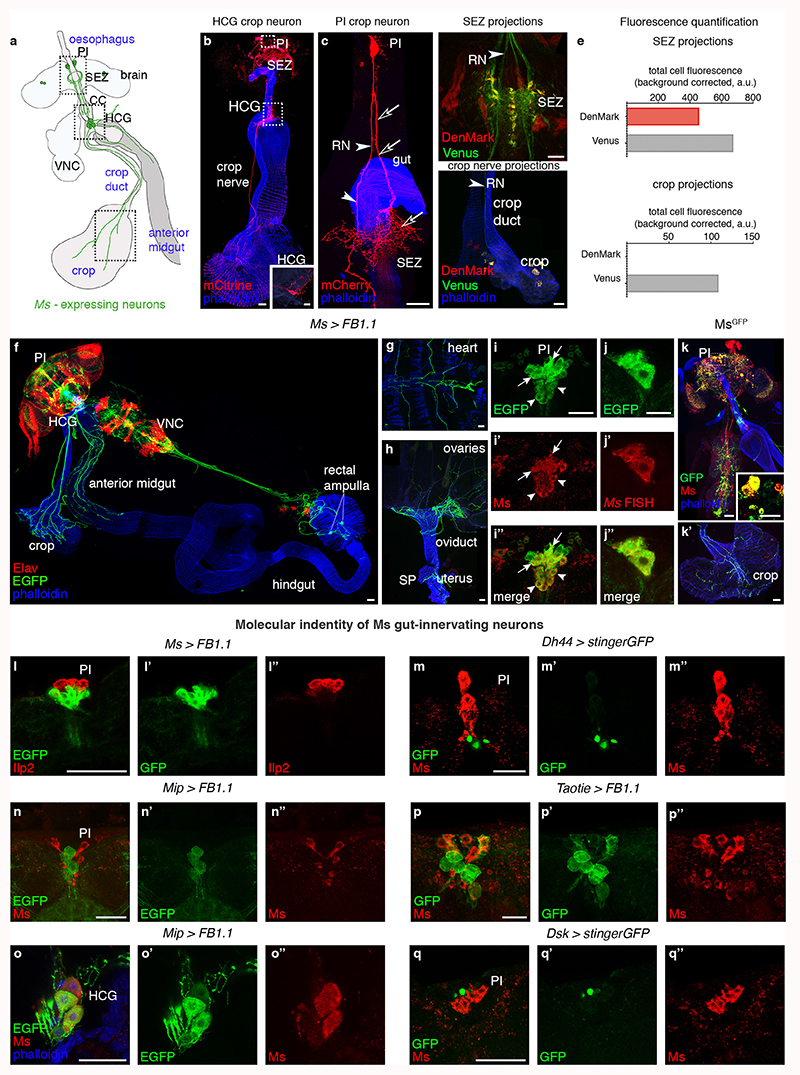
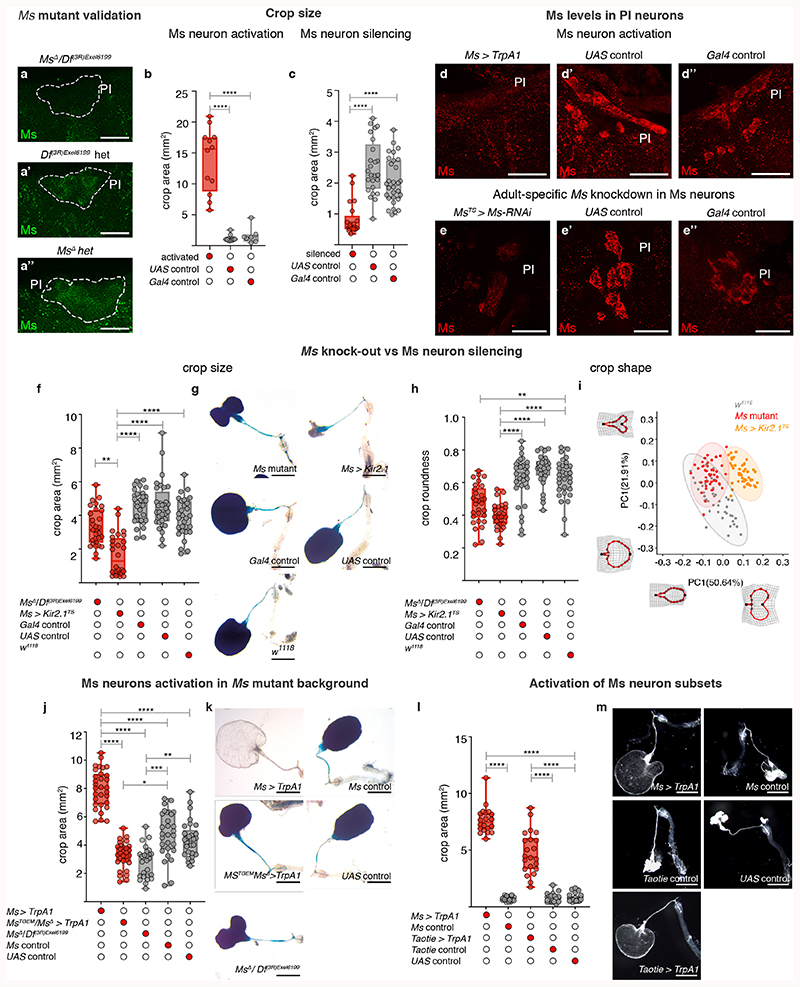
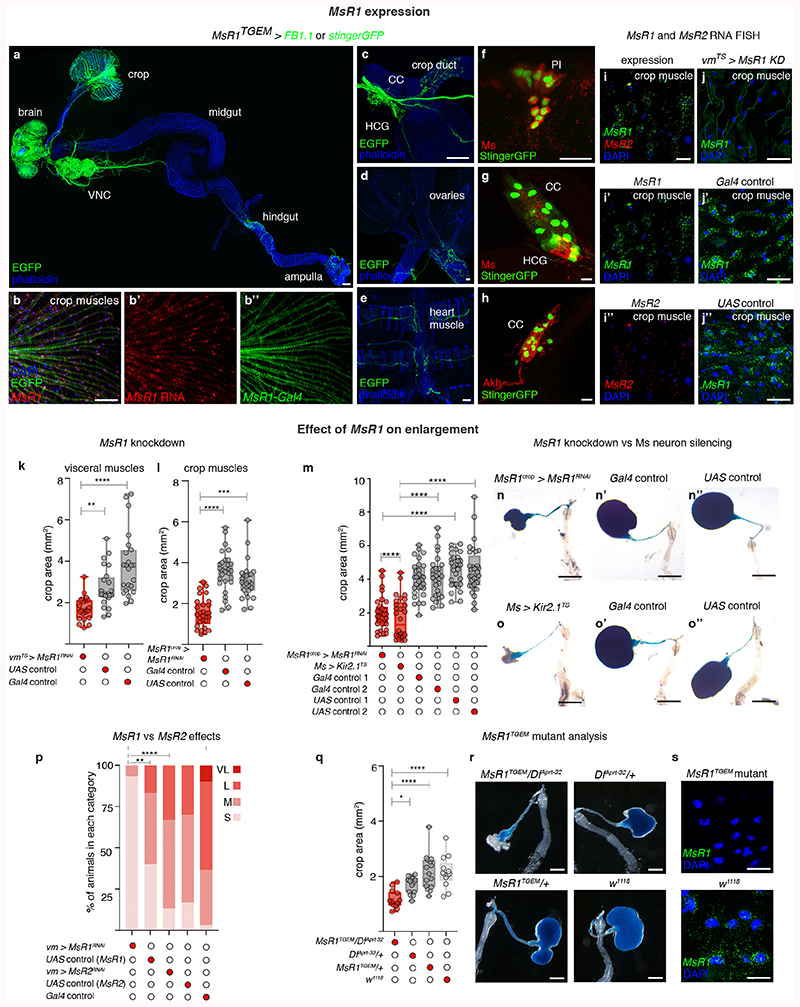
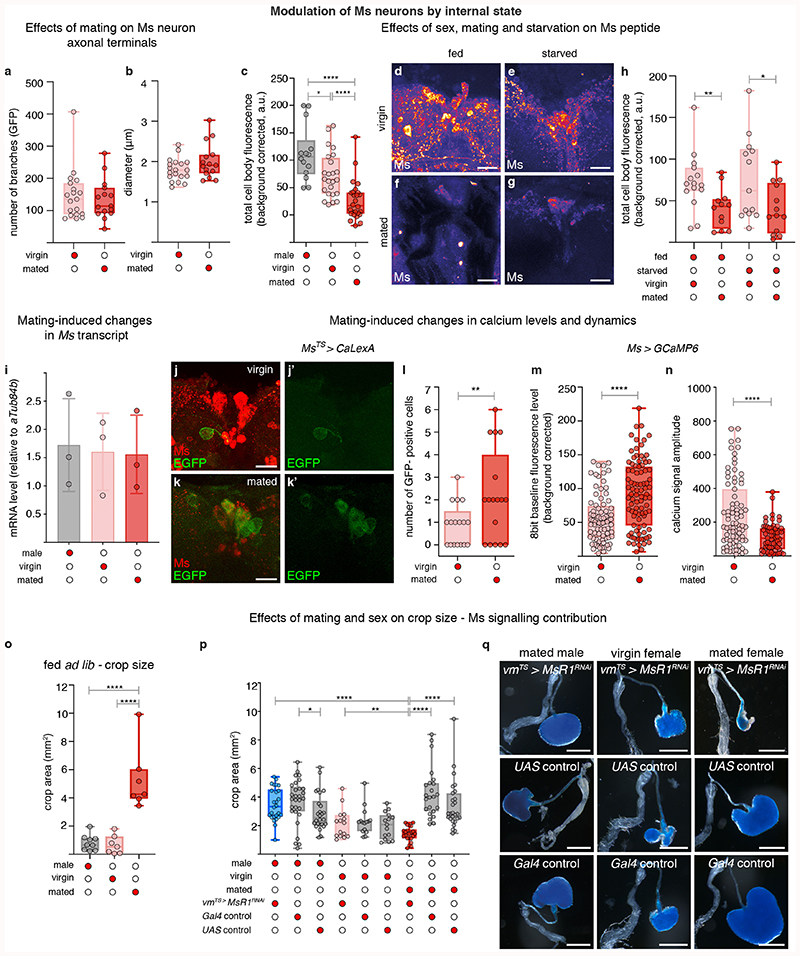
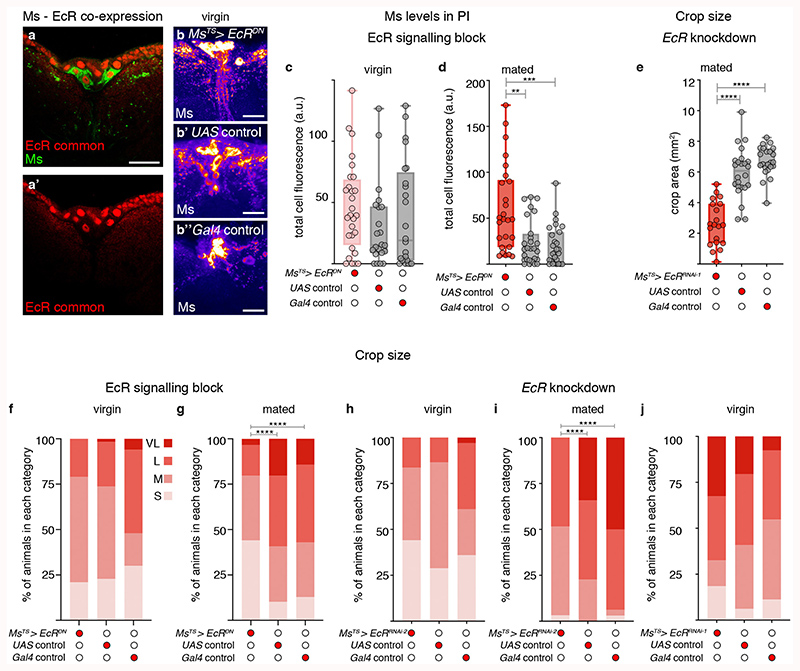
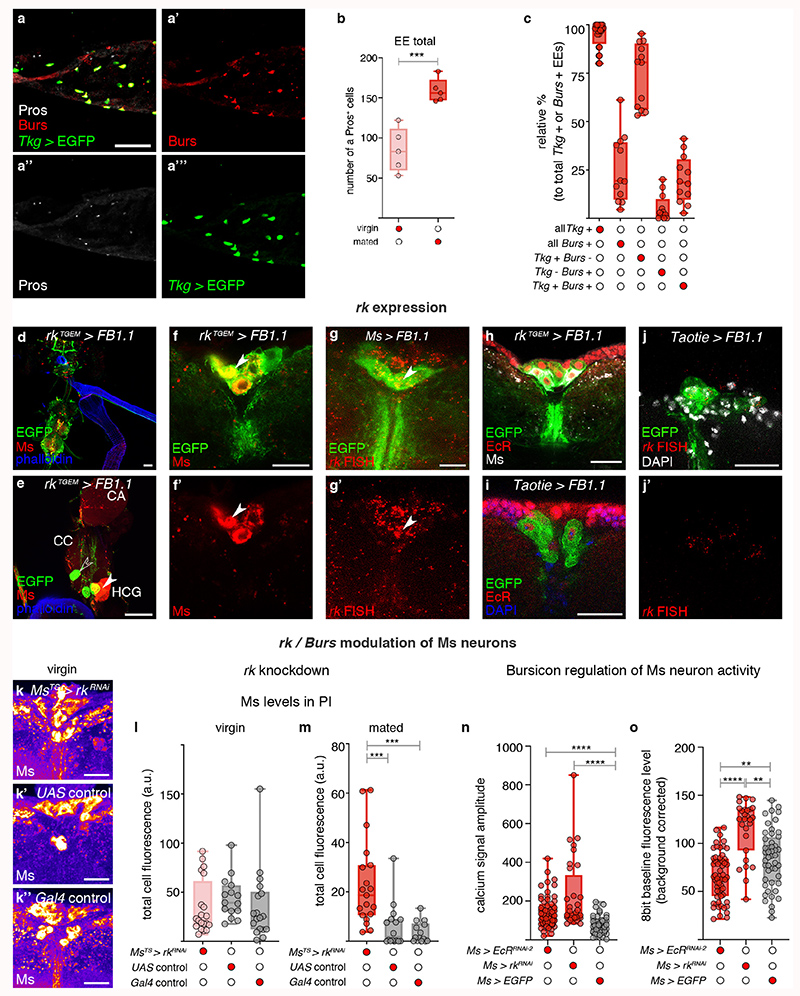
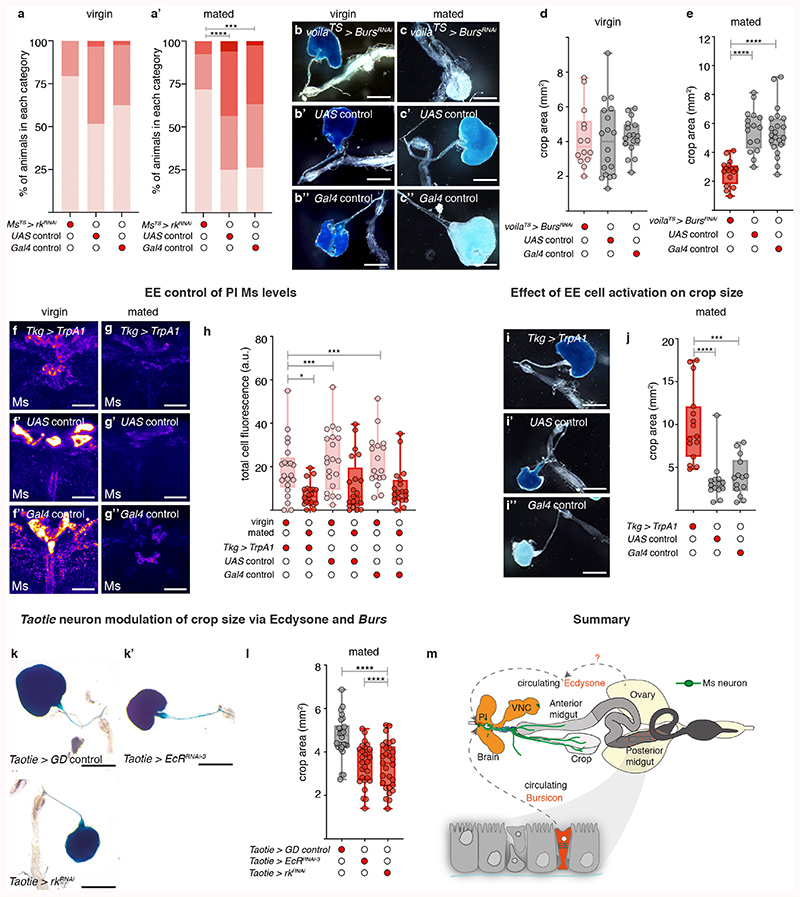
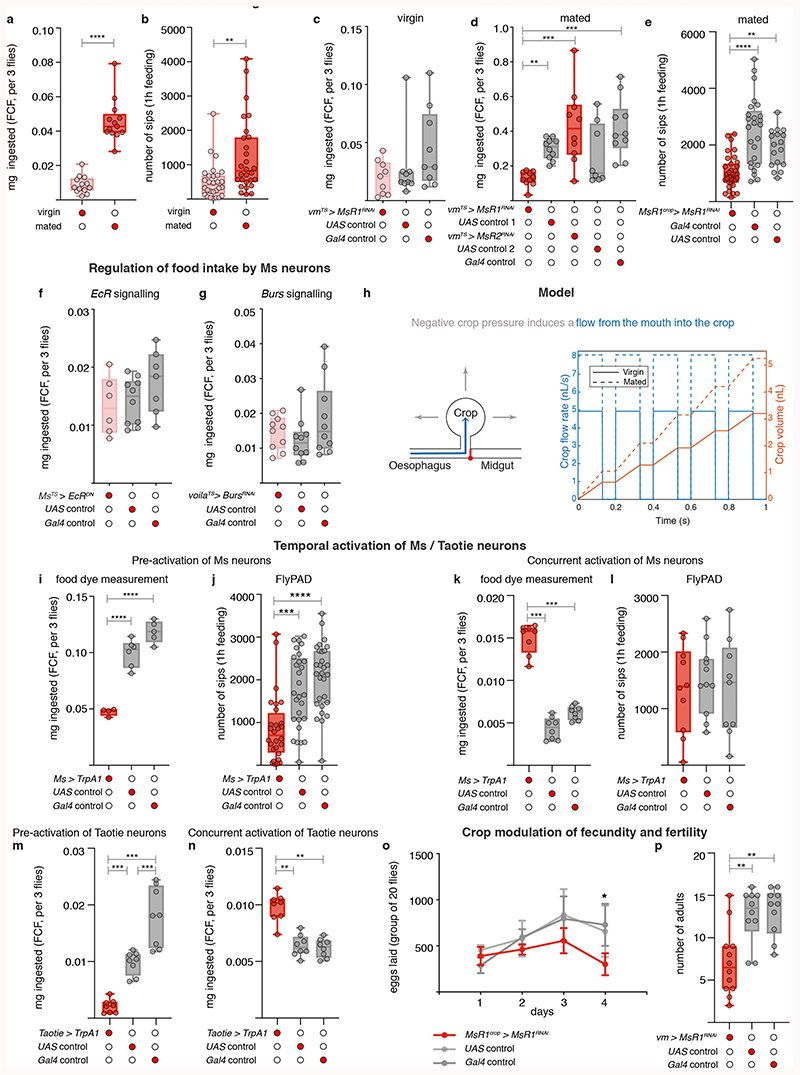
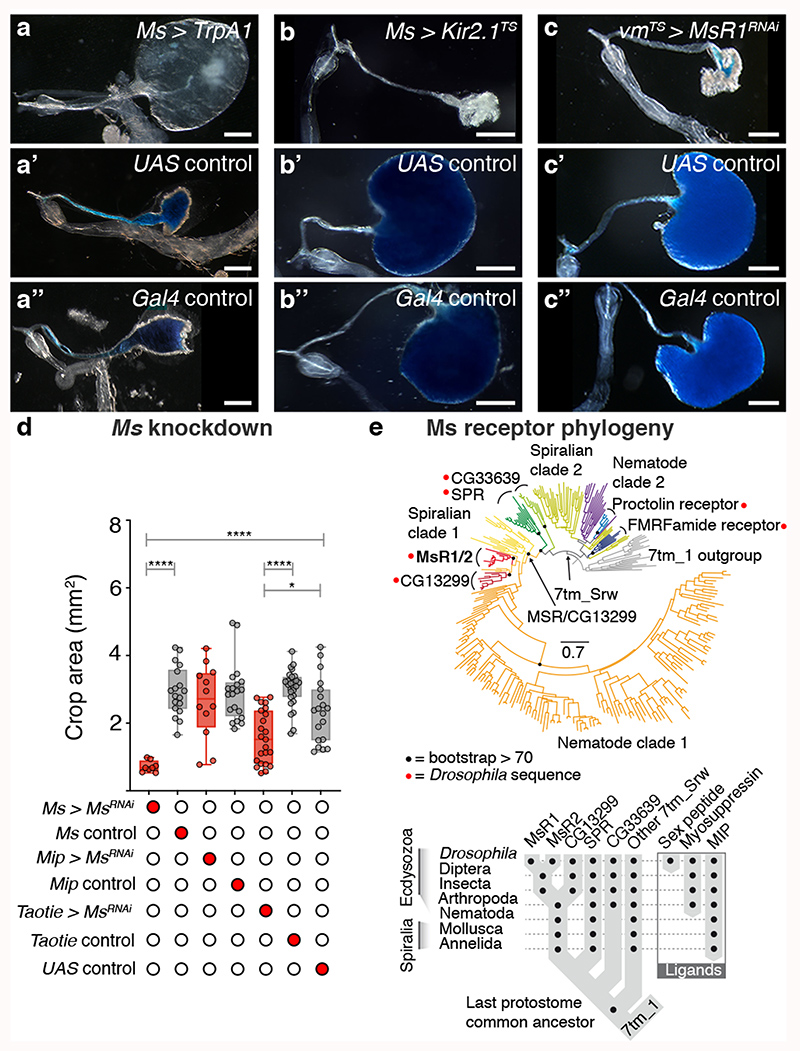
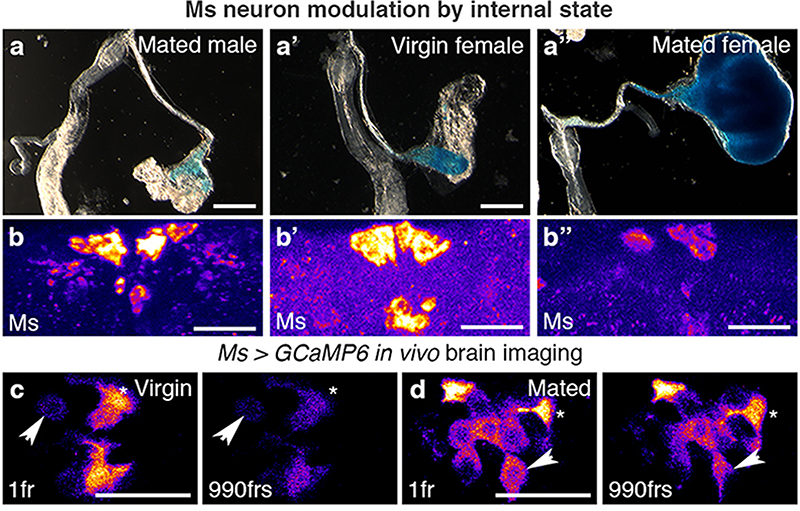
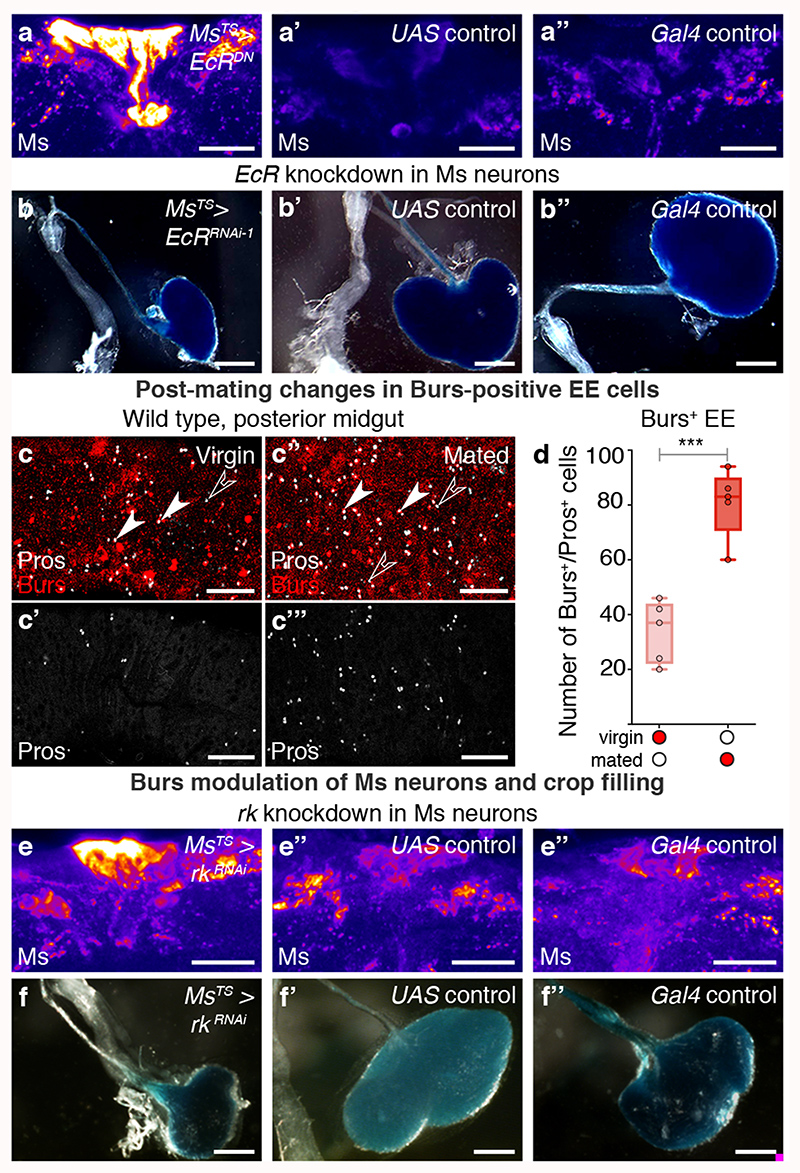
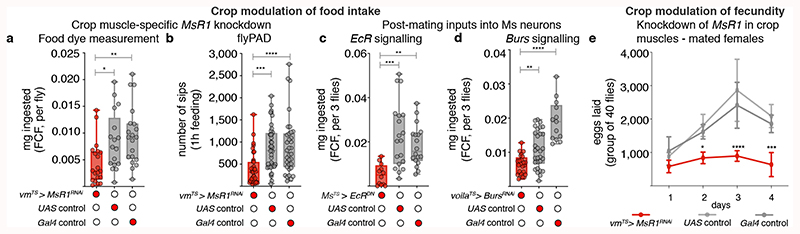
Reproduction induces increased food intake across females of many animal species1-4, providing a physiologically relevant paradigm for the exploration of appetite regulation. Here, by examining the diversity of enteric neurons in Drosophila melanogaster, we identify a key role for gut-innervating neurons with sex- and reproductive state-specific activity in sustaining the increased food intake of mothers during reproduction. Steroid and enteroendocrine hormones functionally remodel these neurons, which leads to the release of their neuropeptide onto the muscles of the crop-a stomach-like organ-after mating. Neuropeptide release changes the dynamics of crop enlargement, resulting in increased food intake, and preventing the post-mating remodelling of enteric neurons reduces both reproductive hyperphagia and reproductive fitness. The plasticity of enteric neurons is therefore key to reproductive success. Our findings provide a mechanism to attain the positive energy balance that sustains gestation, dysregulation of which could contribute to infertility or weight gain.


Conflict of interest statement

Competing interests

The authors declare no competing interests.

Figures

Extended Data Fig. 1
Extended Data Fig. 1. Innervation of the anterior portion of the adult Drosophila intestine
a, Schematic summary of the innervation of the anterior portion of the adult fly intestine, encompassing foregut, crop and anterior midgut. b, Pan-neuronal nSyb-Gal4 driver expression visualised with EGFP (from UAS-FB1.1 reporter) in green. Gut muscles are highlighted in blue with phalloidin staining. In all subsequent panels, driver expression is in green and phalloidin staining in blue. Abbreviations are as per a. c, Cell number quantifications of the enteric nervous system (ENS) ganglia and secretory glands associated with the adult anterior midgut. d-d″, Direct innervation of the crop by neurons located in the central nervous system. d’, Projections emanating from the insulin-producing neurons in the PI (labelled with Ilp2-3-Gal4-driven expression of UAS-FB1.1-derived EGFP in green) innervate the crop and anterior midgut. Neuronal nuclei are labelled with anti-Elav antibody in red, and gut muscles are labelled in blue with phalloidin. d″, The axonal projections of these insulinergic neurons are visualised using immunostaining for Ilp2 peptide in red. e-e″, Innervation of the crop by peripheral neurons. Taste receptor-expressing neurons visualised with the Gr43aKI-Gal4 driver; gut muscles are labelled with phalloidin. The boxed area in e’ highlights the cell bodies of ENS-like sensory neurons located in the HCG. e″ shows the axonal terminals of the same sample on the crop muscle lobes (arrow). In d-e″, arrowheads point to the paired nerves innervating the crop. f-j, Spatially restricted Gal4 drivers or antibodies reveal distinct crop-innervating neuronal subsets. In all panels, Gal4 expression is visualised with EGFP (from UAS-FB1.1 reporter) in green, and gut muscles are highlighted in blue with phalloidin staining. f, Dh44-Gal4 expression. Dh44-Gal4-positive cell bodies in the PI (top dashed box) project to the HCG (bottom dashed boxed) and crop through the crop nervi. They also innervate the anterior midgut. No Dh44-Gal4-positive cell bodies are apparent in the HCG. DAPI labels the nuclei of the brain-gut axis in cyan. g, Mip-Gal4-positive cell bodies are found in both the PI and HCG (dashed boxes). Axons project to the anterior midgut, and along the crop nervi towards the crop. h, Glucagon-like adipokinetic hormone Akh (labelled with an anti-Akh antibody in red) is produced by cell bodies located in the paired corpoca cardiaca (CC) glands and is apparent in their projections along the crop nervi up to the junction between crop duct and lobes. i, Expression of a pain-Gal4 reporter for painless (coding for a TRPA channel mediating detection of noxious heat and mechanical stimuli) in a subset of ENS neurons in the HCG (dashed box), pointing to possible mechanosensory identity. j, Expression of a Gr28a-Gal4 reporter for Gustatory receptor 28a in two HCG cell bodies (dashed box), suggestive of chemosensory identity. Their neurites populate the anterior midgut and their axons project along the recurrent nerve (RN). k, The Aug21-Gal4 reporter reveals short local projections from the corpus allatum around the foregut and anterior midgut. l-m, The use of Hox gene reporters allows labelling of large population of central neurons in thoracico-abdominal ganglion segments. No neurons in the Ubx-Gal4 (l) or abdA-Gal4 (m) expression domains contribute to the innervation of the crop of anterior midgut. Gal4 expression is visualised with EGFP (from UAS-FB1.1 reporter) in green, and gut muscles are highlighted in blue with phalloidin staining. Neuronal nuclei are visualised in red with anti-Elav (SG = salivary gland). Scale bars = 50μm. See Supplementary Information for a list of full genotypes, sample sizes and conditions.
Extended Data Fig. 2
Extended Data Fig. 2. Intestinal transit dynamics and dietary regulation of crop enlargement
a, Cartoon summarising ad libitum and starvation/re-feeding assays using dye-laced food. b-c’, Transit of dye-laced food, intestinal transit at specific time points after ingestion. b, Gut dissected 10 seconds after feeding initiation; food is apparent in the crop duct and begins to enter the crop. b’, Gut dissected 40 seconds after feeding initiation; food fills the crop duct, crop, and begins to enter the midgut. b″, Gut dissected 2 minutes after feeding initiation; food fills the crop, crop duct and midgut. b″, Gut dissected 40 minutes after feeding initiation; food fills the crop, crop duct, midgut and has now reached the hindgut and rectal ampulla. All panels show dissected adult fly intestines, anterior (left) posterior (right). c,c’, Frequency histogram derived from in vivo food ingestion videos (see Supplementary Video 1 for a representative example) showing higher number of flies with faster transit times of food to the crop (c) compared to midgut (c’). d, Quantification of crop area revealed that re-feeding after starvation results in larger crops than ad libitum feeding. e-e″, Representative dissected guts of a starved fly (e, 16h starvation on 1% agar), starved-refed fly (e’, 16h starvation on 1% agar, refed for 20min on dye-laced standard food), ad libitum-fed fly (e″, fed on dye-laced standard food for 2h). f, Ability of different food sources to elicit crop enlargement. These are categorized as palatable (P) and/or nutritious (N) using filled boxes if true and empty boxes if false (see Methods for further details of the different diets). In this and all subsequent ranked data panels, crop size was ranked as one of four categories: small (S), medium (M), large (L) and very large (VL). Graphs are colour-coded from light to dark shades of red corresponding to increasing size of the crop. Data are displayed as percentages. Scale bars = 500μm. See Supplementary Information for a list of full genotypes, sample sizes and conditions. In all boxplots, line: median; box: 75th-25th percentiles; whiskers: minimum and maximum. All data points are shown. *: 0.05>p>0.01; **: 0.01>p>0.001; ***: p<0.001.
Extended Data Fig. 3
Extended Data Fig. 3. Characterisation of Ms expression
a, Cartoon depicting Ms neuronal subtypes. Dashed boxes highlight the main sites of Ms expression: ~ 30 neuronal cell bodies in the PI, ~ 5 enteric neurons located in the HCG and neuronal projections in the HCG and on the crop muscles. b,c, Single-cell Flybow clones of Ms-Gal4-expressing neurons (in red); gut muscle labelled with phalloidin (in blue). b, The PI and HCG where the Ms cell bodies reside are boxed. No Ms neurons have been labelled in the PI, but a single-cell, mCitrine-positive clone (in red) reveals an HCG neuron that innervates the crop muscle. Inset shows a single-cell clone of a second type of HCG Ms-Gal4-expressing neuron that only extends local projections. c, Single-cell FlyBow clone of a large PI Ms-Gal4-expressing neuron. The main projection bifurcates, with one shorter (putatively dendritic) branch projecting towards the suboesophageal zone (SEZ) (empty arrows), and a longer (axonal) branch projecting towards the midgut/crop (arrows). d,d’, Co-expression of the dendritic marker DenMark (in red) and membrane marker Venus shown (in green) from Ms-Gal4 reveals relative DenMark enrichment in their SEZ projections (d), consistent with dendritic nature. Venus enrichment is apparent in the crop nerve (d’), consistent with its axonal identity. Top left arrow points to the crop nerve, and bottom arrow points to where it terminates. e, Quantification of fluorescence for DenMark and Venus in SEZ (top) crop nerve (bottom) projections. f-j″, Ms-Gal4 expression, visualized by EGFP from the UAS-FB1.1 reporter (in green). f, Overview of Ms-Gal4-positive intestinal innervation; Ms-positive neurites are apparent on the crop, anterior midgut and posterior hindgut (rectal ampulla). Neuronal nuclei are stained with an anti-Elav antibody in red, and gut muscles are labelled in blue with phalloidin. g, Ms-Gal4 expression in heart-innervating neurons; heart muscles are labelled in blue with phalloidin. h, Ms-Gal4 expression in peripheral neurons that innervate the ovaries, oviduct and spermatheca (SP). i-i″, Co-expression of Ms-Gal4 and Ms peptide (in red) in a cluster of PI neurons; arrows and arrowheads point to big and small PI Ms neuron subtypes, respectively. i and i’ show single channel images for Ms-Gal4 and anti-Ms antibody, respectively. The merged image is shown in i″. j-j″, Co-expression of Ms-Gal4 and Ms transcript (visualised using single-molecule RNA fluorescence in situ hybridisation in red) in the same cluster of PI neurons. j and j’ show single channel images for Ms-Gal4 and Ms transcript, respectively. The merged image is shown in j″. k-k’, Ms protein reporter expression (in green). Ms peptide is in red and gut muscles are labelled with phalloidin in blue. k, Co-expression between the Ms protein reporter Ms peptide in the nervous system, and in neuronal projections towards the gut. Ms and the Ms protein reporter are co-expressed by the PI Ms neurons (boxed and inset). k’, The Ms protein reporter also labels axonal projections innervating the crop muscles. l-q″, Expression (or lack thereof) of neuropeptides and other markers in the Ms-expressing neurons in the PI or HCG. For each letter, the first panel shows double staining, the second and third panels show single channels for clarity, l-l″, PI Ms neurons do not co-express Ilp2, used as a marker of insulin-producing neurons. m-m″, PI Ms neurons do not co-express Dh44-Gal4, used as a marker of Diuretic Hormone 44-producing neurons. n-n″, PI Ms neurons do not co-express Mip-Gal4, used as a marker of Myoinhibiting peptide precursor-producing neurons. o-o″, Co-expression between Ms and Mip-Gal4 in 3 out of the 5 HCG Ms-expressing neurons. Phalloidin was used to label gut muscles (in blue). p-p’’, A subset of PI Ms neurons co-express Taotie-Gal4; other Taotie-Gal4-positive PI neurons are Ms-negative. In the HCG, Taotie-Gal4 expression is only apparent inconsistently in one Ms neuron (data not shown). q-q″, PI Ms neurons do not co-express Dsk-Gal4, used as a marker of Drosulfakinin-producing neurons. Scale bars: b, d’, f-h and k-k’ = 50μm, i-j″, l-o″ and q-q″ = 25μm, b (inset), c, d, p-p″ = 20μm and k (inset) = 10μm. See Supplementary Information for a list of full genotypes, sample sizes and conditions.
Extended Data Fig. 4
Extended Data Fig. 4. Ms neuron regulation of crop enlargement
a-a’, Validation of MsΔ mutant using anti-Ms staining shown in green; PI is highlighted by dashed lines. a, Lack of Ms staining in the PI of Ms mutants (MsΔ/ Df(3R)Exel6199). Ms staining is apparent in the PI of Df(3R)Exel6199 (a’) and MsΔ (a″) heterozygous control flies. b, Quantifications of crop area in ad libitum-fed flies upon Ms-Gal4-driven TrpA1 expression (4h at the permissive temperature), showing these have significantly larger crops relative to UAS and Gal4 controls. c, Quantifications of crop area in starved-refed flies upon Ms-Gal4-driven Kir2.1 expression (temporally confined with tub-Gal80TS), showing these have significantly smaller crops relative to UAS and Gal4 controls. d-e″, Effect of neuronal activation and Ms downregulation on Ms levels in PI neurons. Thermogenic activation of Ms neurons in ad libitum fed flies depletes Ms peptide (in red) from Ms neuron cell bodies in the PI (d) compared to UAS (d’) and Gal4 (d″) controls. Adult-specific Ms downregulation in Ms neurons of starved-refed flies results in reduced Ms staining (red) in PI neurons (e), compared to UAS (e’) and Gal4 (e″) controls. f-i, Effect of Ms loss-of-function and adult-specific Ms neuron inactivation on crop expansion and shape, upon starvation-refeeding in mated females. f, Quantifications of crop area revealed that Ms neuron inactivation results in smaller crops relative to Ms mutant or w1118, UAS and Gal4 controls. g, Representative crop images of genoytpes quantified in f. h, Quantifications of crop roundness revealed that crops are less round upon Ms neuron inactivation or in Ms mutant compared to w1118, UAS and Gal4 controls. i, PCA of landmark position variation along the crop outline, showing that crop shapes are distinct between Ms mutant (red), Ms neuron inactivation (yellow) and w1118 (grey), being more similar between Ms mutant and w 1118, as highlighted by partial overlap of their 95% confidence ellipses. Wireframe deformation grids are shown to illustrate the mininum and maximum shape deviations as compared to the mean shape along each PC axis. j-k, Effect of Ms neuron activation on crop expansion in Ms mutant background, upon starvation-refeeding in mated females. j, Quantifications of crop area show that activation of Ms neurons by Ms-Gal4-driven TrpA1 expression resulted in larger crops relative to activation of Ms neurons by MsTGEM-driven TrpA1 expression in an heteroallelic mutant background, as well as relative to Ms mutant or UAS and Gal4 controls. k, Representative crop images of genoytpes quantified in j. l-m, Effect of Ms and Taotie neuron activation on crop enlargement, upon starvation in mated females. l, Quantification of crop area shows that activation of either Ms neurons or Taotie neurons resulted in larger crops compared to respective Gal4 controls and UAS control, even in the absence of food. m, Representative crop images of genotypes quantified in l. Scale bars: a-a’ = 10μm, d-e″= 25μm, g, k and m = 500μm. See Supplementary Information for a list of full genotypes, sample sizes and conditions. In all boxplots, line: median; box: 75th-25th percentiles; whiskers: minimum and maximum. All data points are shown. *: 0.05>p>0.01; **: 0.01>p>0.001; ***: p<0.001.
Extended Data Fig. 5
Extended Data Fig. 5. Expression of Ms receptors and their regulation of crop enlargement
a, FB1.1-derived EGFP reveals MsR1 expression in the crop muscles and nervous system, including nerves innervating the crop, hindgut and rectal ampulla. In this and subsequent panels, muscles are labelled with phalloidin (in blue). b-b″, Co-expression between MsR1 mRNA stained with single-molecule RNA fluorescence in situ hybridisation (b,b’, in red) and FB1.1-derived EGFP driven by MsR1TGEM-Gal4 (b,b″, in green) is observed in crop muscles. Muscle nuclei are shown in blue with DAPI; single channels are shown for clarity. c, Detail of the HCG and corpora cardiaca (CC); the latter is extensively innervated by MsR1-expressing neurons. d, FB1.1-derived EGFP reveals MsR1 expression in neurons innervating the female reproductive system, but not in its muscles. e, FB1.1-derived EGFP reveals MsR1 expression in heart-innervating neurons, but not in heart muscles. f, Higher magnification image of the central brain; nuclear GFP reveals broad MsR1 expression in neurons including the PI Ms neurons shown with Ms staining (in red). g, A subset of 2-3 MsR1-positive neurons in the HCG co-express Ms. h, Nuclear GFP reveals MsR1 expression overlaps with Akh staining in CC cells (in red). i, Single-molecule fluorescence in situ hybridisation of MsR1 and MsR2 mRNAs in crop muscles; MsR1 (in green) is more readily detected than MsR2 (in red). Muscle cell nuclei are shown in blue by DAPI staining. The MsR1 expression described in a-h is consistent with transcriptomics data,. i’ and i″ show single MsR1 or MsR2 channels for clarity. j-j’, Validation of adult-specific MsR1 knockdown in visceral muscles (vmTS > MsR1-RNAi). Panels show high magnification images of crop muscles. MsR1 mRNA expression is visualised by single-molecule RNA fluorescence in situ hybridisation (in green) in vm-Gal4TS (j), but it is reduced/absent from MsR1 knockdown crops (j’). k, Quantifications of crop area in starved-refed flies upon downregulation of MsR1 in visceral muscles, showing that crop size is visibly reduced upon MsR1 downregulation compared to UAS and Gal4 controls. l, A similar reduction in crop area is also quantified upon MsR1 downregulation specifically in crop muscles using a different driver line (MsR1crop > MsR1RNAi). MsR1crop-Gal4 is MsR1-Gal4, nsyb-Gal80, in which MsR1-Gal4 neuronal expression is prevented using the pan-neuronal nsyb-Gal80 driver, rendering it a crop muscle-specific driver. m-o″, Effect of crop muscle-specific downregulation of MsR1 on crop size. m, Quantifications of crop area in starved-refed mated females shows that crop-specific downregulation of MsR1 (MsR1crop > MsR1RNAi) resulted in reduced crop areas, similar to Ms neuron inactivation (Ms > Kir2.1) and significantly reduced as compared to Gal4 and UAS controls. n-o″, Representative crop phenotypes of the genotypes quantified in m. p, Quantification of crop area upon visceral muscle-specific MsR1 and MsR2 downregulation, showing that MsR1 knockdown, but not MsR2 knockdown, resulted in reduced crop sizes, as compared to UAS and Gal4 respective controls. q, Quantifications of crop area in starved-refed mated females shows that heteroallelic MsR1TGEM/DfAprt-32 mutants have reduced crop areas relative to w1118 or heterozygous controls. r, Representative crop images from genotypes quantified in q. s, Validation of MsR1 mutation and MsR1 fluorescence in situ hybridisation signal specificity. MsR1 mRNA (green) is absent from the crop muscle cells of MsR1TGEM mutants, and apparent in w1118 control flies. Scale bars: b-b″, f-j″ and s = 10μm, a, c, d, e = 50μm, r = 500μm and n-o″ = 1mm. See Supplementary Information for a list of full genotypes, sample sizes and conditions. In all boxplots, line: median; box: 75th-25th percentiles; whiskers: minimum and maximum. All data points are shown. *: 0.05>p>0.01; **: 0.01>p>0.001; ***: p<0.001.
Extended Data Fig. 6
Extended Data Fig. 6. Post-mating modulation of Ms neurons
a-b, Analysis of Ms neuron crop terminals in virgin and mated females. Neither the number of axonal branches (a) nor their diameter (b) is significantly different between virgin and mated females. c, Quantifications of Ms staining levels in the cell bodies of PI neurons of wild-type, ad libitum-fed males, virgin females and mated females. Mated females have less Ms peptide than virgin females or males; virgin females have less peptide than males. d-h, Comparison of Ms peptide levels in the cell bodies of PI neurons in fed versus starved virgin and mated females. Representative images of Ms staining in the cell bodies of the PI neurons of fed virgin females (d), starved virgin females (e), fed mated females (f) and starved mated females (g). h, Quantification of Ms staining in the cell bodies of PI neurons shows that Ms levels are reduced in mated females compared to virgins, irrespective of fed or starved status. i, RT-qPCR expression data for Ms transcript levels in the brain of ad libitum-fed, control males (grey column), virgin females (pink column) and mated females (red column). No significant differences are apparent between groups. j-l, CaLexA-based assessment of mating-triggered changes in PI Ms neuronal activity, achieved by adult- and Ms-confined CaLexA expression (MsTS > CaLexA). Representative images of ad libitum-fed, wild-type virgin (j,j’), and mated females (k,k’) are shown. Ms neurons are labelled with anti-Ms antibody (in red) and CaLexA channel is shown as a single channel (in green), for clarity. l, Quantification of CaLexA-derived GFP-positive cells in PI Ms neurons of virgin (pink box) and mated (red box) females, showed that fewer cells are CaLexA-positive in virgin compared to mated females; each data point corresponds to a different brain. m,n, Quantification of baseline GCaMP fluorescence (corrected for background) (m) and amplitude of GCaMP fluorescence oscillations (n) in the cell bodies of PI Ms neurons of virgin females (pink box) or mated females (red box). Each data point corresponds to an individual cell measurement. Higher GCaMP signal and reduced oscillation amplitude are detected in mated females. o, Crop area quantifications in wild-type, ad libitum-fed males, virgin females and mated females. The crop of mated females is bigger than that of virgin females or males. p,q, Effects of sex and mating status on Ms signalling contribution to crop size. p, Quantification of crop area upon adult-specific downregulation of MsR1 in visceral muscles shows that this was significantly reduced in mated females but not in males or virgin females, as compared to respective controls. q, Representative crop images of genotypes quantified in m. Scale bars: d-g and j-k’= 20μm and q = 500μm. See Supplementary Information for a list of full genotypes, sample sizes and conditions. In all boxplots, line: median; box: 75th-25th percentiles; whiskers: minimum and maximum. All data points are shown. *: 0.05>p>0.01; **: 0.01>p>0.001; ***: p<0.001.
Extended Data Fig. 7
Extended Data Fig. 7. Ecdysone modulation of Ms neurons and crop size
a-a’, Expression of EcR in PI Ms neurons. Ms staining (in green) (a) and EcR staining (in red) (a’) overlap and are shown as single channels for clarity. b-d, Ecdysone effect on Ms levels in PI neurons. Representative images show comparable Ms levels upon expression of EcRDN in virgin females (b) relative to UAS (b’) and Gal4 (b″) controls. Fluorescence signals are pseudo-coloured; high to low intensity is displayed as warm (yellow) to cold (blue) colours. c, Quantification of Ms staining intensities in PI neurons of virgin females upon expression of EcRDN showed comparable levels to UAS and Gal4 controls. d, Quantification of Ms staining intensities in PI neurons of mated females upon expression of EcRDN showed increased Ms levels relative to UAS and Gal4 controls. e, Quantification of crop area in starved-refed mated females revealed smaller crops upon adult- and Ms neuron-specific EcR downregulation compared to UAS and Gal4 controls. f-j, Classification of crop size upon expression of EcRDN (f-g) or EcR downregulation (h-j) in starved-refed female flies. Distribution of crop sizes did not significantly change relative to UAS and Gal4 controls in virgin females (f, h, j). In mated females, the distribution shifted towards smaller crop sizes, relative to UAS and Gal4 controls (g, i). Ranked data are displayed as percentages. Scale bars = 20μm. See Supplementary Information for a list of full genotypes, sample sizes and conditions. In all boxplots, line: median; box: 75th-25th percentiles; whiskers: minimum and maximum. All data points are shown. *: 0.05>p>0.01; **: 0.01>p>0.001; ***: p<0.001.
Extended Data Fig. 8
Extended Data Fig. 8. Bursicon modulation of Ms neurons
a, Co-expression of Burs (a’, in red), Pros (a″, in white) and GFP driven by Tkg-Gal4 (a‴, in green) in midgut enteroendocrine cells of mated females. b, Quantifications of Pros-positive midgut cells shows increased enteroendocrine cell number in mated females relative to virgins. Flies were starved for 22h to increase Burs staining in the enteroendocrine cell bodies. Single channels for each marker are shown for clarity. c, Quantification of enteroendocrine cells of mated females labelled by Tkg-Gal4-driven EGFP and Burs staining (such as that shown in a). More Tkg-Gal4-positive than Burs-positive enteroendocrine cells are apparent. The majority of Burs-positive enteroendocrine cells are Tkg-Gal4-positive. d-e, Co-expression of rkTGEM (driving FB1.1, in green) with Ms peptide (in red) is shown in brain and VNC neurons (d), and in the HCG ganglion (e). f-f’, Co-expression of rkTGEM (driving FB1.1-derived EGFP, in green) with Ms peptide (in red) was observed brain PI neurons. f’, Ms staining is shown as a single channel for clarity. g-g’, Co-expression of Ms-Gal4 (driving FB1.1-derived EGFP, in green) with rk mRNA (stained with fluorescence in situ hybridisation, in red) was observed in brain PI neurons. g’, rk fluorescence in situ hybridisation signal is shown as a single channel for clarity. h, Co-expression of rkTGEM (driving FB1.1-derived EGFP, in green) with Ms peptide (in white) and EcR (in red) was observed in brain PI neurons. i, Co-expression of Taotie-Gal4 (driving FB1.1-derived EGFP, in green) with EcR (in red) was observed in brain PI neurons. Nuclei are stained with DAPI (in blue). j-j’, Co-expression of Taotie-Gal4 (driving FB1.1-derived EGFP, in green) with rk mRNA (stained with fluorescence in situ hybridisation, in red) was observed in brain PI neurons. Nuclei are stained with DAPI (in white). j’, rk mRNA fluorescence in situ hybridisation signal is shown as a single channel for clarity. k-m, rk regulation of Ms levels in PI neurons. Representative images show similar Ms staining signal upon adult-specific rk downregulation in virgin females (k) relative to UAS (k’) and Gal4 (k″) controls. Fluorescence signals are pseudo-coloured; high to low intensity is displayed as warm (yellow) to cold (blue) colours. l, Quantification of Ms staining intensities in PI neurons of virgin females upon adult-specific rk downregulation showed comparable levels to UAS and Gal4 controls. m, Quantification of Ms staining intensities in PI neurons of mated females upon adult-specific rk downregulation showed increased Ms levels relative to UAS and Gal4 controls. n, Quantification of the amplitude of GCaMP oscillations in PI neurons of mated females shows that downregulation of EcR and rk in Ms neurons significantly increased the amplitude of calcium signal. o, Quantification of GCaMP baseline fluorescence levels in PI neurons of mated females revealed that downregulation of EcR in Ms neurons significantly reduced GCaMP signal, whereas downregulation of rk increased GCaMP signal, both relative to expression of EGFP. Hence, calcium oscillations become virgin-like both upon EcR or rk downregulation, whereas their effects on overall calcium fluorescence are different. Scale bars = 20μm apart from a-a″ and d-e = 50μm. See Supplementary Information for a list of full genotypes, sample sizes and conditions. In all boxplots, line: median; box: 75th-25th percentiles; whiskers: minimum and maximum. All data points are shown. *: 0.05>p>0.01; **: 0.01>p>0.001; ***: p<0.001.
Extended Data Fig. 9
Extended Data Fig. 9. Post-mating modulation of crop enlargement by Burs and ecdysone
a-a’, Classification of crop size upon rk downregulation in Ms neurons of starved-refed female flies. Distribution of crop sizes did not significantly change relative to UAS and Gal4 controls in virgin females (a). In mated females, the distribution shifted towards smaller crop sizes, relative to UAS and Gal4 controls (a’). Ranked data are displayed as percentages. b-e, Effect of Burs expression from enteroendocrine cells on crop enlargement in virgin (b, d) and mated (c, e) females. Representative crop images of ad libitum-fed flies virgin females show that crop size was not visibly changed upon downregulation of Burs in Pros-expressing enteroendocrine cells (b) relative to UAS (b’) and Gal4 (b’) controls. In mated females, the distribution shifted towards smaller crop sizes (c), relative to UAS (c’) and Gal4 (c″) controls. Quantifications of crop area of genotypes shown in b-b″ and c-c″ are shown in d and e respectively. f-h, Thermogenic activation of Tkg-Gal4-positive cells (which include Burs-positive enteroendocrine cells but also a very small subset of neurons outside the PI, not shown) resulted in significant reduction of Ms signal in the cell bodies on PI neurons of virgin females, relative to UAS and Gal4 virgin controls. f-g″, Representative images of Ms staining in PI neurons of the genotypes quantified in h. Reduction of Ms staining is apparent in PI neurons of virgin females upon activation of Tkg-Gal4-positive cells (f) relative to UAS (f’) and Gal4 (f″) virgin controls. The difference between activated (g) vs control (g’, g″) flies was not apparent when female flies were mated (presumably because more Ms peptide has been released in controls). Fluorescence signals are pseudo-coloured; high to low intensity is displayed as warm (yellow) to cold (blue) colours. i-j, Effect of gut hormone release from enteroendocrine cells on crop enlargement. Representative crop images of ad libitum-fed female flies shows that crop size was increased upon thermogenic activation of Tkg-Gal4-positive cells (i) relative to UAS (i’) and Gal4 (i″) controls, quantified in j. We note that the Tkg-Gal4-positive cells include most Burs-positive enteroendocrine cells as well as a very small subset of central neurons outside the PI (not shown). k-l, Effect of ecdysone and Burs signalling in Taotie neurons on crop enlargement after mating. Representative crop images of starved-refed mated females show that, relative to the UAS GD control (k), downregulation of EcR (k’) or rk (k″) resulted in visibly smaller crops. Quantifications of crop area of genotypes shown in k-k″ are shown in l. m, Schematic summary of key findings. Post-mating increase in circulating levels of Bursicon and Ecdysone signal via their receptors to Ms-neurons, change their neural activity and lead to crop enlargement. Scale bars f-g″ = 20μm b-c″, i-i″= 500 μm and k-k″ = 1mm. See Supplementary Information for a list of full genotypes, sample sizes and conditions. In all boxplots, line: median; box: 75th-25th percentiles; whiskers: minimum and maximum. All data points are shown. *: 0.05>p>0.01; **: 0.01>p>0.001; ***: p<0.001.
Extended Data Fig. 10
Extended Data Fig. 10. Regulation of food intake, fecundity and fertility by Ms neurons.
a-b, Mated females increase their food intake. Both the amount of ingested dye-laced food (a) and the number of sips per fly (b) are increased in wild-type mated females relative to virgins. c-e, Regulation of food intake by MsR1 expression in crop muscles. Quantifications of ingested dye show that downregulation of MsR1 in the visceral muscles of starved-refed virgin females resulted in similar food intake relative to UAS and Gal4 controls (c), whereas downregulation of MsR1, but not MsR2, in mated females, resulted in reduced food intake, relative to UAS and Gal4 controls (d). e, Quantification of the number of sips per fly show that downregulation of MsR1 specifically in crop muscles using an independent driver line also reduced food intake relative to Gal4 and UAS controls in starved-refed mated females. f, Quantifications of ingested dye-laced food show that downregulation of EcR in Ms neurons of starved-refed virgin females does not significantly affect food intake when compared to Gal4 and UAS controls. g, Similarly, quantifications of ingested dye-laced food show that downregulation of Burs in Pros-expressing enteroendocrine cells of starved-refed virgin females does not significantly affect food intake when compared to Gal4 and UAS controls (g). h, In the model, food ingression from the oesophagus is driven by crop enlargement, which is assumed to be linear during sips and constant in between sips. The observed increase in food intake in mated females compared to virgins can be explained by a decrease in negative pressure from -0.8 kPa to -1.3 kPa (increased suction), leading to an increased intake during sips. See Source Data for crop morphometry and FlyPad quantifications used for this crop fluid dynamics model. i-j, Thermogenic activation of Ms neurons (Ms > TrpA1) for 4h prior to the transfer of flies from undyed to dye-laced food reduces the mean amount of ingested dye during the course of 1h (i), and reduces the mean number of sips per fly over 1h of feeding (j) relative to Gal4 and UAS controls. k-l, Concurrent thermogenic activation of Ms neurons during feeding of dye-laced food increases the mean amount of ingested dye during the course of 1h (k), but has no effect on the mean number of sips per fly over 1h of feeding (l’) relative to Gal4 and UAS controls. m-n, Effect of neuronal activation on the regulation of food intake by Taotie-Gal4-positive neurons. Quantification of ingested dye-laced food shows that thermogenic activation of Taotie neurons for 4h prior to the switch from undyed to dye-laced food reduced the amount of ingested dye relative to Gal4 and UAS controls over the course of 1h (m). By contrast, concurrent activation during feeding of such food increases the amount of ingested dye relative to Gal4 and UAS controls over the course of 1h (n). o, p, Effect of Ms signalling to crop muscles on fecundity and fertility. o, Quantification of eggs layed in 24h by mated females shows that MsR1 downregulation specifically in crop muscles resulted in significantly fewer eggs layed after 4 days relative to UAS and Gal4 controls. p, Quantification of adult progeny produced from a 24h period of egg laying by mated females, shows that MsR1 downregulation in visceral muscles resulted in significantly fewer progeny relative to UAS and Gal4 controls. Sip number measurements were done over 1h of feeding. See Supplementary Information for a list of full genotypes, sample sizes and conditions. In all boxplots, line: median; box: 75th-25th percentiles; whiskers: minimum and maximum. All data points are shown. *: 0.05>p>0.01; **: 0.01>p>0.001; ***: p<0.001.
Fig. 1
Fig. 1. Ms/MsR1 regulation of crop enlargement
a-c″, Crop phenotypes resulting from Ms-Gal4-driven Ms neuron activation/silencing. Ms-Gal4-driven TrpA1 activation enlarges the crop (a) compared to controls (a’,a″). Ms-Gal4-driven Kir2.1 silencing (temporally confined with tub-Gal80TS) leads to smaller crops (b) compared to controls (b,b″). MsR1 downregulation in adult crop muscles (vm-Gal4-driven MsR1-RNAi expression, temporally confined with tub-Gal80TS) leads to smaller crops (c), compared to controls (c’,c″). We note that vm-Gal4 is expressed in all visceral muscles, but leads to crop muscle-specific downregulation given the neuron- and crop muscle-specific MsR1 expression, Extended Data Fig. 5a-i’. d, Taotie-Gal4-driven, but not Mip-Gal4-driven Ms downregulation significantly reduces crop area (to a lesser degree than Ms neuron silencing, as expected from expression of Taotie-Gal4 in only a subset of PI Ms neurons, Extended Data 3p-p″). e, Myosuppressin receptor phylogeny. Scale bars: a-c″ = 500μm. In this and all subsequent figures, see Supplementary Information for a list of full genotypes, sample sizes and conditions. Statistics: Kruskal Wallis test. In this and all subsequent boxplots: line: median; box: 75th-25th percentiles; whiskers: minimum and maximum. All data points are shown. *: 0.05>p>0.01; **: 0.01>p>0.001; ***: p<0.001.
Fig. 2
Fig. 2. Reproductive modulation of Ms neurons
a-b″, Representative dissected intestines (top) and Ms stainings of the PI region of the brain (bottom) of wild-type flies. Mated females have more expanded crops (a″) and less Ms in their cell bodies (b″) than virgin females (a’,b’) or mated males (a,b). In b-b″, fluorescence signals are pseudo-coloured; high to low intensity is displayed as warm (yellow) to cold (blue) colours here and thereafter. c,d, Temporally defined video snapshots of Ms-driven GCaMP6 activity in the PI of virgin (c), or mated (d) females, imaged over 1000 frames (frs, each frame acquired every 427 milliseconds). Asterisks and arrows highlight two randomly chosen Ms neurons. Scale bars = 20μm except for a-a″ = 500μm.
Fig. 3
Fig. 3. Steroid and enteroendocrine modulation of Ms neurons and crop enlargement
a-b″, Representative Ms levels (a-a″) and crops (b-b″) following adult-specific, Ms-Gal4-driven expression of EcRDN in mated females. Higher Ms levels in PI Ms neuron cell bodies (a) and smaller crops (b) are apparent relative to controls (a’,a″,b’,b″). c’-c‴, Increased expression of enteroendocrine cell marker Prospero (Pros, in white) and Burs (in red) in the midguts of mated (c″,c‴) vs virgin (c,c’) female flies. Filled arrow heads = Pros and Burs-positive cells; empty arrowheads = Pros-positive/Burs-negative cells. c,c″ are full z projections; c’,c‴ are single z slices. d, More Burs-expressing, Pros-positive enteroendocrine cells are apparent in mated females compared to virgin females. e-f″, Representative Ms levels (e-e″) and crops (f-f″) following adult-specific, Ms-Gal4-driven rk downregulation in mated females. Higher Ms levels in PI Ms neuron cell bodies (e) and smaller crops (f) are apparent relative to controls (e’,e″,f’,f″). Scale bars: a-a″, e-e″ = 20μm, c-c‴ = 50μm and b-b″, f-f″ = 500μm. Statistics: Mann-Whitney-Wilcoxon test.
Fig. 4
Fig. 4. Post-mating, Ms-mediated crop enlargement increases food intake and reproductive output
a,b, Adult- and crop muscle-specific MsR1 downregulation. Reduced amount of ingested dye-laced food (a) and sips per fly (b) are apparent relative to controls. c,d, Adult-specific EcR downregulation in Ms neurons (c) or Burs in Pros-expressing enteroendocrine cells (d) in mated females. Both result in reduced food ingestion relative to controls. e, Reduced Ms signalling to crop muscles reduces fecundity. Data are provided as numbers of eggs laid by mated females per day over the course of 4 days. Adult- and crop muscle-specific MsR1 downregulation is shown in red and the two genetic controls are shown in grey. Statistics: a-d, Kruskal Wallis and e, two-way ANOVA followed by a Tukey’s multiple comparison test, day and genotype were the 2 independent factors.

References

    1. Carvalho GB, Kapahi P, Anderson DJ, Benzer S. Allocrine modulation of feeding behavior by the Sex Peptide of Drosophila. Curr Biol. 2006;16:692–696. doi: 10.1016/j.cub.2006.02.064. - DOI - PMC - PubMed
    1. Gittleman JL, Thompson SD. Energy Allocation in Mammalian Reproduction. Amer Zool. 1988;28:863–875.
    1. Johnson ML, Saffrey MJ, Taylor VJ. Gastrointestinal capacity, gut hormones and appetite change during rat pregnancy and lactation. Reproduction. 2019 doi: 10.1530/REP-18-0414. - DOI - PubMed
    1. Speakman JR. The physiological costs of reproduction in small mammals. Philos Trans R Soc Lond B Biol Sci. 2008;363:375–398. doi: 10.1098/rstb.2007.2145. - DOI - PMC - PubMed
    1. Dey S, et al. Cyclic Regulation of Sensory Perception by a Female Hormone Alters Behavior. Cell. 2015;161:1334–1344. doi: 10.1016/j.cell.2015.04.052. - DOI - PMC - PubMed

Publication types

LinkOut - more resources