. 2020 Oct 13:15:7901-7921.
doi: 10.2147/IJN.S261636. eCollection 2020.

Transcriptomics-Based Characterization of the Toxicity of ZnO Nanoparticles Against Chronic Myeloid Leukemia Cells

Affiliations

Transcriptomics-Based Characterization of the Toxicity of ZnO Nanoparticles Against Chronic Myeloid Leukemia Cells

Suliman A Alsagaby et al. Int J Nanomedicine. .

Abstract

Introduction: Zinc oxide nanoparticles (ZnO NPs) have recently attracted attention as potential anti-cancer agents. To the best of our knowledge, the toxicity of ZnO NPs against human chronic myeloid leukemia cells (K562 cell line) has not been studied using transcriptomics approach.

Objective: The goals of this study were to evaluate the capability of ZnO NPs to induce apoptosis in human chronic myeloid leukemia cells (K562 cells) and to investigate the putative mechanisms of action.

Methods: We used viability assay and flowcytometry coupled with Annexin V-FITC and propidium iodide to investigate the toxicity of ZnO NPs on K562 cells and normal peripheral blood mononuclear cells. Next we utilized a DNA microarray-based transcriptomics approach to characterize the ZnO NPs-induced changes in the transcriptome of K562 cells.

Results: ZnO NPs exerted a selective toxicity (mainly by apoptosis) on the leukemic cells (p≤0.005) and altered their transcriptome; 429 differentially expressed genes (DEGs) with fold change (FC)≥4 and p≤0.008 with corrected p≤0.05 were identified in K562 cells post treatment with ZnO NPs. The over-expressed genes were implicated in "response to zinc", "response to toxic substance" and "negative regulation of growth" (corrected p≤0.05). In contrast, the repressed genes positively regulated "cell proliferation", "cell migration", "cell adhesion", "receptor signaling pathway via JAK-STAT" and "phosphatidylinositol 3-kinase signaling" (corrected p≤0.05). Lowering the FC to ≥1.5 with p≤0.05 and corrected p≤0.1 showed that ZnO NPs over-expressed the anti-oxidant defense system, drove K562 cells to undergo mitochondrial-dependent apoptosis, and targeted NF-κB pathway.

Conclusion: Taken together, our findings support the earlier studies that reported anti-cancer activity of ZnO NPs and revealed possible molecular mechanisms employed by ZnO NPs to induce apoptosis in K562 cells.

Keywords: CML; ZnO NPs; apoptosis; transcriptomics.


Conflict of interest statement

The authors declare no conflicts of interest for this work.

Figures
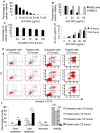
Figure 1
Figure 1
Cytotoxicity assessment of ZnO NPs on leukemic and normal cells; and dissolution analysis of the NPs in culture medium. MTT assay was used to measure the viability of K562 cells (A) and PBMCs (B) post treatment with different concentrations of ZnO NPs for 120 hours. MTT assay was also used to determine the viability of K562 cells post incubation with 10 μg/mL for five different periods of time (C). Dissolution analysis was conducted to determine the concentration of released Zn ions from ZnO NPs to the culture medium RPMI 1640 (D). Annexin V-FITC and propidium iodide (PI) with flow cytometer were used to identify the kind of death caused by ZnO NPs (40 μg/mL) in K562 cells (E). The data of flow cytometer were presented using column graph (F). All experiments were conducted in triplicate. PBMCs: peripheral blood mononuclear cells. Asterisk symbol was used to define p values; p ≤ 0.01 is ** and p ≤ 0.001 is ***.
Figure 2
Figure 2
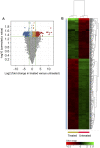
A transcriptomic signature was associated with ZnO NPs-treated K562 cells. Volcano plot shows differentially expressed genes (DEGs: FC≥4; p≤0.008; corrected p≤0.05) in the ZnO NPs-treated K562 cells versus untreated K562 cells (A). Hierarchical cluster analysis with heatmap presentation was performed on the DEGs (B). The color range represents the normalized signal value of probes (log2 transformation and 75 percentile shift normalization).
Figure 3
Figure 3
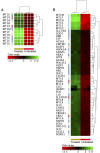
Over-expressed genes in the ZnO NPs-treated K562 cells compared with the untreated K562 cells. Hierarchical cluster analysis with heatmap presentation was conducted on the over-expressed genes (FC≥4; p≤0.008; corrected p≤0.05) that significantly over-represented the biological processes “cellular response to zinc ions and negative regulation of growth” (A) and “response to chemicals” (B). The color range represents the normalized signal value of probes (log2 transformation and 75 percentile shift normalization).
Figure 4
Figure 4
Down-expressed genes in the ZnO NPs-treated K562 cells compared with the untreated K562 cells. Hierarchical cluster analysis with heatmap presentation was applied on the down-expressed genes (FC≥4; p≤0.008; corrected p≤0.05) that significantly enriched the biological processes “cell activation” (A), “positive regulation of mononuclear cell proliferation” (B), “positive regulation of cell adhesion” (C) and “positive regulation of cell migration” (D). The color range represents the normalized signal value of probes (log2 transformation and 75 percentile shift normalization).
Figure 5
Figure 5
ZnO NPs targeted pathways that promote cellular proliferation and survival. ZnO NPs reduced the expression of genes (FC≥4; p≤0.008; corrected p≤0.05) that significantly enriched “positive regulation of tyrosine phosphorylation of STAT protein” (IGF1, IL18, IL23A, KIT, CCL5 and HES1), “positive regulation of receptor signaling pathway via JAK-STAT” (IGF1, IL18, IL23A, KIT, CCL5 and HES1) and “positive regulation of phosphatidylinositol 3-kinase signaling” (IGF1, PIK3CG, IL18, KIT, CCL5 and UNC5B). The gene expression data were shown from three ZnO NPs-treated K562 samples and three untreated K562 samples. The normalized signal value of probes was generated by log2 transformation and 75 percentile shift normalization of the raw data.
Figure 6
Figure 6
Expression of cytokine and cytokine receptor genes in the ZnO NPs-treated K562 cells compared with the untreated K562 cells. The fold change (FC) of the gene expression was based on the data that were recorded in three ZnO NPs-treated K562 samples and three untreated K562 samples. All FC data had p≤0.007 and corrected p≤0.05.
Figure 7
Figure 7
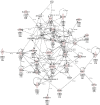
Network of differentially expressed genes (DEGs) is associated with molecular transport and inflammatory response. A network of 35 genes was constructed to understand the cross-talk between genes and functional relevance of this network. Red colored nodes indicated genes from the DEGs, whereas nodes with no color were not from the DEGs that was used for generating this network. Arrows show the direction of effect. The numbers under the genes are as follows from the top to bottom: p value, corrected p value, fold change (FC) of the DEGs, and log FC.
Figure 8
Figure 8
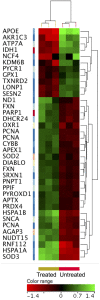
K562 cells altered the expression of their oxidative stress responsive genes in response to the treatment with ZnO NPs. Hierarchical cluster analysis with heatmap presentation demonstrated changes in the expression of oxidative stress responsive genes in the ZnO NPs-treated K562 cells as opposed to the untreated K562 cells. The altered gene expression was identified with fold change ≥1.5, p≤0.05 and corrected p≤0.1. The color range represents the normalized signal value of probes (log2 transformation and 75 percentile shift normalization)
Figure 9
Figure 9
ZnO NPs induced changes in the expression of apoptotic genes in K562 cells. Hierarchical cluster analysis and heatmap presentation showed altered expression of anti-apoptotic genes (A) and pro-apoptotic genes (B) in the ZnO NPs-treated K562 cells compared with the untreated K562 cells. All differentially expressed genes were found with fold change ≥1.5, p≤0.05 and corrected p≤0.1. The color range represents the normalized signal value of probes (log2 transformation and 75 percentile shift normalization).
Figure 10
Figure 10
ZnO NPs targeted NF-κB pathway in K562 cells. The treatment with ZnO NPs reduced the expression of NF-κB pathway activator IKBKB (FC=3.4, p=0.007; corrected p=0.05) and the NF-κB subunits: NFKB2 (FC=2.42; p=0.001; corrected p=0.03), RELB (FC=2; p=0.01; corrected p=0.06) and REL (FC=1.42; p=0.03; corrected p=0.09). The gene expression data were obtained from three samples of ZnO NPs-treated K562 cells and three samples of untreated K562 cells. The normalized signal value of probes was generated by log2 transformation and 75 percentile shift normalization of the raw data.

References

    1. Handy RD, Von der Kammer F, Lead JR, Hassellöv M, Owen R, Crane M. The ecotoxicology and chemistry of manufactured nanoparticles. Ecotoxicology. 2008;17(4):287–314. doi:10.1007/s10646-008-0199-8 - DOI - PubMed
    1. Govindaraju K, Krishnamoorthy K, Alsagaby SA, Singaravelu G, Premanathan M. Green synthesis of silver nanoparticles for selective toxicity towards cancer cells. IET Nanobiotechnol. 2015;9:325–330. doi:10.1049/iet-nbt.2015.0001 - DOI - PubMed
    1. Ke Y, Al Aboody MS, Alturaiki W, et al. Photosynthesized gold nanoparticles from Catharanthus roseus induces caspase-mediated apoptosis in cervical cancer cells (HeLa). Artif Cells Nanomed Biotechnol. 2019;47:1938–1946. doi:10.1080/21691401.2019.1614017 - DOI - PubMed
    1. Kawata K, Osawa M, Okabe S. In vitro toxicity of silver nanoparticles at noncytotoxic doses to HepG2 human hepatoma cells. Environ Sci Technol. 2009;43:6046–6051. doi:10.1021/es900754q - DOI - PubMed
    1. Rajeshkumar S. Anticancer activity of eco-friendly gold nanoparticles against lung and liver cancer cells. J Genetic Eng Biotechnol. 2016;14:195–202. doi:10.1016/j.jgeb.2016.05.007 - DOI - PMC - PubMed

MeSH terms