. 2020 Oct 14:13:719-735.
doi: 10.2147/JIR.S273329. eCollection 2020.

Pathogen-Associated Molecules from Gut Translocation Enhance Severity of Cecal Ligation and Puncture Sepsis in Iron-Overload β-Thalassemia Mice

Affiliations

Pathogen-Associated Molecules from Gut Translocation Enhance Severity of Cecal Ligation and Puncture Sepsis in Iron-Overload β-Thalassemia Mice

Kritsanawan Sae-Khow et al. J Inflamm Res. .

Abstract

Introduction: Systemic inflammation induced by gut translocation of lipopolysaccharide (LPS), a major component of Gram-negative bacteria, in thalassemia with iron-overload worsens sepsis. However, the impact of (1→3)-β-D-glucan (BG), a major fungal molecule, in iron-overload thalassemia is still unclear. Hence, the influence of BG was explored in 1) iron-overload mice with sepsis induced by cecal ligation and puncture (CLP) surgery; and 2) in bone marrow-derived macrophages (BMMs).

Methods: The heterozygous β-globin-deficient mice, Hbbth3/+ mice, were used as representative thalassemia (TH) mice. Iron overload was generated by 6 months of oral iron administration before CLP surgery- induced sepsis in TH mice and wild-type (WT) mice. Additionally, BMMs from both mouse strains were used to explore the impact of BG.

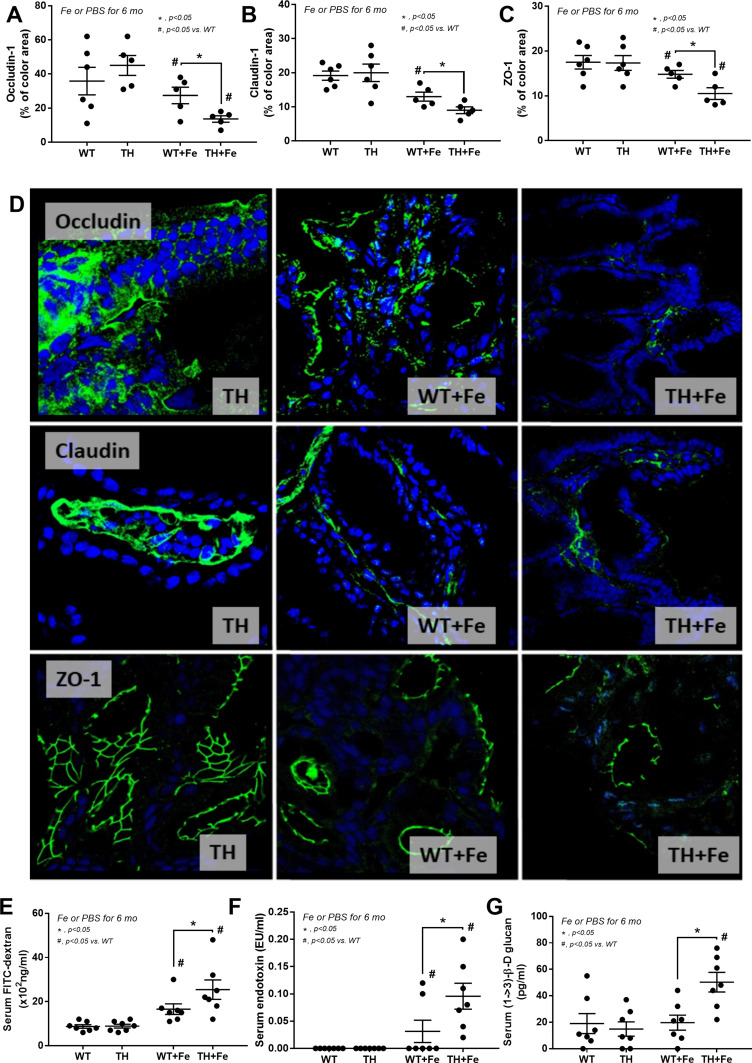
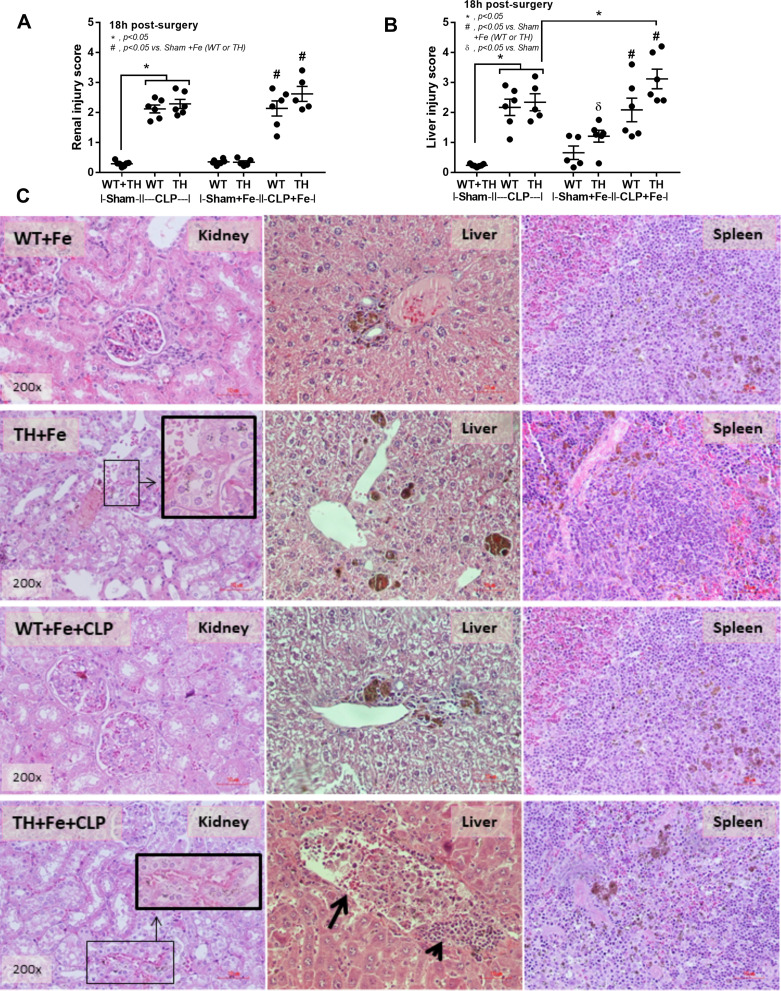
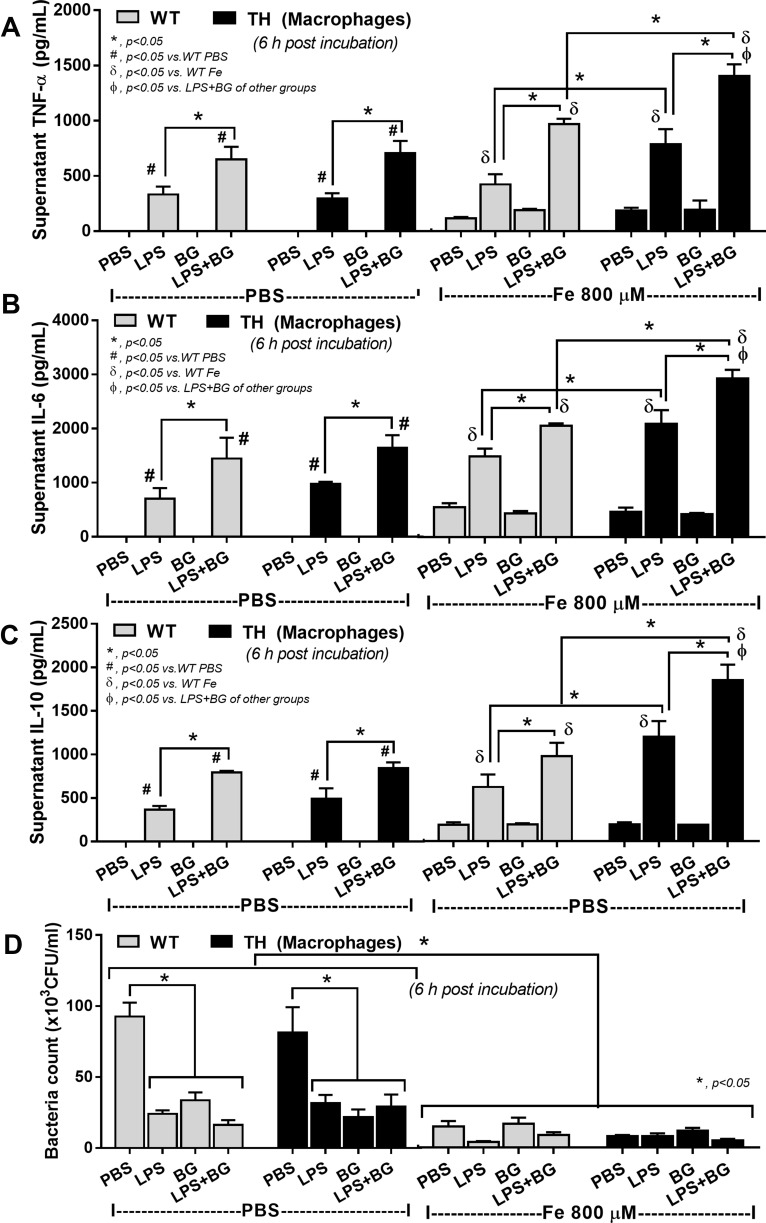
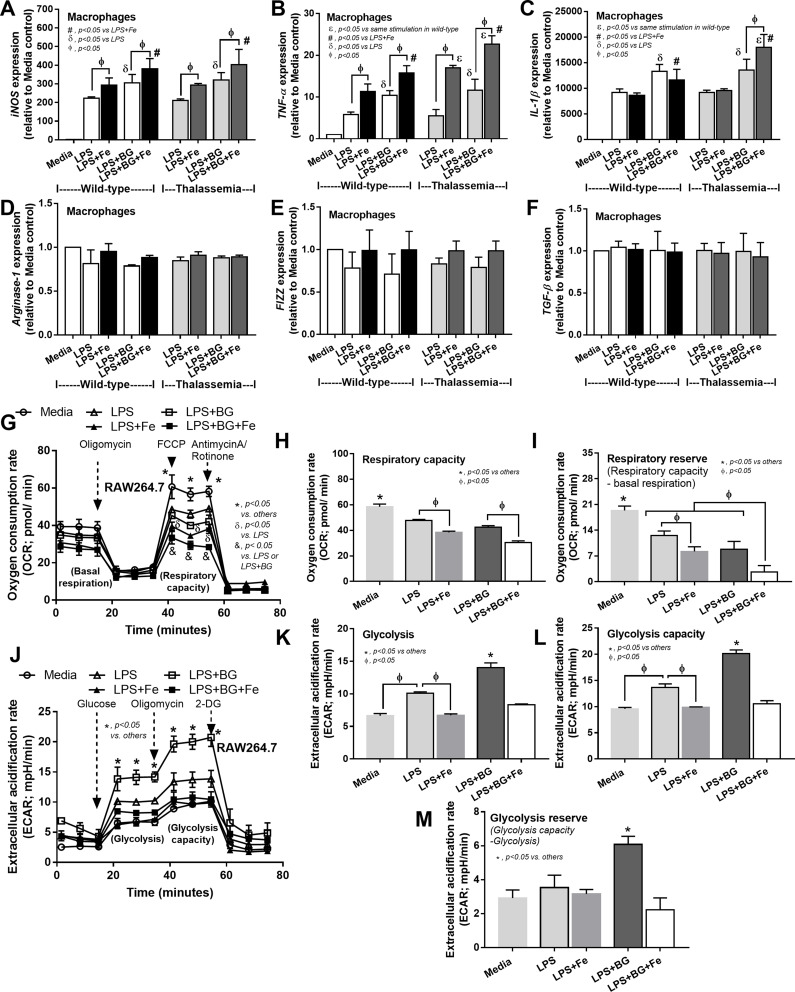
Results: Without sepsis, iron-overload TH mice demonstrated more severe intestinal mucosal injury (gut leakage) with higher LPS and BG in serum, from gut translocation, when compared with WT mice. With CLP in iron-overload mice, sepsis severity in TH mice was more severe than WT as determined by survival analysis, organ injury (kidney and liver), bacteremia, endotoxemia, gut leakage (FITC-dextran) and serum BG. Activation by LPS plus BG (LPS+BG) in BMMs and in peripheral blood-derived neutrophils (both WT and TH cells) demonstrated more prominent cytokine production when compared with LPS activation alone. In parallel, LPS+BG also prominently induced genes expression of M1 macrophage polarization (iNOS, TNF-α and IL-1β) in both WT and TH cells in comparison with LPS activation alone. In addition, LPS+BG activated macrophage cytokine production was enhanced by a high dose of ferric ion (800 mM), more predominantly in TH macrophages compared with WT cells. Moreover, LPS+BG induced higher glycolysis activity with similar respiratory capacity in RAW264.7 (a macrophage cell line) compared with LPS activation alone. These data support an additive pro-inflammatory effect of BG upon LPS.

Conclusion: The enhanced-severity of sepsis in iron-overload TH mice was due to 1) increased LPS and BG in serum from iron-induced gut-mucosal injury; and 2) the pro-inflammatory amplification by ferric ion on LPS+BG activation.

Keywords: iron overload; leaky-gut; sepsis; thalassemia.


Conflict of interest statement

The authors report no conflicts of interest in this work.

Figures

Figure 1
Figure 1
Characteristics of wild-type (WT) and thalassemia (TH) mice with or without iron-overload as determined by hematocrit (A), serum alanine transaminase (B), iron measurement in several organs (CF) and representative figures of iron accumulation in organs as stained by Prussian blue color (G) are demonstrated (n = 6–8/group for A–F). Only control TH mice are demonstrated due to the similarity between WT and TH in the control group. *p<0.05; #p<0.05 vs WT.
Figure 2
Figure 2
Tight junction injury as determined by abundance score of intestinal tight junction proteins including Occludin-1, Claudin-1 and Zonula occludens-1 (ZO-1) with immunofluorescence (AC) (n = 5–6/group) and representative figures (original magnification was 400x) (D) in wild-type (WT) and thalassemia (TH) mice with or without iron-overload are demonstrated. Only figures of control TH mice are demonstrated due to the similarity between WT and TH in the control group. In addition, gut permeability defect by FITC-dextran assay (E), endotoxemia (F), and serum (1→3)-β-D-glucan (BG) (G) (n = 6–8/group for E–G) are demonstrated. *p<0.05; #p<0.05 vs WT.
Figure 3
Figure 3
Severity of sepsis in wild-type (WT) and thalassemia (TH) mice with or without iron-overload with sham or cecal ligation and puncture (CLP) surgery as determined by survival analysis (A), peripheral blood smear analysis including total while blood cells (WBC), polymorphonuclear cells (PMN) and monocyte count from (BD), renal injury by blood urea nitrogen and serum creatinine (E and F), liver damage by aspartate transaminase and alanine transaminase (G and H), blood bacterial burdens by bacteremia and endotoxemia (I and J), gut leakage by serum FITC-dextran and serum (1→3)-β-D-glucan (BG) (K and L) and serum cytokines (MO) are demonstrated (n = 6–12/group). Sham data from WT and TH were combined due to the similar value between WT and TH mice. *p<0.05; #p<0.05 vs Sham+Fe (WT or TH); Фp<0.05 vs CLP (WT or TH); δp< 0.05 vs Sham.
Figure 4
Figure 4
Damage score in kidney and liver from wild-type (WT) and thalassemia (TH) mice with or without iron-overload with sham or cecal ligation and puncture (CLP) surgery (A and B) (n = 5–7/group) (sham data from WT and TH were combined due to the similar value between WT and TH mice). Additionally, representative pictures of hematoxylin and eosin staining from kidney, liver and spleen (C) are demonstrated (only pictures of mice with iron administration are shown). Of note, the brown color is the staining color of iron and inset pictures demonstrate the magnification of brown dot iron accumulation in proximal tubular cells. Arrowhead, inflammatory cells accumulation; Arrow, sinusoidal dilatation with inflammatory cells infiltration; *p<0.05; #p<0.05 vs Sham+Fe (WT or TH); δp< 0.05 vs Sham.
Figure 5
Figure 5
Supernatant cytokines (AC) and bactericidal activity (D) from bone marrow-derived macrophages of wild-type (WT) or thalassemia (TH) mice after 6 hours incubation with phosphate buffer solution (PBS), endotoxin (LPS), (1→3)-β-D-glucan (BG) or LPS plus BG (LPS+BG) with or without ferric iron (800 µM) are demonstrated (independent triplicated experiments were performed). *p<0.05; #p<0.05 vs WT PBS; δp<0.05 vs WT Fe; Фp< 0.05 vs LPS+BG of other groups.
Figure 6
Figure 6
The influence of ferric iron (800 µM) against macrophage polarization of bone marrow-derived macrophage from wild-type and thalassemia mice after activation by control media (Media), endotoxin (LPS) or LPS plus (1→3)-β-D-glucan (LPS+BG) with or without ferric iron as determined by gene expression of M1 macrophage polarization including iNOS, TNF-α and IL-1β (AC) or M2 macrophage polarization including Arginase-1, FIZZ-1 and TGF-β (DF) at 6 hours after incubation are demonstrated (independent triplicated experiments were performed). In addition, the impact of ferric iron (800 µM) against a macrophage cell line (RAW264.7) after activation by Media, LPS or LPS+BG with or without ferric iron as evaluated by the extra-cellular flux analysis in oxygen consumption rate of mitochondrial stress test (GI) and extracellular acidification rate of glucose stress test (JM) at 6 hours after activation are demonstrated (independent triplicated experiments were performed). εp<0.05 vs same stimulation in wild-type; #p<0.05 vs LPS Fe; δp<0.05 vs LPS; Фp<0.05; *p<0.05 vs others; &p<0.05 vs LPS or LPS+BG.
Figure 7
Figure 7
Supernatant cytokines (AC) from blood-derived neutrophils of wild-type (WT) or thalassemia (TH) mice after 6 hours incubation with phosphate buffer solution (PBS), endotoxin (LPS), (1→3)-β-D-glucan (BG) or LPS plus BG (LPS+BG) with or without ferric iron (800 µM) and neutrophil chemotactic activity (D) at 2 hour incubation of these parameters with chemotactic positive control by N-Formylmethionyl-leucyl-phenylalanine (fMLP) are demonstrated (independent triplicated experiments were performed). *p<0.05; #p<0.05 vs PBS (same group); Фp<0.05 vs non-Fe (same stimulation).

References

    1. Fucharoen S, Winichagoon P. New updating into hemoglobinopathies. Int J Lab Hematol. 2012;34(6):559–565. doi: 10.1111/j.1751-553X.2012.01446.x - DOI - PubMed
    1. Rivella S. Ineffective erythropoiesis and thalassemias. Curr Opin Hematol. 2009;16(3):187–194. doi: 10.1097/MOH.0b013e32832990a4 - DOI - PMC - PubMed
    1. Rachmilewitz EA, Giardina PJ. How I treat thalassemia. Blood. 2011;118(13):3479–3488. doi: 10.1182/blood-2010-08-300335 - DOI - PubMed
    1. Taher AT, Saliba AN. Iron overload in thalassemia: different organs at different rates. Hematology Am Soc Hematol Educ Program. 2017;2017(1):265–271. doi: 10.1182/asheducation-2017.1.265 - DOI - PMC - PubMed
    1. Khan FA, Fisher MA, Khakoo RA. Association of hemochromatosis with infectious diseases: expanding spectrum. Int J Infect Dis. 2007;11(6):482–487. doi: 10.1016/j.ijid.2007.04.007 - DOI - PubMed