. 2020 Oct 7:14:582934.
doi: 10.3389/fnins.2020.582934. eCollection 2020.

Altered Expression of Glial Gap Junction Proteins Cx43, Cx30, and Cx47 in the 5XFAD Model of Alzheimer's Disease

Affiliations

Altered Expression of Glial Gap Junction Proteins Cx43, Cx30, and Cx47 in the 5XFAD Model of Alzheimer's Disease

Stella Angeli et al. Front Neurosci. .

Abstract

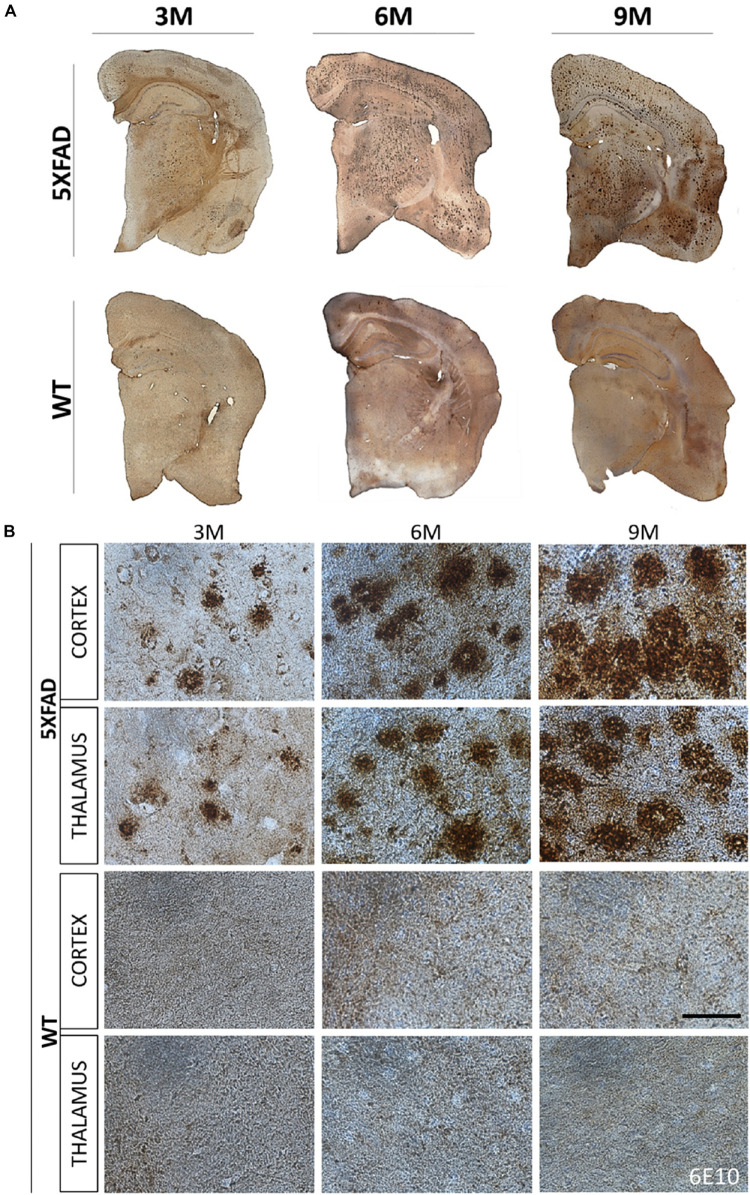
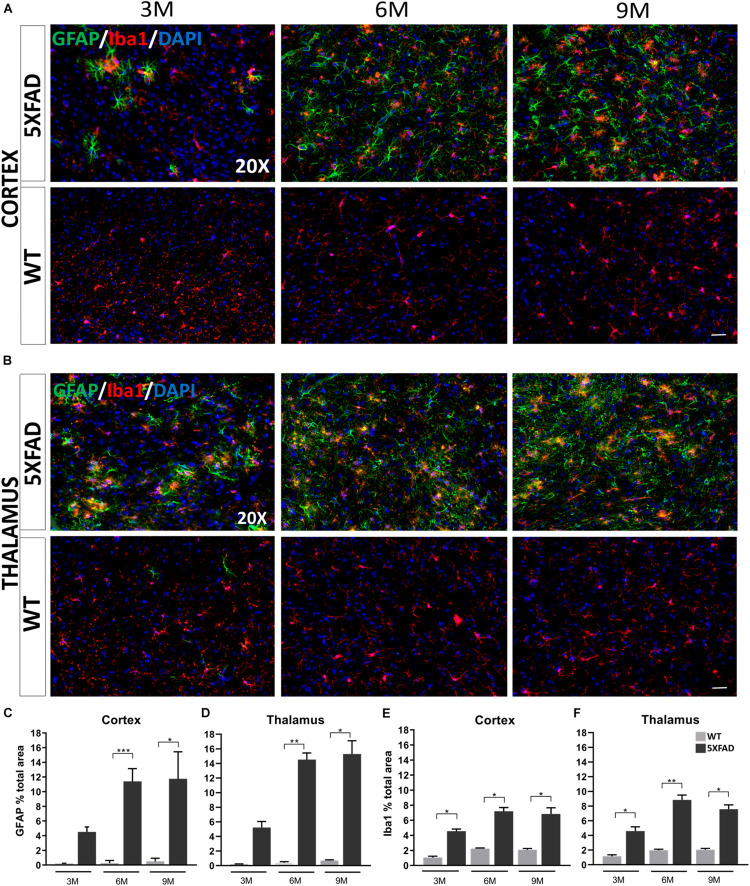
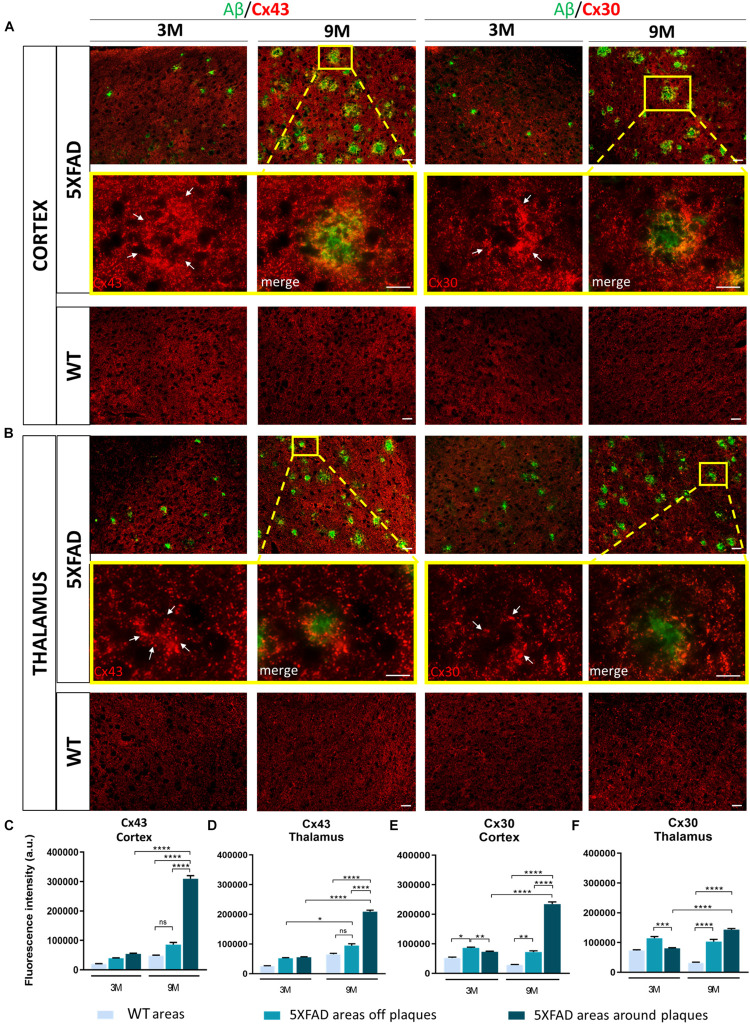
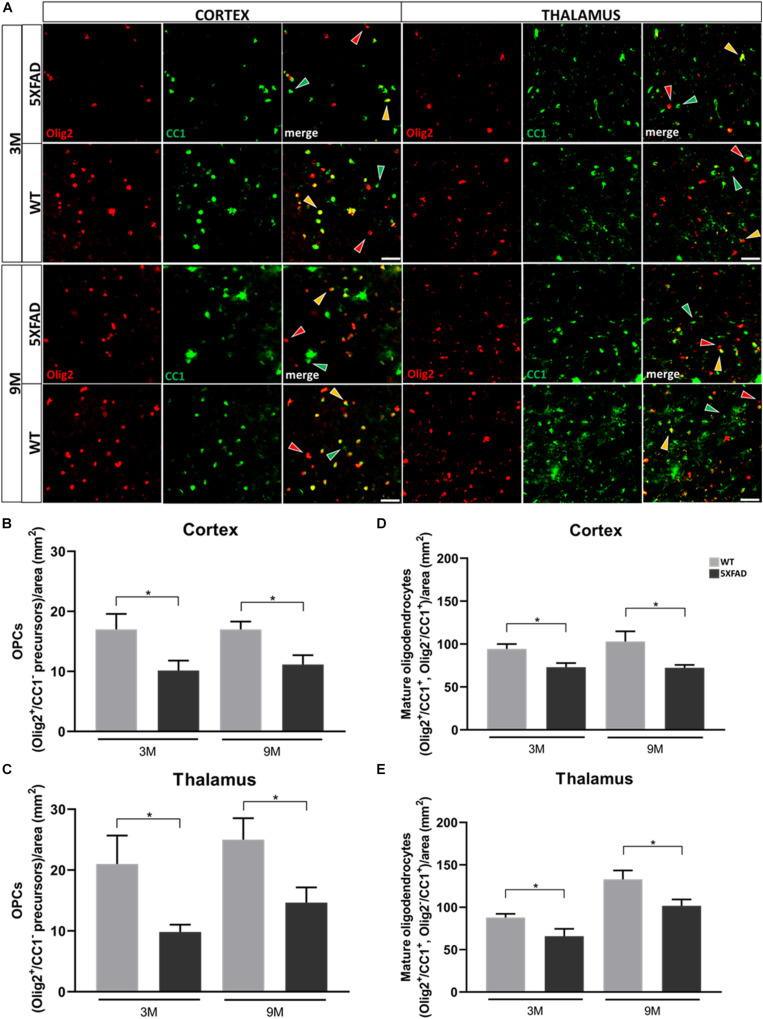
Glial gap junction proteins, called connexins (Cxs), form gap junctions in the central nervous system (CNS) to allow the bidirectional cytosolic exchange of molecules between adjacent cells. Their involvement in inheritable diseases and the use of experimental animal models that closely mimic such diseases revealed the critical role of glial GJs in myelination and homeostasis. Cxs are also implicated in acquired demyelinating disorders, such as Multiple Sclerosis (MS) and Alzheimer's disease (AD). Animal and human studies have revealed a role of the astrocytic Cx43 in the progression of AD but the role of Cx47, which is the main partner of Cx43 in the astrocyte-oligodendrocyte GJs is still unknown. The aim of this study was to investigate the astrocytic connexins, Cx43 and Cx30 in relation to oligodendrocytic Cx47 in the cortex and thalamus of the 5XFAD mouse model of AD. The model was characterized by increased Aβ deposition, gliosis, neuronal loss, and memory impairment. Compared to wild-type mice, Cx43 and Cx30 showed increased immunoreactivity in older 5XFAD mice, reflecting astrogliosis, while Cx47 immunoreactivity was reduced. Moreover, Cx47 GJ plaques showed reduced colocalization with Cx43 plaques. Oligodendrocyte precursor cells (OPCs) and mature oligodendrocyte populations were also depleted, and myelin deficits were observed. Our findings indicate reduced astrocyte-oligodendrocyte gap junction connectivity and possibly a shift in Cx43 expression toward astrocyte-astrocyte gap junctions and/or hemichannels, that could impair oligodendrocyte homeostasis and myelination. However, other factors, such as Aβ toxicity, could directly affect oligodendrocyte survival in AD. Our study provides evidence that Cxs might have implications in the progression of AD, although the role of oligodendrocyte Cxs in AD requires further investigation.

Keywords: Alzheimer’s disease; Cx30; Cx43; Cx47; gap junctions.


Figures

FIGURE 1
FIGURE 1
Progressive formation of Aβ plaques in 5XFAD mice. Brain DAB immunohistochemistry showed Aβ deposition in three age groups of 5XFAD mice (3, 6, and 9 months). (A) Coronal brain hemi-sections (12 μm thick) were stained with 6E10 primary antibody followed by DAB chromogen to reveal individual plaques (brown dots) in the cortex, thalamus and hippocampus. (B) Aβ plaque deposition increased tremendously with age as shown in higher magnification images of 5XFAD as opposed to WT mice in both brain areas. Scale bar = 50 μm in (B).
FIGURE 2
FIGURE 2
Neuronal loss and cognitive decline in 5XFAD mice. (A) Immunofluorescence staining of cortical areas from 5XFAD and WT mice with neuronal marker NeuN+ (green) labeling neurons. Cell nuclei are counterstained with DAPI (blue). Cortical layer V is indicated with dotted lines and limits of other cortical layers are indicated with white lines. (B) Immunofluorescence staining of thalamic areas from 5XFAD and WT mice with neuronal marker NeuN+ (green) labeling neurons. (C) Quantification of the mean number of neurons in cortical layer V indicates neuronal loss in 6- and 9-months-old compared to 3-months-old 5XFAD mice. (D) In the thalamus, quantification of the mean number of neurons shows there is neuronal loss in 9-months-old 5XFAD compared to 3-months-old 5XFAD. [One-way ANOVA followed by Sidak’s multiple comparisons test, 5XFAD mice/age (n = 6), WT mice/age (n = 6)]. (E) T-maze behavioral test indicates reduced alternation percentage in 5XFAD mice in both age groups [unpaired t-test, 6M 5XFAD mice (n = 20), 6M WT mice (n = 18), 9M 5XFAD mice (n = 12), 9M WT mice (n = 12)]. Graphs show the mean and error bars indicate the standard error of the mean (SEM). Significance is given as: *p = 0.0332, **p = 0.0021, ***p = 0.0002, ****p < 0.0001. Scale bars = 50 μm in (A,B).
FIGURE 3
FIGURE 3
Progressive inflammation and astrogliosis in the RSP, MOp and MOs areas of cortical layer V and in the PO and VPM nucleus of the thalamus in 5XFAD mice. (A,B) Double immunofluorescence staining of cortical and thalamic areas from 5XFAD and WT mice, with astrocytic marker, GFAP (green) and microglial marker, Iba1 (red). 5XFAD mice showed increased gliosis in both brain areas in older ages, while WT mice showed no astrogliosis. Quantification of the percentage of the total area covering GFAP+ astrocytes (C,D) and Iba1+ microglia (E,F) in both brain areas confirmed increased astrogliosis reaching plateau in 9-months-old 5XFAD mice. The statistical analysis was performed by one-way ANOVA followed by Kruskal-Wallis multiple comparisons test [5XFAD mice/age (n = 6), WT mice/age (n = 6)]. Graphs show the mean and error bars indicate the standard error of the mean (SEM). Significance is given as: *p = 0.0332, **p = 0.0021, ***p = 0.0002. Scale bars = 50 μm in (A,B).
FIGURE 4
FIGURE 4
Increased immunoreactivity of Cx43 and Cx30 in areas around Aβ plaques in the RSP, MOp and MOs areas of cortical layer V and in the PO and VPM nucleus of the thalamus of 3 and 9-months-old 5XFAD mice. Double immunofluorescence staining of cortical and thalamic areas from 5XFAD and WT mice, with Aβ antibody (clone 6E10, green) and Cx43 or Cx30 (red). (A,B) 5XFAD mice at the age of 9-months showed increased immunoreactivity of Cx43 and Cx30 in the perimeter of Aβ plaques. Higher magnification images clearly show this phenomenon. (C–F) Quantification of the fluorescence intensity of Cx43 and Cx30 in areas around and away from Aβ plaques in 5XFAD mice and in areas in WT mice. Increased immunoreactivity of Cx43 and Cx30 was detected in the perimeter of Aβ plaques compared to areas off Aβ plaques in 5XFAD mice and in WT areas. The statistical analysis was performed by one-way ANOVA followed by Kruskal-Wallis multiple comparisons test [5XFAD mice/age (n = 6), WT mice/age (n = 6)]. Graphs show the mean and error bars indicate the standard error of the mean (SEM). Significance is given as: *p = 0.0332, **p = 0.0021, ***p = 0.0002, ****p < 0.0001. Scale bars = 50 μm in (A,B); 25 μm in higher magnification insets.
FIGURE 5
FIGURE 5
Cx43 and Cx30 mRNA and protein levels in the brain of 5XFAD mice. (A,C) Cx43 mRNA levels drop significantly at all ages of 5XFAD mice compared to WT controls in both cortex and thalamus. (B,D) However, quantification of immunoblots showed increased protein levels of Cx43 in 3- and 9-months-old 5XFAD mice compared to their WT controls, respectively. (E,G) Cx30 mRNA levels were similar at all ages of 5XFAD mice compared to WT controls in the cortex, except in thalamus where a significant drop was shown. (F,H) The quantification of immunoblots showed similar levels of Cx30 protein in both brain areas. The asterisks inside the columns of mRNA graphs indicate the p-values representing significance of connexin levels in 5XFAD compared to WT controls, while the asterisks outside the columns represent the significance of connexin levels between different age groups of 5XFAD mice. The statistical analysis for mRNA was performed by one-way ANOVA followed by Kruskal-Wallis multiple comparisons test [5XFAD mice/age (n = 6), WT mice/age (n = 6)], while the immunoblot analysis was performed by unpaired t-test [5XFAD mice/age (n = 3), WT mice/age (n = 3)]. Graphs show the mean and error bars indicate the standard error of the mean (SEM). Significance is given as: *p = 0.0332, **p = 0.0021, ***p = 0.0002, ****p < 0.0001.
FIGURE 6
FIGURE 6
Decreased immunoreactivity of Cx47 in RSP, Mop, and MOs areas of cortical layer V and in the PO and VPM nucleus of the thalamus in 3- and 9-months-old 5XFAD mice. (A) Double immunostaining for Aβ/Cx47 in cortical and thalamic areas showed decreased Cx47 immunoreactivity of 5XFAD mice in both ages compared to WT mice. Zoomed images show the Cx47 puncta in more detail. (B) Double immunostaining for CC1/Cx47 in cortical and thalamic areas in the presence of Aβ plaques, in 5XFAD and WT mice. Cx47-positive GJ plaques were expressed by mature oligodendrocytes. Cell nuclei were counterstained with DAPI (blue). (C,D) Quantification of Cx47 fluorescence intensity confirmed a decreased immunoreactivity as observed in the immunostainings. The statistical analysis was performed by unpaired t-test [5XFAD mice/age (n = 6), WT mice/age (n = 6)]. Graphs show the mean and error bars indicate the standard error of the mean (SEM). Significance is given as: *p = 0.0332. Scale bars = 10 μm in (A,B); 5 μm in higher magnification insets.
FIGURE 7
FIGURE 7
Depletion of OPC and mature oligodendrocyte numbers in 3- and 9-months-old in 5XFAD mice. (A) Double immunostaining for Olig2/CC1 in cortical and thalamic areas of 5XFAD and WT mice. Yellow, green and red arrows depict Olig2+/CC1+ mature oligodendrocytes, Olig2/CC1+ mature oligodendrocytes and Olig2+/CC1 OPCs, respectively. (B) Mean numbers of OPCs in the cortex and thalamus (C). (D) Total mean numbers of mature oligodendrocytes (Olig2+/CC1+, Olig2/CC1+ cells) in the cortex and thalamus (E). The statistical analysis was performed by unpaired t-test [5XFAD mice/age (n = 6), WT mice/age (n = 6)]. Graphs show the mean and error bars indicate the standard error of the mean (SEM). Significance is given as: *p = 0.0332. Scale bar = 50 μm.
FIGURE 8
FIGURE 8
Myelin disruption in the microenvironment of Aβ plaques in 9-months-old 5XFAD mice. Double immunofluorescence staining of corpus callosum (CC), cortex and thalamus of 5XFAD and WT mice with Aβ and myelin marker PLP (myelin proteolipid protein). The myelin structure is disrupted in the area surrounding Aβ plaques (white arrows) in the CC (A–D), cortex (F–I) and thalamus (K–N) in 5XFAD mice compared to myelin immunoreactivity in the respective areas in WT mice (E,J,O) which appears normal. Magnification x20 in (A,F,K). Magnification x40 in (B–E,G–J,L–O). Scale bars = 100 μm.

References

    1. Agosta F., Libera D. D., Spinelli E. G., Finardi A., Canu E., Bergami A., et al. (2014). Myeloid microvesicles in cerebrospinal fluid are associated with myelin damage and neuronal loss in mild cognitive impairment and alzheimer disease. Ann. Neurol. 76 813–825. 10.1002/ana.24235 - DOI - PubMed
    1. Aronica E., Gorter J. A., Jansen G. H., Leenstra S., Yankaya B., Troost D. (2001). Expression of connexin 43 and connexin 32 gap-junction proteins in epilepsy-associated brain tumors and in the perilesional epileptic cortex. Acta Neuropathol. 101 449–459. 10.1007/s004010000305 - DOI - PubMed
    1. Balez R., Ooi L. (2016). Getting to NO Alzheimer’s disease: neuroprotection versus neurotoxicity mediated by nitric oxide. Oxid. Med. Cell. Longev. 2016:3806157. 10.1155/2016/3806157 - DOI - PMC - PubMed
    1. Bautista W., McCrea D. A., Nagy J. I. (2014). Connexin36 identified at morphologically mixed chemical/electrical synapses on trigeminal motoneurons and at primary afferent terminals on spinal cord neurons in adult mouse and rat. Neuroscience 263 159–180. 10.1016/j.neuroscience.2013.12.057 - DOI - PMC - PubMed
    1. Behrendt G., Baer K., Buffo A., Curtis M. A., Faull R. L., Rees M. I., et al. (2013). Dynamic changes in myelin aberrations and oligodendrocyte generation in chronic amyloidosis in mice and men. Glia 61 273–286. 10.1002/glia.22432 - DOI - PubMed

LinkOut - more resources