. 2020 Sep 2:12:278.
doi: 10.3389/fnagi.2020.00278. eCollection 2020.

Structural Neural Correlates of Double Decision Performance in Older Adults

Affiliations

Structural Neural Correlates of Double Decision Performance in Older Adults

Jessica N Kraft et al. Front Aging Neurosci. .

Abstract

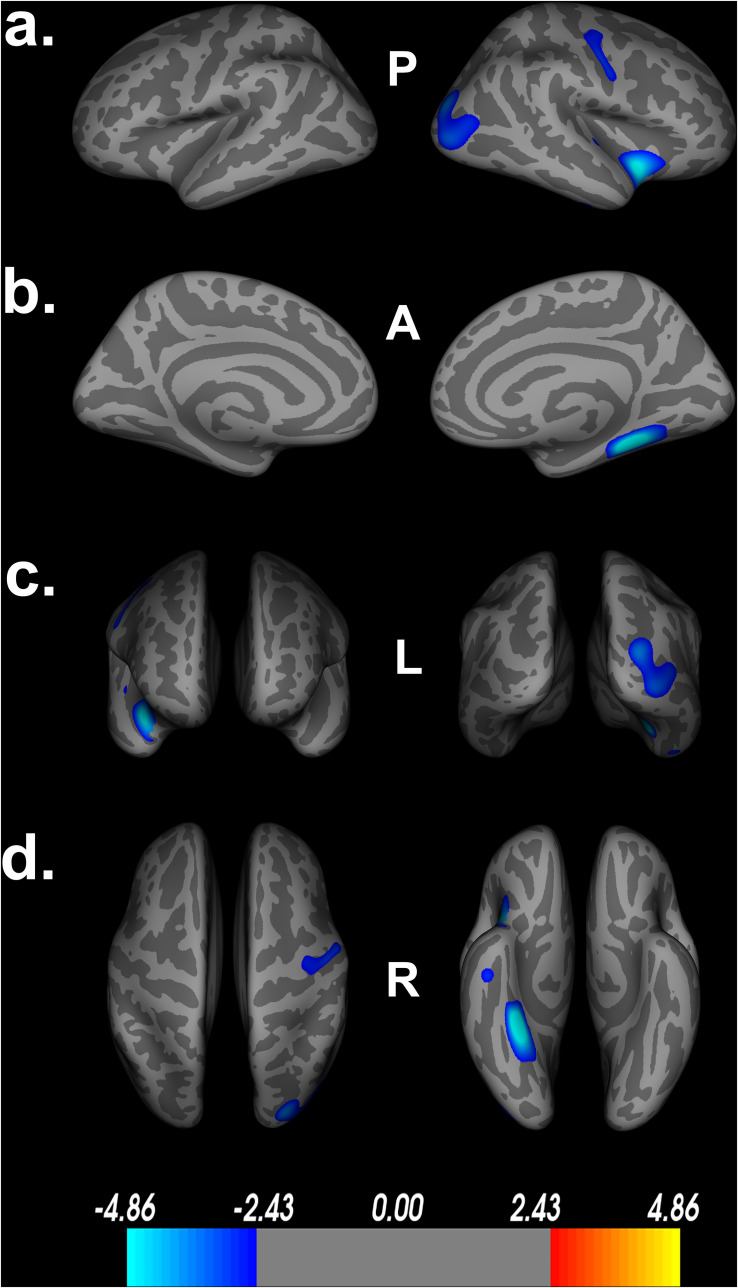
Speed of processing is a cognitive domain that encompasses the speed at which an individual can perceive a given stimulus, interpret the information, and produce a correct response. Speed of processing has been shown to decline more rapidly than other cognitive domains in an aging population, suggesting that this domain is particularly vulnerable to cognitive aging (Chee et al., 2009). However, given the heterogeneity of neuropsychological measures used to assess the domains underpinning speed of processing, a diffuse pattern of brain regions has been implicated. The current study aims to investigate the structural neural correlates of speed of processing by assessing cortical volume and speed of processing scores on the POSIT Double Decision task within a healthy older adult population (N = 186; mean age = 71.70 ± 5.32 years). T1-weighted structural images were collected via a 3T Siemens scanner. The current study shows that less cortical thickness in right temporal, posterior frontal, parietal and occipital lobe structures were significantly associated with poorer Double Decision scores. Notably, these include the lateral orbitofrontal gyrus, precentral gyrus, superior, transverse, and inferior temporal gyrus, temporal pole, insula, parahippocampal gyrus, fusiform gyrus, lingual gyrus, superior and inferior parietal gyrus and lateral occipital gyrus. Such findings suggest that speed of processing performance is associated with a wide array of cortical regions that provide unique contributions to performance on the Double Decision task.

Keywords: UFOV; cognitive aging; double decision; speed of processing; structural MRI; useful field of view.


Figures

FIGURE 1
FIGURE 1
Example of the POSIT Double Decision paradigm. Reproduced/adapted from POSIT Brain HQ, used with permission.
FIGURE 2
FIGURE 2
Decreased cortical thickness related to POSIT Double Decision scores. (a) left and right hemisphere lateral views, respectively. (b) left and right hemisphere medial views, respectively. (c) anterior and posterior views, respectively. (d) superior and inferior views, respectively. Model covariates: sex, education, scanner. P- posterior, A- anterior, L- left, R- right.
FIGURE 3
FIGURE 3
Significant relationships between Double Decision scores and cortical thickness. Scatterplots represent the relationship at the most significant vertex within the (A) fusiform gyrus, (B) insula, (C) lateral occipital gyrus, (D) precentral gyrus, (E) inferior temporal gyrus and (F) transverse temporal gyrus, controlling for education, sex and scanner covariates.
FIGURE 4
FIGURE 4
Decreased cortical thickness related to POSIT Double Decision scores for: I. education and scanner covariates only, II. sex and scanner covariates only and III. scanner covariate only. (row a) left and right hemisphere lateral views, respectively. (row b) left and right hemisphere medial views, respectively. (row c) anterior and posterior views, respectively. (row d) superior and inferior views, respectively. P- posterior, A- anterior, L- left, R- right.
FIGURE 5
FIGURE 5
Decreased cortical thickness related to POSIT Double Decision scores, covarying age, sex, education and scanner. (a) left and right hemisphere lateral views, respectively. (b) left and right hemisphere medial views, respectively. (c) anterior and posterior views, respectively. (d) superior and inferior views, respectively. P- posterior, A- anterior, L- left, R- right.
FIGURE 6
FIGURE 6
Decreased cortical thickness related to POSIT Double Decision scores using Monte Carlo simulations, set at 10,000 iterations and a cluster-wise threshold p = 0.05. (a) left and right hemisphere lateral views, respectively. (b) left and right hemisphere medial views, respectively. (c) anterior and posterior views, respectively. (d) superior and inferior views, respectively. P- posterior, A- anterior, L- left, R- right.
FIGURE 7
FIGURE 7
Random group assignment cortical thickness findings (n = 93 for each group; total n = 186). Significant clusters set at p > 0.01. (a) left and right hemisphere lateral views, respectively. (b) left and right hemisphere medial views, respectively. (c) anterior and posterior views, respectively. (d) superior and inferior views, respectively. P- posterior, A- anterior, L- left, R- right.

References

    1. Achiron A., Chapman J., Tal S., Bercovich E., Gil H., Achiron A. (2012). Superior temporal gyrus thickness correlates with cognitive performance in multiple sclerosis. Brain Struct. Funct. 218 943–950. 10.1007/s00429-012-0440-3 - DOI - PubMed
    1. Anton S. D., Woods A. J., Ashizawa T., Barb D., Buford T. W., Carter C. S., et al. (2015). Successful aging: advancing the science of physical independence in older adults. Ageing Research Reviews 24 304–327. 10.1016/j.arr.2015.09.005 - DOI - PMC - PubMed
    1. Aust F., Edwards J. D. (2017). Incremental validity of useful field of view subtests for the prediction of instrumental activities of daily living. J. Clin. Exp. Neuropsychol. 38 497–515. 10.1080/13803395.2015.1125453 - DOI - PMC - PubMed
    1. Ball K., Berch D. B., Helmers K. F., Jobe J. B., Leveck M. D., Marsiske M., et al. (2002). Effects of cognitive training interventions with older adults. JAMA 288:2271. 10.1001/jama.288.18.2271 - DOI - PMC - PubMed
    1. Ball K. K., Roenker D. L., Wadley V. G., Edwards J. D., Roth D. L., McGwin G., et al. (2006). Can high-risk older drivers be identified through performance-based measures in a department of motor vehicles setting? J. Am. Geriatr. Soc. 54 77–84. 10.1111/j.1532-5415.2005.00568.x - DOI - PubMed

LinkOut - more resources