. 2020 Sep 29:11:561390.
doi: 10.3389/fimmu.2020.561390. eCollection 2020.

Peritumoral Immune Infiltrate as a Prognostic Biomarker in Thin Melanoma

Affiliations

Peritumoral Immune Infiltrate as a Prognostic Biomarker in Thin Melanoma

Francesco Sabbatino et al. Front Immunol. .

Abstract

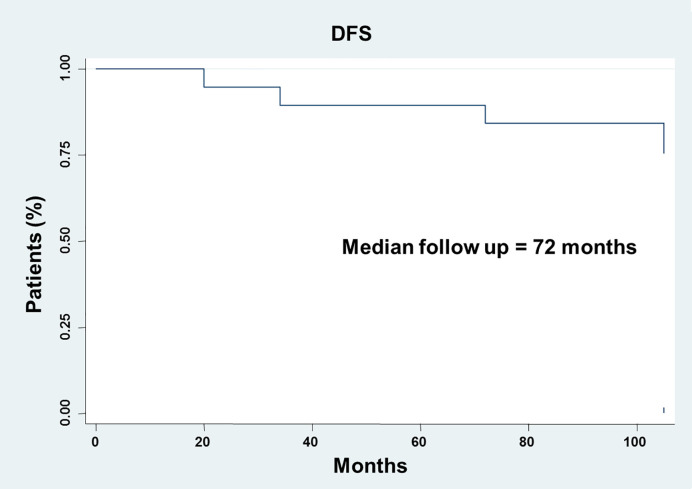
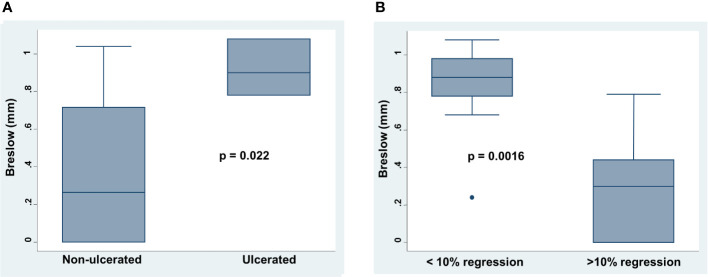
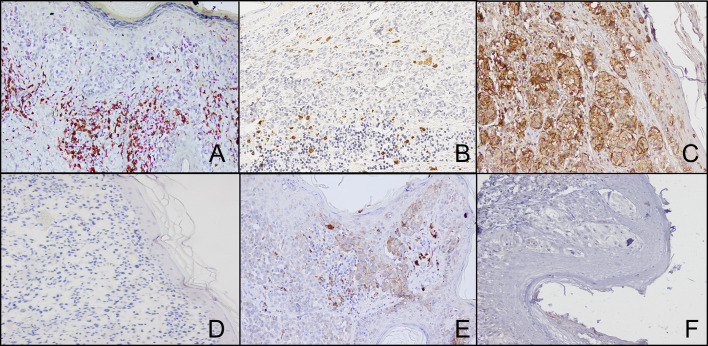
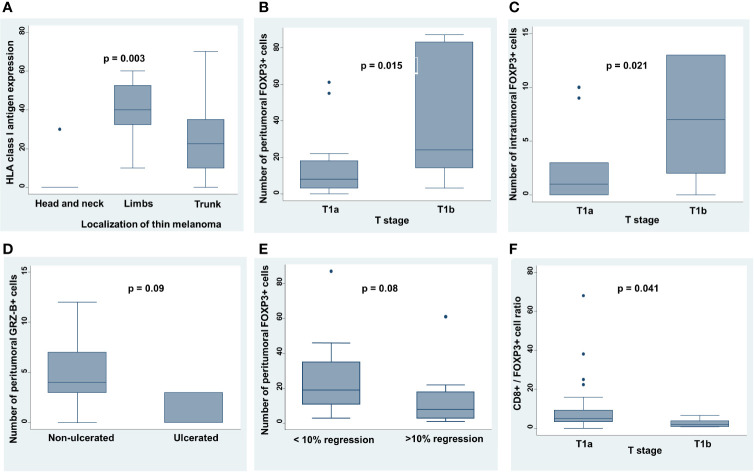
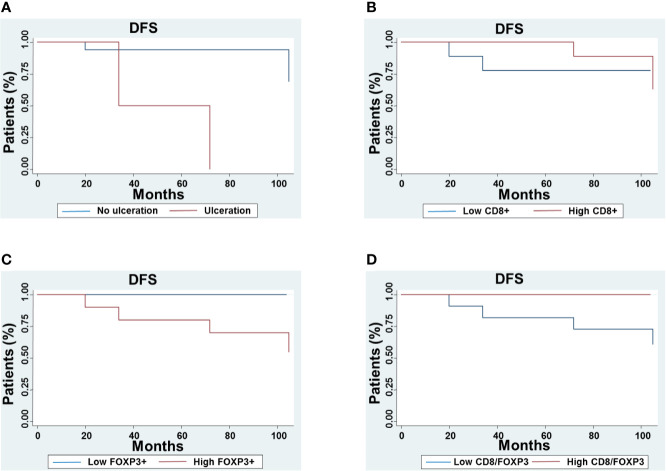
Thin melanomas are tumors less than 1 mm thick according to Breslow classification. Their prognosis is in most cases excellent. However, a small subset of these tumors relapses. These clinical findings emphasize the need of novel prognostic biomarkers to identify this subset of tumors. Characterization of tumor immune microenvironment (TIME) is currently investigated as a prognostic and predictive biomarker for cancer immunotherapy in several solid tumors including melanoma. Here, taking into account the limited availability of tumor tissues, by characterizing some of the characteristics of TIME such as number of infiltrating lymphocytes, HLA class I antigen and PD-L1 expression, we show that number of infiltrating CD8+ and FOXP3+ T cells as well as CD8+/FOXP3+ T cell ratio can represent a useful prognostic biomarker in thin melanoma. Although further investigations in a larger patient cohort are needed, these findings have potential clinical significance since they can be used to define subgroups of thin melanoma patients who have a worse prognosis and might need different treatment modalities.

Keywords: CD4; CD8; human leukocyte antigen class I antigens; prognosis; programmed death-ligand 1; thin melanoma; time; tumor-infiltrating lymphocytes.


Figures

Figure 1
Figure 1
Analysis of the disease-free survival (DFS) in thin melanoma. DFS analysis was analyzed using the Kaplan-Meier method.
Figure 2
Figure 2
Correlation between Breslow depth , presence of ulceration and tumor regression in thin melanoma. (A) Presence or absence of ulceration was correlated to Breslow depth by Mann-Whitney U test. (B) Presence or absence of regression at 10% cut off of extension was correlated to Breslow depth by Mann-Whitney U test. On each box, the central mark is the median, the edges of the box are the 25th and 75th percentiles, the whiskers extend to the most extreme data points note considered outliers, and outliers are plotted individually. p was considered significant if < 0.05.
Figure 3
Figure 3
Representative staining patterns of formalin-fixed, paraffin-embedded thin melanoma lesions with CD8- (A), FOXP3- (A), GRZ-B- (B), HLA class I antigen- (C) and PD-L1- (E) specific mAbs. Double IHC staining was performed utilizing CD8- (brown cells) and FOXP3- (red cells) specific mAbs (A). For HLA class I antigen detection tissue sections were IHC stained with a pool of mouse HLA-A–specific mAb HCA2 and HLA-B/C-specific mAb HC10 (ratio, 1:1). mAbs E7Q5L (IgG2b) and DA1E (IgG) were used as isotype controls for HLA class I antigen (D) and PD-L1 (F) staining, respectively. Magnification is 200X.
Figure 4
Figure 4
Correlation between clinicopathological features and TIME characteristics in thin melanoma. (A) Site of primary thin melanoma was correlated to HLA class I antigen expression level by Kruskal-Wallis rank test. (B, C) T stage (sec. TNM, AJCC 8th Edition) was correlated to the number of peritumoral and intratumoral FOXP3+ T cells by Mann-Whitney U test. (D) Presence or absence of ulceration was correlated to the number of peritumoral GRZ-B+ T cells by Mann-Whitney U test. (E) Number of peritumoral FOXP3+ T cells was correlated with presence or absence of regression at 10% cut off of extension by Mann-Whitney U test. (F) T stage (sec. TNM, AJCC 8th Edition) was correlated to CD8+/FOXP3+ T cell ratio by Mann-Whitney U test. On each box, the central mark is the median, the edges of the box are the 25th and 75th percentiles, the whiskers extend to the most extreme data points note considered outliers, and outliers are plotted individually. p was considered significant if < 0.05.
Figure 5
Figure 5
Correlation between disease-free survival (DFS) and TIME characteristics in thin melanoma. The DFS of patients with lesions grouped based on ulceration (A), number of peritumoral CD8+ T cells (B), FOXP3+ cells (C) and CD8+/FOXP3+ T cell ratio (D) was compared using the Kaplan–Meier method.

References

    1. Ferlay J, Colombet M, Soerjomataram I, Mathers C, Parkin DM, Piñeros M, et al. Estimating the global cancer incidence and mortality in 2018: GLOBOCAN sources and methods. Int J Cancer (2019) 144:1941–53. 10.1002/ijc.31937 - DOI - PubMed
    1. Siegel RL, Miller KD, Jemal A. Cancer statistics, 2019. CA Cancer J Clin (2019) 69:7–34. 10.3322/caac.21551 - DOI - PubMed
    1. Balch CM, Gershenwald JE, Soong S-J, Thompson JF, Atkins MB, Byrd DR, et al. Final version of 2009 AJCC melanoma staging and classification. J Clin Oncol (2009) 27:6199–206. 10.1200/JCO.2009.23.4799 - DOI - PMC - PubMed
    1. Durham AB, Schwartz JL, Lowe L, Zhao L, Johnson AG, Harms KL, et al. The natural history of thin melanoma and the utility of sentinel lymph node biopsy. J Surg Oncol (2017) 116:1185–92. 10.1002/jso.24765 - DOI - PubMed
    1. Yonick DV, Ballo RM, Kahn E, Dahiya M, Yao K, Godellas C, et al. Predictors of positive sentinel lymph node in thin melanoma. Am J Surg (2011) 201:324–27; discussion 327–28. 10.1016/j.amjsurg.2010.09.011 - DOI - PubMed

Publication types

MeSH terms