

Kidney Failure Associates With T Cell Exhaustion and Imbalanced Follicular Helper T Cells
- PMID: 33117396
- PMCID: PMC7552886
- DOI: 10.3389/fimmu.2020.583702
Kidney Failure Associates With T Cell Exhaustion and Imbalanced Follicular Helper T Cells
Abstract
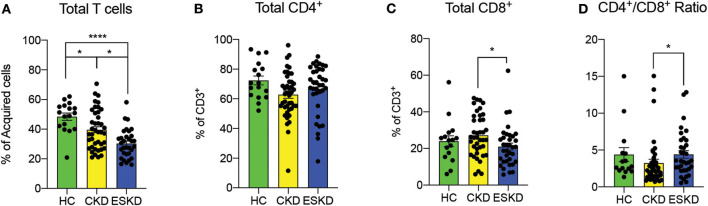
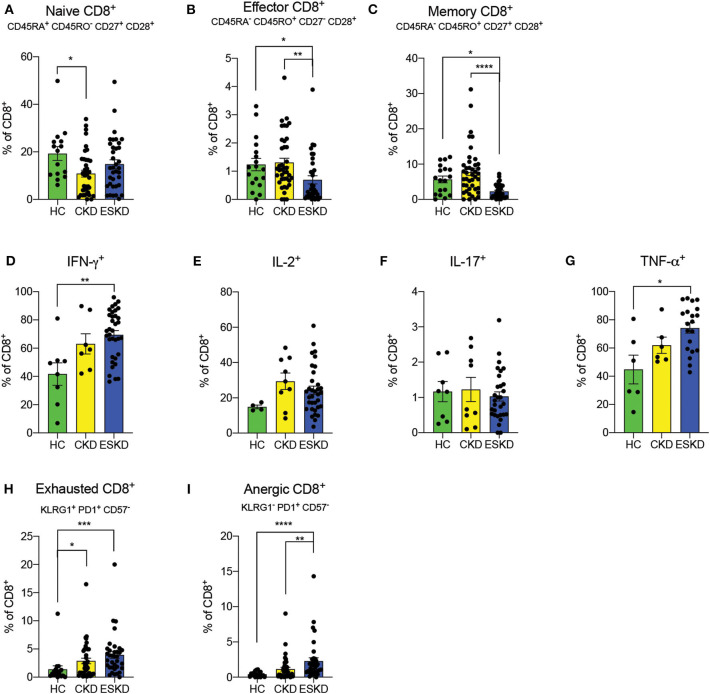
Individuals with kidney failure are at increased risk of cardiovascular events, as well as infections and malignancies, but the associated immunological abnormalities are unclear. We hypothesized that the uremic milieu triggers a chronic inflammatory state that, while accelerating atherosclerosis, promotes T cell exhaustion, impairing effective clearance of pathogens and tumor cells. Clinical and demographic data were collected from 78 patients with chronic kidney disease (CKD) (n = 42) or end-stage kidney disease (ESKD) (n = 36) and from 18 healthy controls (HC). Serum cytokines were analyzed by Luminex. Immunophenotype of T cells was performed by flow cytometry on peripheral blood mononuclear cells. ESKD patients had significantly higher serum levels of IFN-γ, TNF-α, sCD40L, GM-CSF, IL-4, IL-8, MCP-1, and MIP-1β than CKD and HC. After mitogen stimulation, both CD4+ and CD8+ T cells in ESKD group demonstrated a pro-inflammatory phenotype with increased IFN-γ and TNF-α, whereas both CKD and ESKD patients had higher IL-2 levels. CKD and ESKD were associated with increased frequency of exhausted CD4+ T cells (CD4+KLRG1+PD1+CD57-) and CD8+ T cells (CD8+KLRG1+PD1+CD57-), as well as anergic CD4+ T cells (CD4+KLRG1-PD1+CD57-) and CD8+ T cells (CD8+KLRG1-PD1+CD57-). Although total percentage of follicular helper T cell (TFH) was similar amongst groups, ESKD had reduced frequency of TFH1 (CCR6-CXCR3+CXCR5+PD1+CD4+CD8-), but increased TFH2 (CCR6-CXCR3-CXCR5+PD1+CD4+CD8-), and plasmablasts (CD3-CD56-CD19+CD27highCD38highCD138-). In conclusion, kidney failure is associated with pro-inflammatory markers, exhausted T cell phenotype, and upregulated TFH2, especially in ESKD. These immunological changes may account, at least in part, for the increased cardiovascular risk in these patients and their susceptibility to infections and malignancies.
Keywords: ESKD; T cell; dialysis (ESKD); exhaustion; immune phenotype; treg.
Copyright © 2020 Hartzell, Bin, Cantarelli, Haverly, Manrique, Angeletti, Manna, Murphy, Zhang, Levitsky, Gallon, Yu and Cravedi.
Figures


References
-
- United States Renal Data System USRDS annual data report: Epidemiology of kidney disease in the United States. (2019). Available online at: https://www.usrds.org/2019/view/USRDS_2019_ES_final.pdf (accessed August 10, 2020).
Publication types
MeSH terms
Substances
Grants and funding
LinkOut - more resources
Full Text Sources
Research Materials
Miscellaneous