. 2020 Oct 7:10:568015.
doi: 10.3389/fonc.2020.568015. eCollection 2020.

PUF60/AURKA Axis Contributes to Tumor Progression and Malignant Phenotypes in Bladder Cancer

Affiliations

PUF60/AURKA Axis Contributes to Tumor Progression and Malignant Phenotypes in Bladder Cancer

Qian Long et al. Front Oncol. .

Abstract

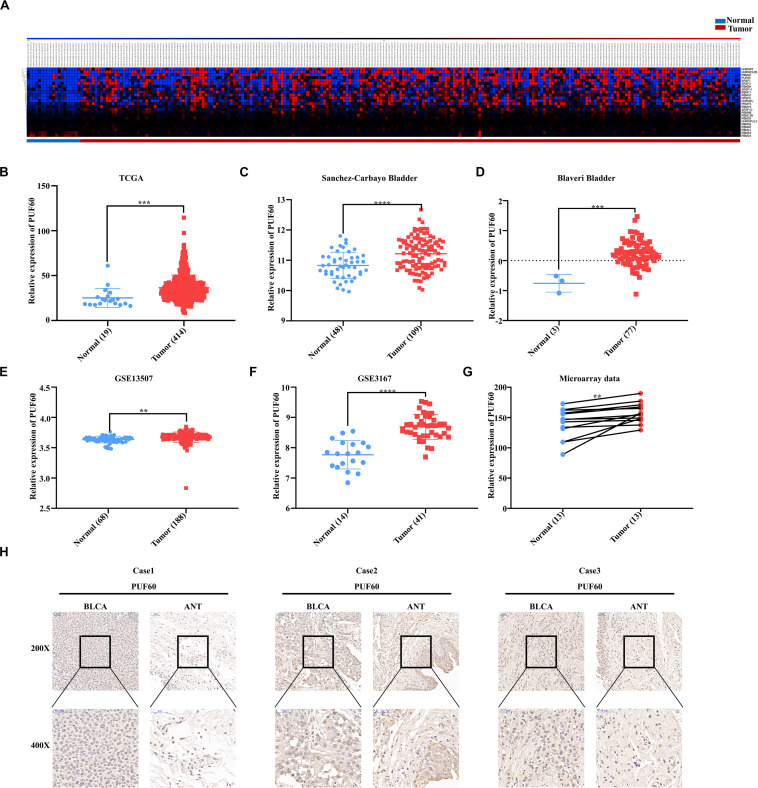
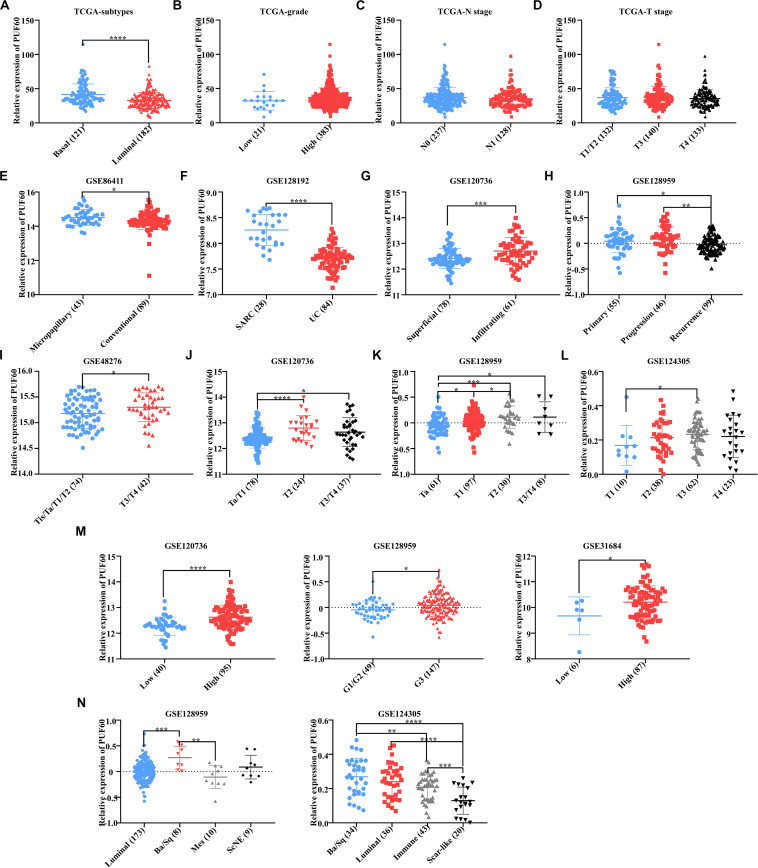
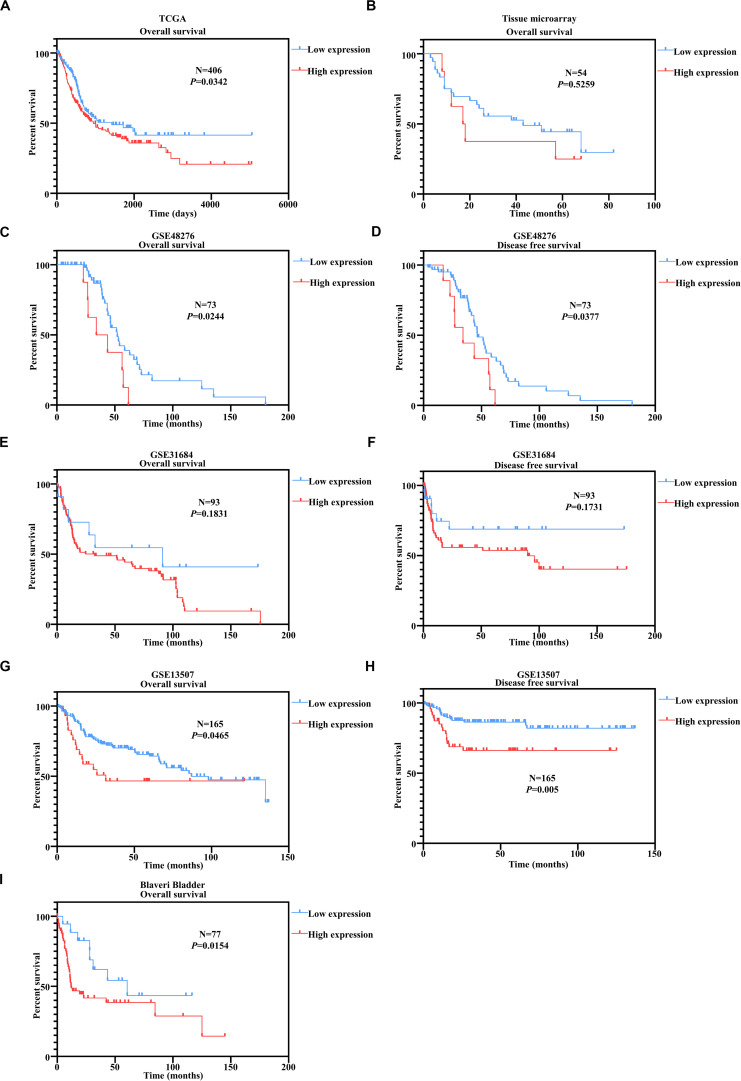
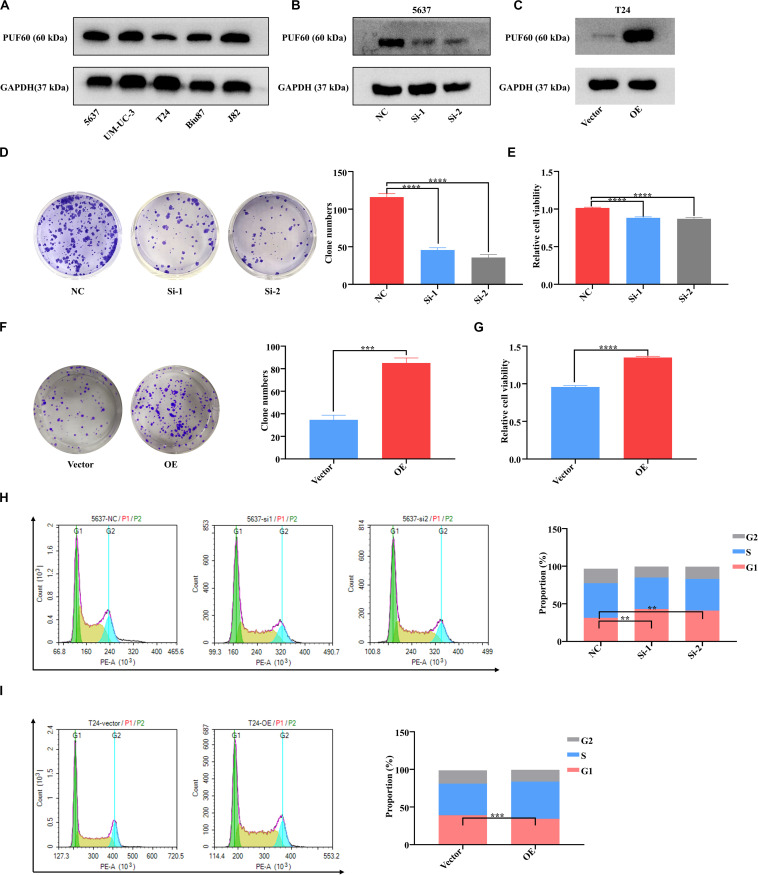
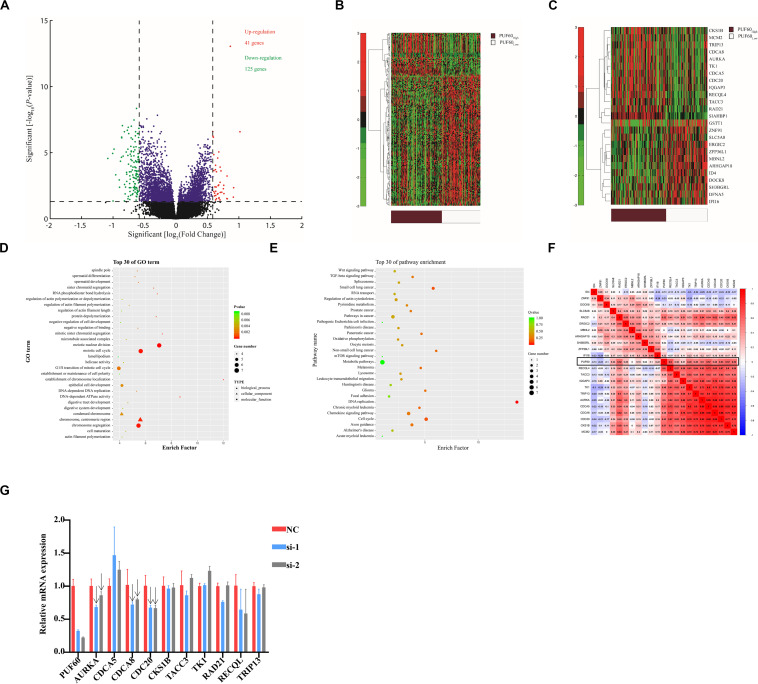
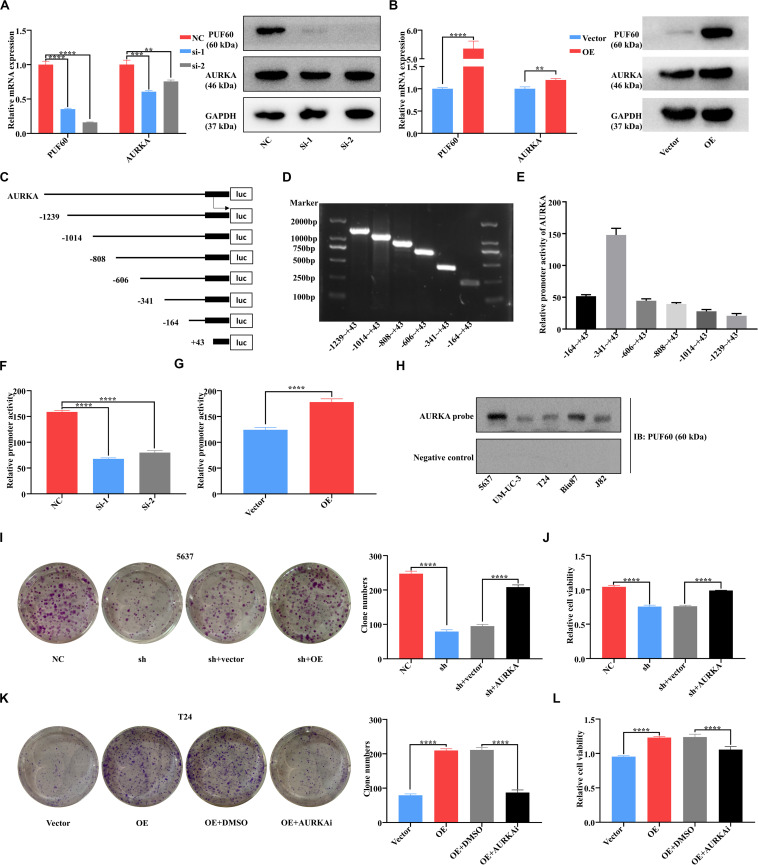
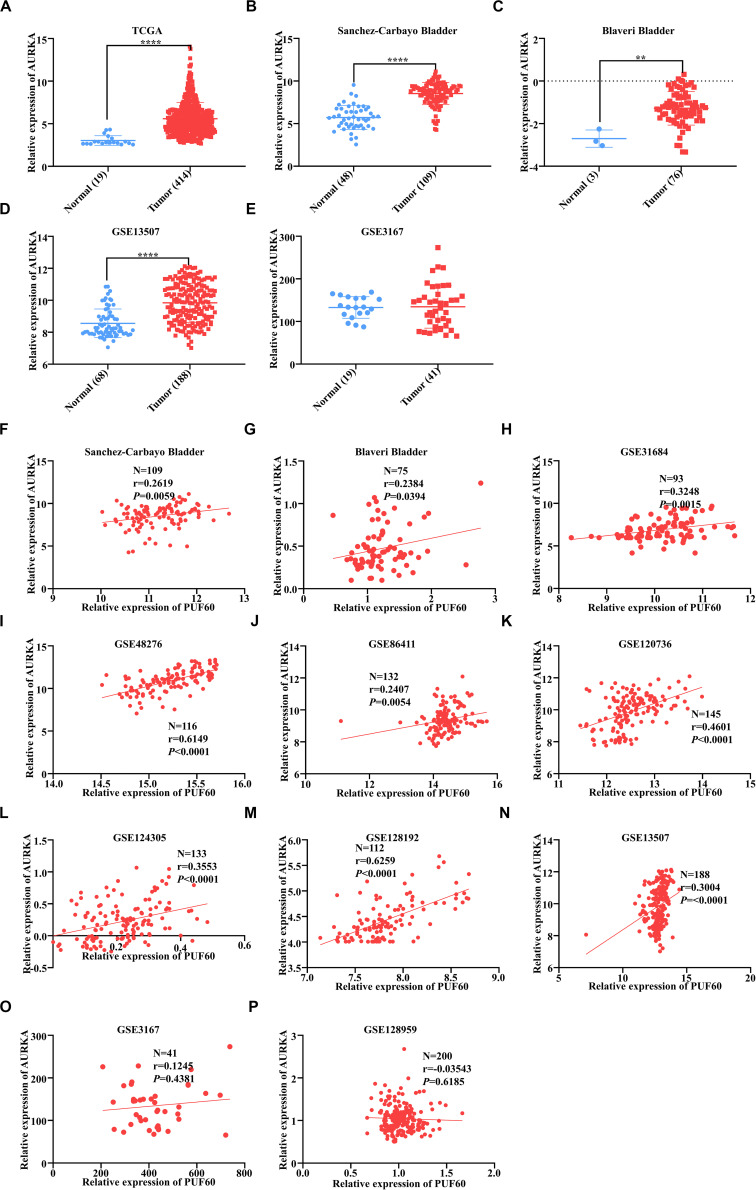
Abnormal expression or mutation of RNA splicing proteins are widely observed in human cancers. Here, we identified poly(U) binding splicing factor 60 (PUF60) as one of the most differentially expressed genes out of 97 RNA splicing proteins between normal and bladder cancer tissues by bioinformatics analysis of TCGA bladder cancer expression data. The expression of PUF60 was significantly higher in tumor tissues, while high PUF60 expression was associated with malignant phenotypes of bladder cancer and shorter survival time. Moreover, we identified aurora kinase A (AURKA) as a new downstream target of PUF60 in bladder cancer cells. PUF60 knockdown significantly inhibited cell viability and colony formation capacity in bladder cancer cells, whereas AURKA overexpression reversed this inhibition effect. Overexpression of PUF60 significantly promoted cell viability and colony formation in bladder cancer cells, while treatment with AURKA specific inhibitor reversed this promotive effect. Mechanistically, PUF60 specifically bound to the AURKA promoter, thereby activating its transcription and expression. Furthermore, we showed that there was a significant positive correlation between PUF60 and AURKA expression in bladder cancer tissues, and PUF60 and AURKA expression contributed to tumor progression and malignant phenotypes in the patients with bladder cancer. Collectively, these results indicate that the PUF60/AURKA axis plays a key role in regulating tumorigenesis and progression of bladder cancer, and may be a potential prognostic biomarker and therapeutic target for bladder cancer patients.

Keywords: AURKA; PUF60; biomarker; bladder cancer; transcriptional regulation.


Figures

FIGURE 1
FIGURE 1
PUF60 was highly expressed in bladder cancer. (A) Heat map of differentially expressed RNA splicing-related genes between normal bladder tissues and bladder cancer tissues of TCGA data. (B) Relative PUF60 mRNA expression in normal and tumor tissues from TCGA (P = 0.0007). (C,D) Relative PUF60 mRNA expression in normal and tumor tissues from two bladder cancer cohorts from Oncomine database (Sanchez-Carbayo Bladder: P < 0.0001; Blaveri Bladder: P = 0.0001). (E,F) Relative PUF60 mRNA expression in normal and tumor tissues of GSE13507 and GSE3167 from GEO database (GSE13507: P = 0.016; GSE3167: P < 0.0001). (G) Relative expression of PUF60 in paired normal and tumor tissues from tissue microarray data (P = 0.0051). (H) Three cases of representative IHC images of PUF60 in bladder cancer tissues (BLCA) and adjacent normal tissues (ANT). Data was analyzed by t-test; **P < 0.01, ***P < 0.001, ****P < 0.0001.
FIGURE 2
FIGURE 2
High PUF60 expression was associated with malignant phenotypes in bladder cancer. (A) Relative PUF60 mRNA expression in basal-like and luminal-like bladder cancer tissues from TCGA data (P < 0.0001). (B) Relative PUF60 mRNA expression in low and high grade bladder cancer tissues from TCGA data (P = 0.1219). (C) Relative PUF60 mRNA expression in lymph node negative (N0) and positive (N1) tissues from TCGA data (P = 0.1821). (D) Relative PUF60 mRNA expression of different T stage tissues from TCGA data (P = 0.3815). (E) Relative PUF60 mRNA expression in bladder micropapillary urothelial carcinoma and conventional urothelial carcinoma of GSE86411 data (P = 0.0381). (F) Relative PUF60 mRNA expression in sarcomatoid urothelial bladder cancer (SARC) and conventional bladder urothelial carcinoma (UC) of GSE128192 data (P < 0.0001). (G) Relative PUF60 mRNA expression in superficial and infiltrating bladder cancer of GSE120736 (P = 0.0002). (H) Relative PUF60 mRNA expression in primary, progressive and recurrent bladder cancer of GSE128959 data (Recurrence vs. Primary: P = 0.0323; Recurrence vs. Progressive: P = 0.0019). (I–L) Relative PUF60 mRNA expression in different T stage tissues of four independent GEO datasets: GSE48276 (I), GSE120736 (J), GSE128959 (K), GSE124305 (L) (GSE48276: P = 0.0359; GSE120736: T2 vs. Ta/T1: P < 0.0001, T3/T4 vs. Ta/T1: P = 0.0115; GSE128959: T1 vs. Ta: P = 0.0246, T2 vs. Ta: P = 0.0007, T3/T4 vs. Ta: P = 0.0416, T2 vs. T1: P = 0.0472; GSE124305: P = 0.0425). (M) Relative PUF60 mRNA expression in low and high grade bladder cancer from three independent GEO datasets (left to right: GSE120736, GSE128959, and GSE31684) (GSE120736: P < 0.0001; GSE128959: P = 0.0108; GSE31684: P = 0.0490). (N) Relative PUF60 mRNA expression in different molecular subtypes of GSE128959 (left) and GSE124305 (right); luminal, Luminal-like subtype bladder cancer; Ba/Sq, Basal/Squamous-like subtype bladder cancer; Mes, Mesenchymal-like subtype bladder cancer; ScNE, Small-cell/Neuroendocrine-like subtype bladder cancer; Immune, Immune subtype bladder cancer; Scar-like, Scar-like subtype bladder cancer (GSE128959: luminal vs. Ba/Sq: P = 0.0004, Ba/Sq vs. Mes: P = 0.0027; GSE124305: Ba/Sq vs. Scar-like: P < 0.0001, Ba/Sq vs. Immune: P = 0.0049, Luminal vs. Scar-like: P < 0.0001, Immune vs. Scar-like: P = 0.0003). Data was analyzed by t-test; *P < 0.05, **P < 0.01, ***P < 0.001, ****P < 0.0001.
FIGURE 3
FIGURE 3
PUF60 predicted unfavorable outcomes in bladder cancer patients. (A) Kaplan–Meier analysis of overall survival according to the PUF60 mRNA expression from TCGA data. (B) Kaplan–Meier analysis of overall survival according to the PUF60 protein expression from tissue microarray data. (C,D) Kaplan–Meier analysis of overall (left) and disease free survival (right) according to the PUF60 mRNA expression from GSE48276 data. (E,F) Kaplan–Meier analysis of overall (left) and disease free survival (right) according to the PUF60 mRNA expression from GSE31684 data. (G,H) Kaplan–Meier analysis of overall (left) and disease free survival (right) according to the PUF60 mRNA expression from GSE13507 data. (I) Kaplan–Meier analysis of overall (left) and disease free survival (right) according to the PUF60 mRNA expression from Blaveri bladder studies.
FIGURE 4
FIGURE 4
PUF60 promoted bladder cancer cell growth and cell cycle progression. (A) Endogenous expression of PUF60 was detected by western blot in different bladder cancer cell lines. (B) PUF60 expression was knocked down by its specific siRNAs in 5637 cells and detected by western blot. (C) PUF60 was overexpressed in T24 cells and detected by western blot. (D,E) Knockdown of PUF60 inhibited the clonogenicity (D) and cell viability (E) of 5637 cells (D: NC vs. Si-1: P < 0.0001, NC vs. Si-2: P < 0.0001; E: NC vs. Si-1: P < 0.0001, NC vs. Si-2: P < 0.0001). (F,G) Overexpression of PUF60 promoted the clonogenicity (F) and cell viability (G) of T24 cells (F: OE vs. vector: P = 0.0001; G: OE vs. vector: P < 0.0001). (H) Knockdown of PUF60 inhibited cell cycle progression in 5637 cells (NC vs. Si-1: P = 0.0018, NC vs. Si-2: P < 0.0027). (I) Overexpression of PUF60 promoted cell cycle progression in T24 cells (OE vs. vector: P = 0.0005). Data was analyzed by t-test; **P < 0.01, ***P < 0.001, ****P < 0.0001.
FIGURE 5
FIGURE 5
Associations between genome-wide expression profiles and PUF60 expression. (A) Volcano plot of differentially expressed gene profiles between PUF60high and PUF60low. (B) Expression heat map of PUF60-associated genes between PUF60high and PUF60low. (C) Expression heat map of differentially expressed genes closely related to bladder cancer development. (D,E) GO and KEGG analyses of differentially expressed genes between PUF60high and PUF60low. (F) Correlation between PUF60 and genes identified relevant to bladder cancer development from TCGA data. (G) mRNA levels of PUF60 and its possible downstream genes were detected by real time q-PCR in cells with PUF60 knockdown.
FIGURE 6
FIGURE 6
PUF60 promoted bladder cancer cell growth via transcriptionally upregulating AURKA expression. (A) PUF60 and AURKA expression was detected by RT-qPCR and western blot in 5637 cells with PUF60 knocked down (PUF60: NC vs. Si-1: P < 0.0001, NC vs. Si-2: P < 0.0001; AURKA: NC vs. Si-1: P = 0.0005, NC vs. Si-2: P < 0.0032). (B) PUF60 and AURKA expression was detected by RT-qPCR and western blot in T24 cells overexpressing PUF60 (PUF60: OE vs. vector: P < 0.0001; AURKA: OE vs. vector: P = 0.0033). (C) Ideograph of different segments of AURKA promoter. (D) Different segments of AURKA promoter were amplified by PCR using specific primers, and PCR products were detected by agarose gel electrophoresis. (E) Relative promoter activity of different segments of AURKA promoter measured by dual luciferase assay. (F) Relative activity of AURKA promoter was measured after knockdown of PUF60 in 5637 cells (NC vs. Si-1: P < 0.0001, NC vs. Si-2: P < 0.0001). (G) Relative activity of AURKA promoter was measured after overexpression of PUF60 in T24 cells (OE vs. vector: P < 0.0001). (H) Binding of PUF60 on the 5′-biotin labeled AURKA promoter probe or a control non-specific probe was detected by Western blot using anti-PUF60 antibody. (I,J) Knockdown of PUF60 inhibited the clonogenicity (I) and viability (J) of 5637 cells, which was reversed by AURKA overexpression (I: NC vs. sh: P < 0.0001, sh + vector vs. sh + AURKA: P < 0.0001; J: NC vs. sh: P < 0.0001, sh + vector vs. sh + AURKA: P < 0.0001). (K,L) Overexpression of PUF60 promoted the clonogenicity (K) and viability (L) of T24 cells, which was reversed by AURKA inhibitor (K: OE vs. vector: P < 0.0001, OE + DMSO vs. OE + AURKAi: P < 0.0001; L: OE vs. vector: P < 0.0001, OE + DMSO vs. OE + AURKAi: P < 0.0001). Clonogenicity was determined by colony formation assay. Viability was measured by MTS assay. Data was analyzed by t-test; **P < 0.01, ***P < 0.001, ****P < 0.0001.
FIGURE 7
FIGURE 7
AURKA was highly expressed and positively correlated with PUF60 expression in bladder cancer. (A–E) Relative AURKA mRNA expression between normal and tumor tissues in TCGA data (A), Sanchez-Carbayo bladder study (B), Blaveri bladder study (C), GEO13507 (D), and GEO3167 data (E) (A: P < 0.0001; B: P < 0.0001; C: P = 0.0026; D: P < 0.0001; E: P = 0.8837). (F–P) The correlation between AURKA and PUF60 mRNA expression in all datasets used before. Data was analyzed by t-test; **P < 0.01, ****P < 0.0001.

References

    1. Bray F, Ferlay J, Soerjomataram I, Siegel RL, Torre LA, Jemal A. Global cancer statistics 2018: GLOBOCAN estimates of incidence and mortality worldwide for 36 cancers in 185 countries. CA Cancer J Clin. (2018) 68:394–424. 10.3322/caac.21492 - DOI - PubMed
    1. Kamat AM, Hahn NM, Efstathiou JA, Lerner SP, Malmström P-U, Choi W, et al. Bladder cancer. Lancet. (2016) 388:2796–810. 10.1016/s0140-6736(16)30512-8 - DOI - PubMed
    1. Paner GP, Stadler WM, Hansel DE, Montironi R, Lin DW, Amin MB. Updates in the Eighth Edition of the tumor-node-metastasis staging classification for urologic cancers. Eur Urol. (2018) 73:560–9. 10.1016/j.eururo.2017.12.018 - DOI - PubMed
    1. Gallan AJ, Choy B, Paner GP. Contemporary grading and staging of urothelial neoplasms of the urinary bladder: new concepts and approaches to challenging scenarios. Surg Pathol Clin. (2018) 11:775–95. 10.1016/j.path.2018.07.006 - DOI - PubMed
    1. Lerner SP, McConkey DJ, Hoadley KA, Chan KS, Kim WY, Radvanyi F, et al. Bladder cancer molecular taxonomy: summary from a consensus meeting. Bladder Cancer. (2016) 2:37–47. 10.3233/BLC-150037 - DOI - PMC - PubMed