

An "Infodemic": Leveraging High-Volume Twitter Data to Understand Early Public Sentiment for the Coronavirus Disease 2019 Outbreak
- PMID: 33117854
- PMCID: PMC7337776
- DOI: 10.1093/ofid/ofaa258
An "Infodemic": Leveraging High-Volume Twitter Data to Understand Early Public Sentiment for the Coronavirus Disease 2019 Outbreak
Abstract
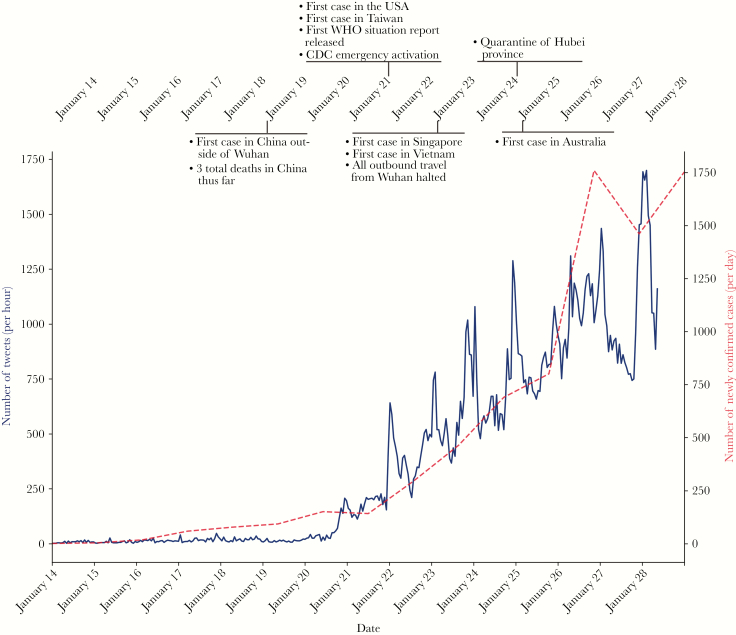
Background: Twitter has been used to track trends and disseminate health information during viral epidemics. On January 21, 2020, the Centers for Disease Control and Prevention activated its Emergency Operations Center and the World Health Organization released its first situation report about coronavirus disease 2019 (COVID-19), sparking significant media attention. How Twitter content and sentiment evolved in the early stages of the COVID-19 pandemic has not been described.
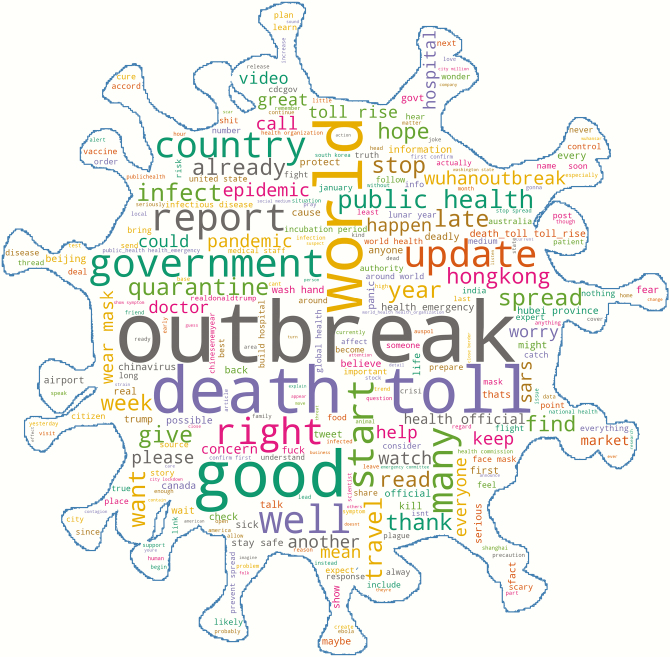
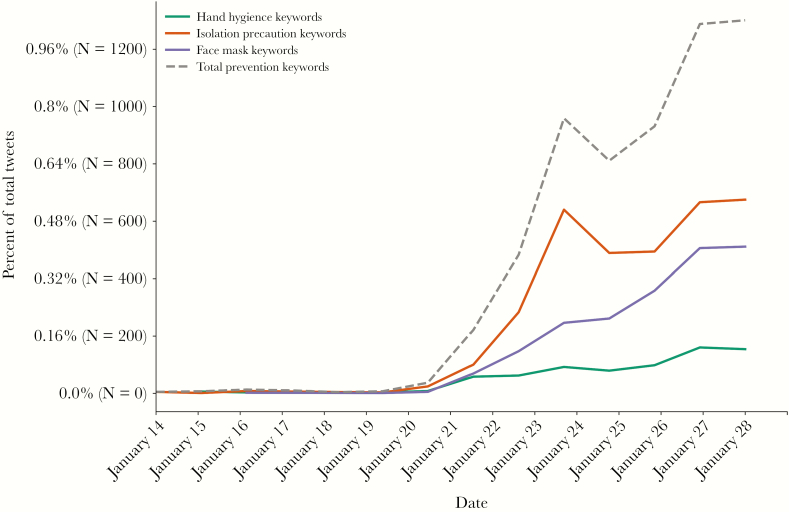
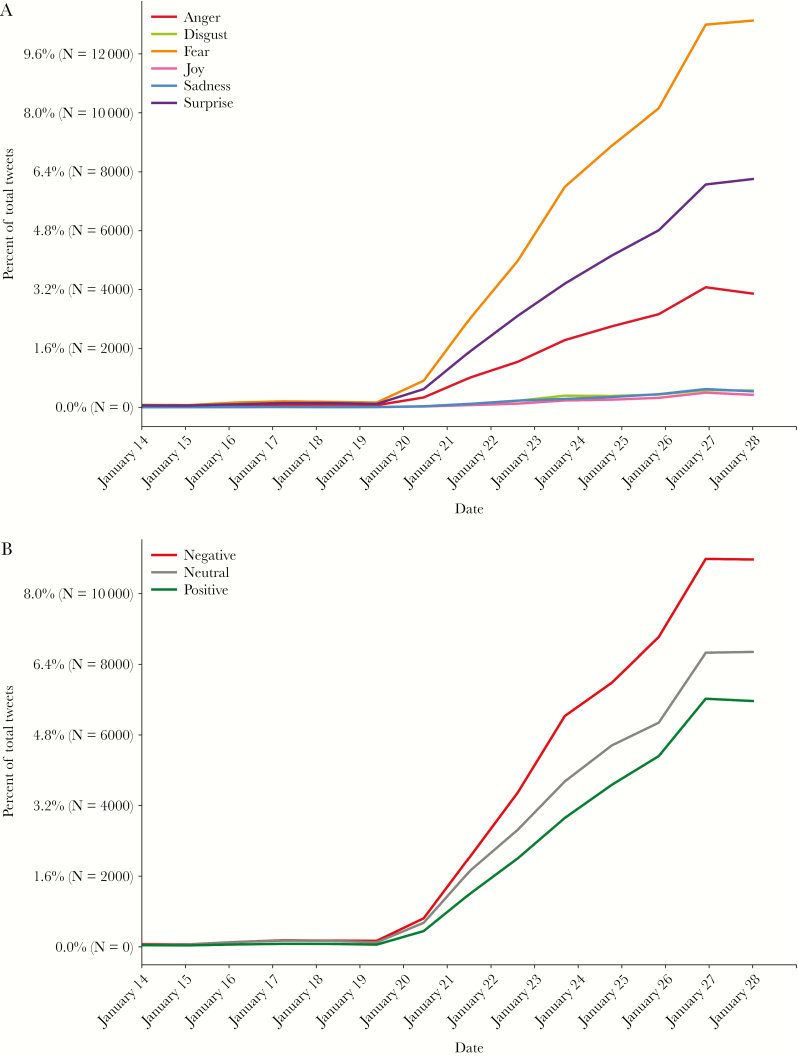
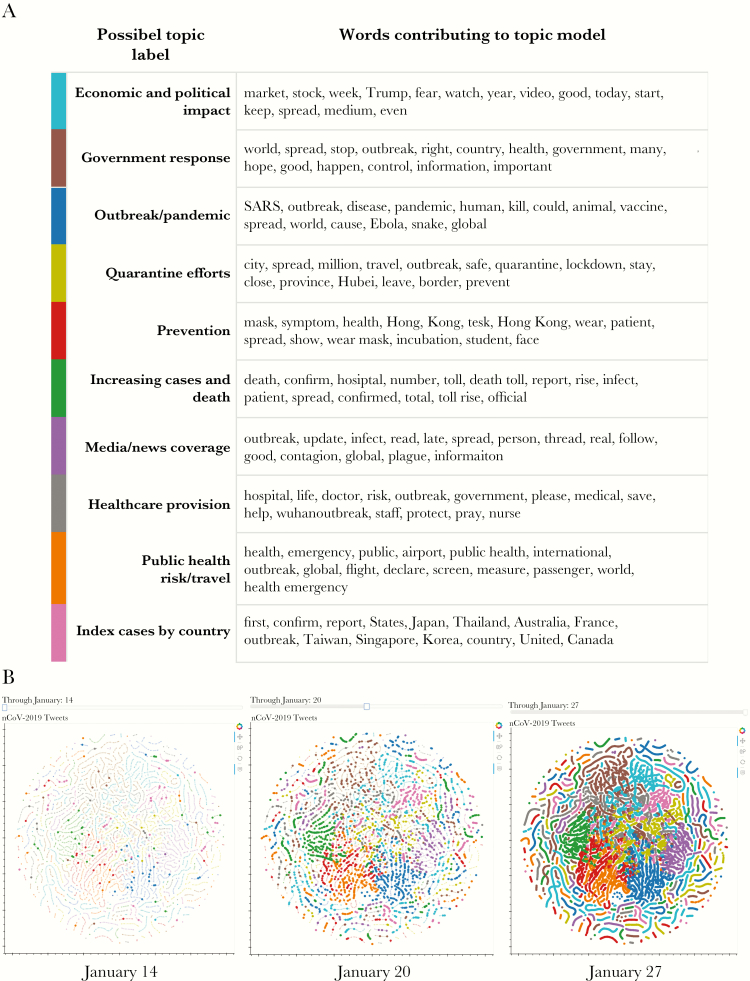
Methods: We extracted tweets matching hashtags related to COVID-19 from January 14 to 28, 2020 using Twitter's application programming interface. We measured themes and frequency of keywords related to infection prevention practices. We performed a sentiment analysis to identify the sentiment polarity and predominant emotions in tweets and conducted topic modeling to identify and explore discussion topics over time. We compared sentiment, emotion, and topics among the most popular tweets, defined by the number of retweets.
Results: We evaluated 126 049 tweets from 53 196 unique users. The hourly number of COVID-19-related tweets starkly increased from January 21, 2020 onward. Approximately half (49.5%) of all tweets expressed fear and approximately 30% expressed surprise. In the full cohort, the economic and political impact of COVID-19 was the most commonly discussed topic. When focusing on the most retweeted tweets, the incidence of fear decreased and topics focused on quarantine efforts, the outbreak and its transmission, as well as prevention.
Conclusions: Twitter is a rich medium that can be leveraged to understand public sentiment in real-time and potentially target individualized public health messages based on user interest and emotion.
Keywords: COVID-19; SARS-CoV-2; pandemic; sentiment analysis; topic modeling.
© The Author(s) 2020. Published by Oxford University Press on behalf of Infectious Diseases Society of America.
Figures
References
-
- Chorianopoulos K, Talvis K. Flutrack.org: open-source and linked data for epidemiology. Health Informatics J 2016; 22:962–74. - PubMed
-
- Househ M. Communicating Ebola through social media and electronic news media outlets: a cross-sectional study. Health Informatics J 2016; 22:470–8. - PubMed
LinkOut - more resources
Full Text Sources
Miscellaneous
