. 2021 Mar;229(5):2586-2600.
doi: 10.1111/nph.17046. Epub 2020 Dec 1.

Seasonal variation in the canopy color of temperate evergreen conifer forests

Affiliations

Seasonal variation in the canopy color of temperate evergreen conifer forests

Bijan Seyednasrollah et al. New Phytol. 2021 Mar.

Abstract

Evergreen conifer forests are the most prevalent land cover type in North America. Seasonal changes in the color of evergreen forest canopies have been documented with near-surface remote sensing, but the physiological mechanisms underlying these changes, and the implications for photosynthetic uptake, have not been fully elucidated. Here, we integrate on-the-ground phenological observations, leaf-level physiological measurements, near surface hyperspectral remote sensing and digital camera imagery, tower-based CO2 flux measurements, and a predictive model to simulate seasonal canopy color dynamics. We show that seasonal changes in canopy color occur independently of new leaf production, but track changes in chlorophyll fluorescence, the photochemical reflectance index, and leaf pigmentation. We demonstrate that at winter-dormant sites, seasonal changes in canopy color can be used to predict the onset of canopy-level photosynthesis in spring, and its cessation in autumn. Finally, we parameterize a simple temperature-based model to predict the seasonal cycle of canopy greenness, and we show that the model successfully simulates interannual variation in the timing of changes in canopy color. These results provide mechanistic insight into the factors driving seasonal changes in evergreen canopy color and provide opportunities to monitor and model seasonal variation in photosynthetic activity using color-based vegetation indices.

Keywords: AmeriFlux; PRI; PhenoCam; evergreen conifer; phenology; seasonality; xanthophyll.


Figures

Fig. 1
Fig. 1
Distribution of the study sites used in the present analysis. PhenoCam site‐year counts, used in the modeling analysis, are aggregated to 1° × 1° grids.
Fig. 2
Fig. 2
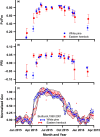
Seasonality of canopy color, as characterized by the green chromatic coordinate (G cc, upper panel) and green–red vegetation index (GRVI, lower panel), from PhenoCam imagery for Howland Forest. Filled blue symbols indicate 3‐d composite values from high‐frequency imagery; hollow symbols are data that have been screened because of snow on the evergreen canopy. Shaded blue bands indicate LOESS smoothing spline fit to the snow‐filtered data, ± 95% confidence interval. Vertical green bars indicate the period between conifer budburst and completion of leaf development, based on on‐the‐ground surveys conducted each spring since 1990.
Fig. 3
Fig. 3
Seasonal variation in leaf‐level physiological measurements for white pine and eastern hemlock at Harvard Forest. (a) Chlorophyll fluorescence F v /F m; (b) the photochemical reflectance index, PRI; (c) the green chromatic coordinate (G cc), normalized by observed seasonal maxima and minima to fall within the range 0–1. In (c), the horizontal bars indicate the mean dates of budburst (production of new foliage) for each species, over the period 1990–2001 (ground observations were discontinued before the start of the present study). The errors bars in (a) and (b) show the SD of the observations.
Fig. 4
Fig. 4
Seasonal patterns in phenocam‐derived canopy color indices (G cc and GRVI), and pigment contents and ratios, for three trees (two lodgepole pine: P1 and P2, and one Engelmann spruce: S1) in the field of view of the niwot5 phenocam. For additional pigment content (total carotenoids and total xanthophylls) data, see Supporting Information Fig. S3.
Fig. 5
Fig. 5
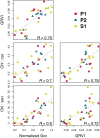
Correlation of canopy color indices and pigment ratio data for Niwot Ridge. Data are plotted using different symbols for each of the three trees (two lodgepole pine: P1 and P2, and one Engelmann spruce: S1) within the niwot5 phenocam field of view. Rather than presenting the full correlation matrix (see Supporting Information Fig. S3), here we show only the strongest correlations. To account for the different seasonal maxima and minima of green chromatic coordinate (G cc) across different trees, the values were normalized.
Fig. 6
Fig. 6
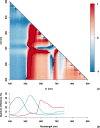
(a) Heatmap plot showing Pearson (r) correlation of normalized difference indices (Eqn 3), λ 1 and λ 2 wavelengths, with leaf‐level measurements of chl : car pigment ratio conducted over the course of the year. The white contour line indicates |r| = 0.95. (b) Quantum efficiency of PhenoCam digital cameras for each color channel. The hyperspectral reflectance data were obtained from a 2D scanning telescope, PhotoSpec.
Fig. 7
Fig. 7
Start‐of‐season (SOS) and end‐of‐season (EOS) derived from PhenoCam reflectance indices and from gross primary productivity (GPP) were highly correlated. Vertical axes show PhenoCam‐based transition dates. Horizontal axes show GPP‐based transition dates. Upper panels (a, b) are based on the 90th percentile of the green chromatic coordinate (G cc) time series. Lower panels (c, d) are based on the mean green–red vegetation index (GRVI) time series. Individual years for each site are shown separately. Uncertainties are shown as error bars. Warm sites, where photosynthesis occurs year‐round, are shown with hollow symbols.
Fig. 8
Fig. 8
Validations of the phenology model for (a, b) in‐sample and (c, d) out‐of‐sample data. The plots on the left (a, c) are modeled vs observed greenness values. The plots on the right (b, d) are modeled vs observed transition dates values. MAE stands for median absolute error. Green circles and orange triangles on the right‐hand‐side panels indicate spring and autumn transition dates, respectively. Horizontal features in (a) and (c) are due to the minimum and maximum greenness values in the model parameters.

References

    1. Baldocchi D. 2008. Turner review no. 15. ‘Breathing’ of the terrestrial biosphere: Lessons learned from a global network of carbon dioxide flux measurement systems. Australian Journal of Botany 56: 1–26.
    1. Balzarolo M, Vicca S, Nguy‐Robertson AL, Bonal D, Elbers JA, Fu YH, Grünwald T, Horemans JA, Papale D, Peñuelas J et al 2016. Matching the phenology of Net Ecosystem Exchange and vegetation indices estimated with MODIS and FLUXNET in‐situ observations. Remote Sensing of Environment 174: 290–300.
    1. Bolhàr‐Nordenkampf HR, Long SP, Baker NR, Oquist G, Schreiber U, Lechner EG. 1989. Chlorophyll fluorescence as a probe of the photosynthetic competence of leaves in the field: a review of current instrumentation. Functional Ecology 3: 497.
    1. Bonan GB. 2008. Forests and climate change: forcings, feedbacks, and the climate benefits of forests. Science 320: 1444–1449. - PubMed
    1. Bowling DR, Logan BA, Hufkens K, Aubrecht DM, Richardson AD, Burns SP, Anderegg WRL, Blanken PD, Eiriksson DP. 2018. Limitations to winter and spring photosynthesis of a Rocky Mountain subalpine forest. Agricultural and Forest Meteorology 252: 241–255.

Publication types