

Reproducibility analysis of multi-institutional paired expert annotations and radiomic features of the Ivy Glioblastoma Atlas Project (Ivy GAP) dataset
- PMID: 33118182
- PMCID: PMC8382093
- DOI: 10.1002/mp.14556
Reproducibility analysis of multi-institutional paired expert annotations and radiomic features of the Ivy Glioblastoma Atlas Project (Ivy GAP) dataset
Abstract
Purpose: The availability of radiographic magnetic resonance imaging (MRI) scans for the Ivy Glioblastoma Atlas Project (Ivy GAP) has opened up opportunities for development of radiomic markers for prognostic/predictive applications in glioblastoma (GBM). In this work, we address two critical challenges with regard to developing robust radiomic approaches: (a) the lack of availability of reliable segmentation labels for glioblastoma tumor sub-compartments (i.e., enhancing tumor, non-enhancing tumor core, peritumoral edematous/infiltrated tissue) and (b) identifying "reproducible" radiomic features that are robust to segmentation variability across readers/sites.
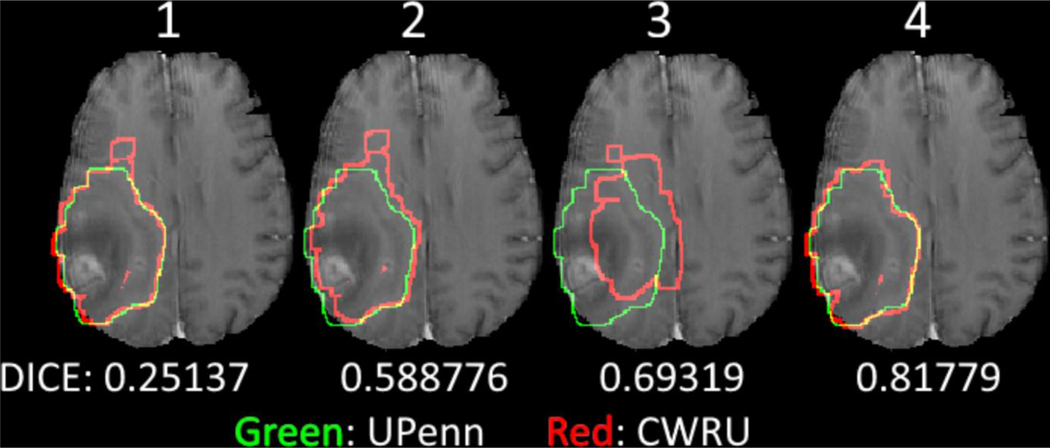
Acquisition and validation methods: From TCIA's Ivy GAP cohort, we obtained a paired set (n = 31) of expert annotations approved by two board-certified neuroradiologists at the Hospital of the University of Pennsylvania (UPenn) and at Case Western Reserve University (CWRU). For these studies, we performed a reproducibility study that assessed the variability in (a) segmentation labels and (b) radiomic features, between these paired annotations. The radiomic variability was assessed on a comprehensive panel of 11 700 radiomic features including intensity, volumetric, morphologic, histogram-based, and textural parameters, extracted for each of the paired sets of annotations. Our results demonstrated (a) a high level of inter-rater agreement (median value of DICE ≥0.8 for all sub-compartments), and (b) ≈24% of the extracted radiomic features being highly correlated (based on Spearman's rank correlation coefficient) to annotation variations. These robust features largely belonged to morphology (describing shape characteristics), intensity (capturing intensity profile statistics), and COLLAGE (capturing heterogeneity in gradient orientations) feature families.
Data format and usage notes: We make publicly available on TCIA's Analysis Results Directory (https://doi.org/10.7937/9j41-7d44), the complete set of (a) multi-institutional expert annotations for the tumor sub-compartments, (b) 11 700 radiomic features, and (c) the associated reproducibility meta-analysis.
Potential applications: The annotations and the associated meta-data for Ivy GAP are released with the purpose of enabling researchers toward developing image-based biomarkers for prognostic/predictive applications in GBM.
Keywords: IvyGAP; MRI; glioblastoma; radiomics; reproducibility; segmentation.
© 2020 American Association of Physicists in Medicine.
Figures


References
-
- Amadasun M, King R. Textural features corresponding to textural properties. IEEE Trans Syst. 1989;19:1264–1274.
-
- Jaffe CC. Imaging and genomics: Is there a synergy? Radiology. 2012;264:329–331. PMID: 22821693. - PubMed
-
- Xiao T, Hua W, Li C, Wang S. Glioma grading prediction by exploring radiomics and deep learning features. In Proceedings of the Third International Symposium on Image Computing and Digital Medicine. 2019:208–213.
Publication types
MeSH terms
Grants and funding
LinkOut - more resources
Full Text Sources
Miscellaneous
