. 2020 Dec;9(23):8989-9005.
doi: 10.1002/cam4.3545. Epub 2020 Oct 28.

Identification of key genes and pathways for melanoma in the TRIM family

Affiliations

Identification of key genes and pathways for melanoma in the TRIM family

YiJun Xia et al. Cancer Med. 2020 Dec.

Abstract

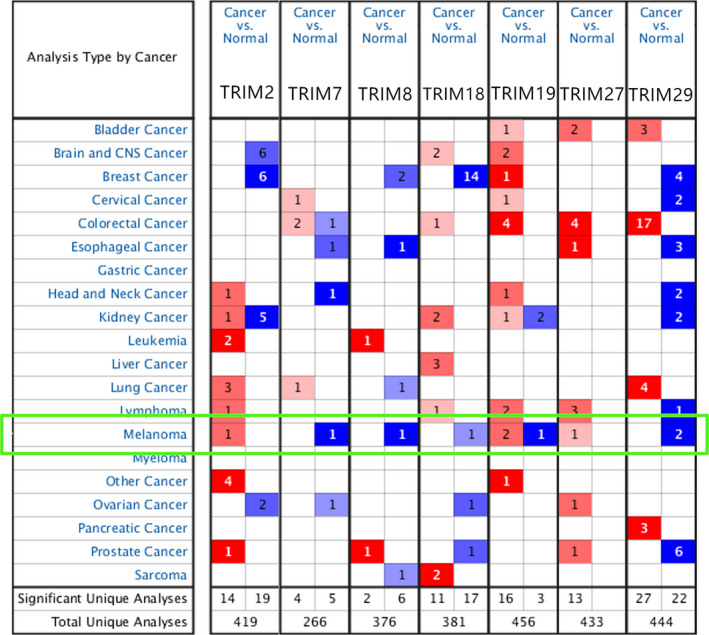
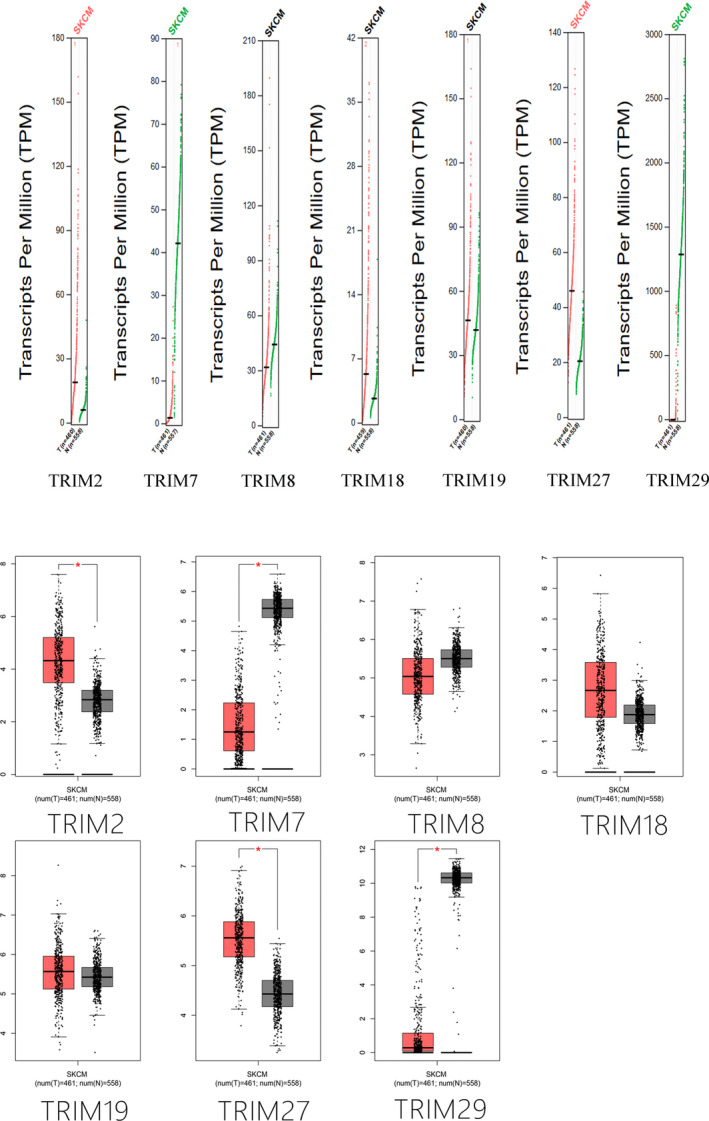
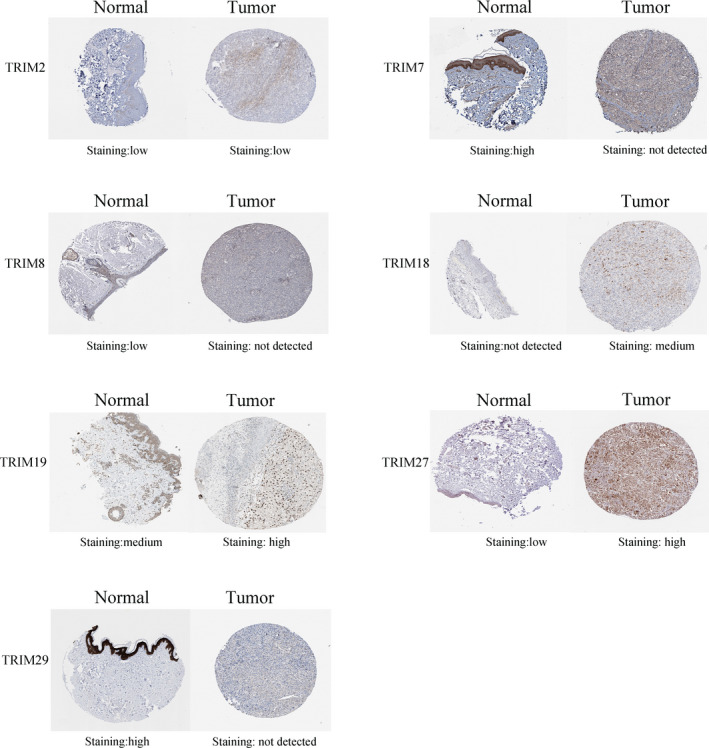
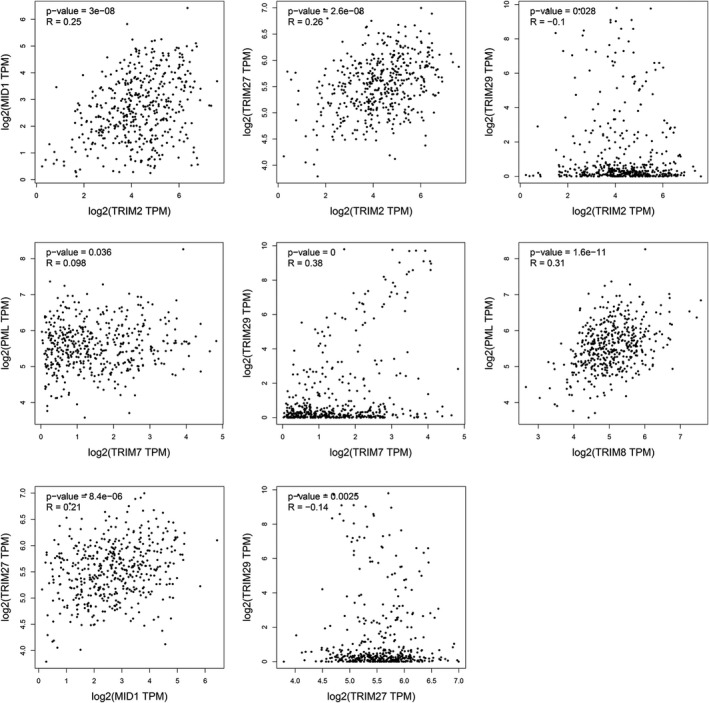
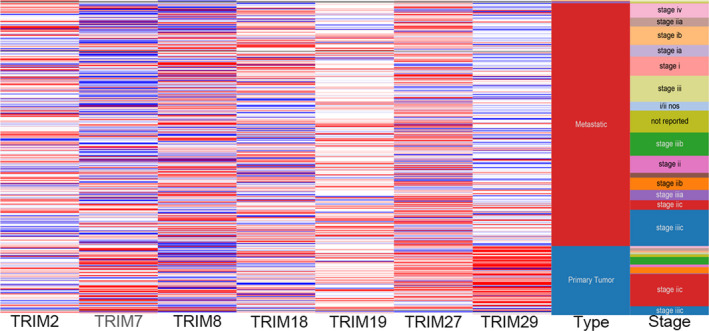
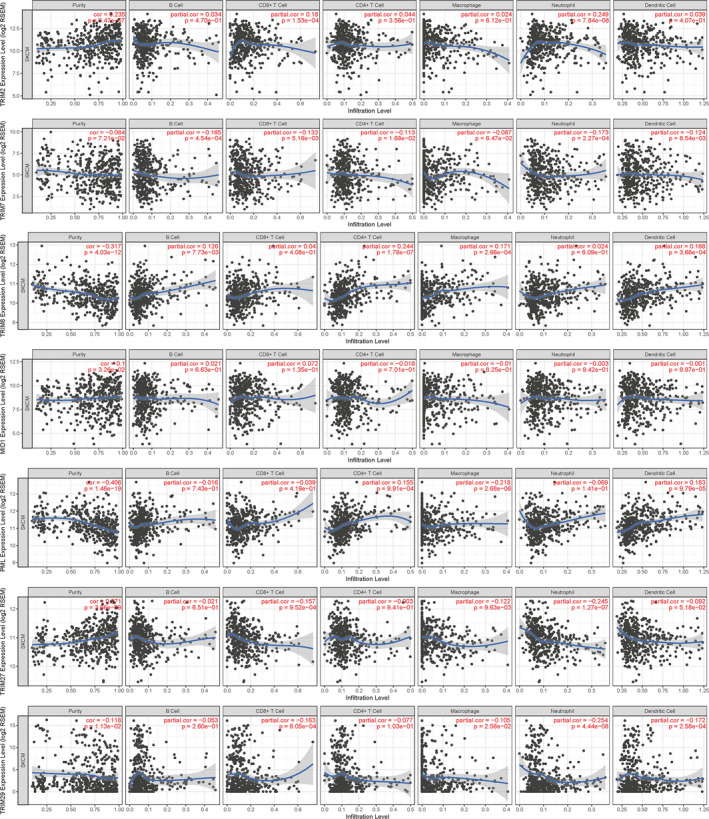
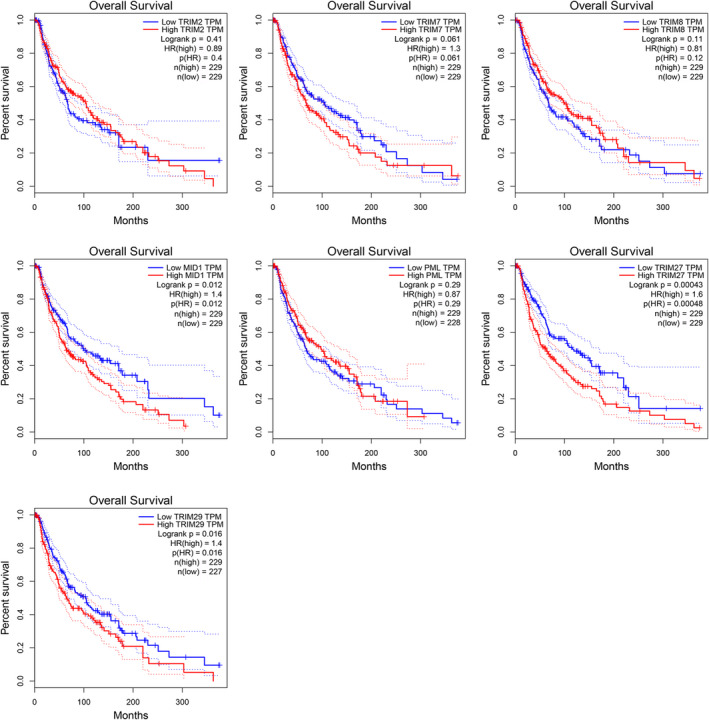
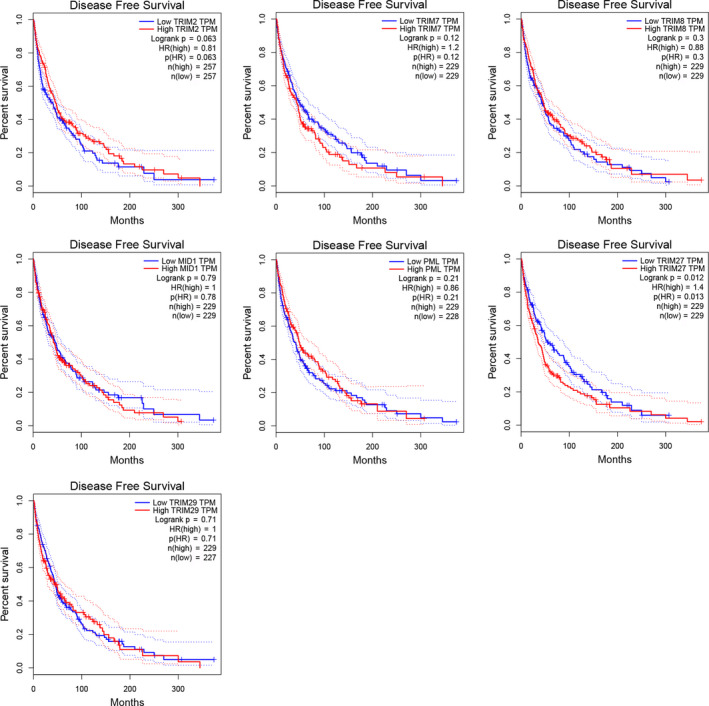
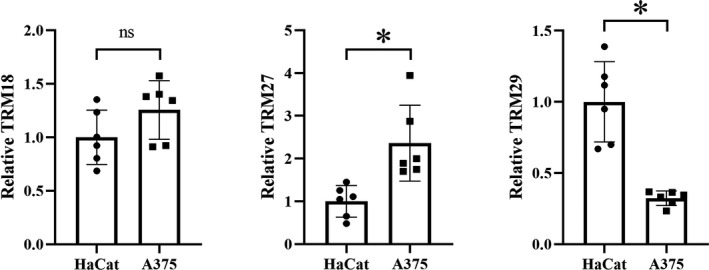
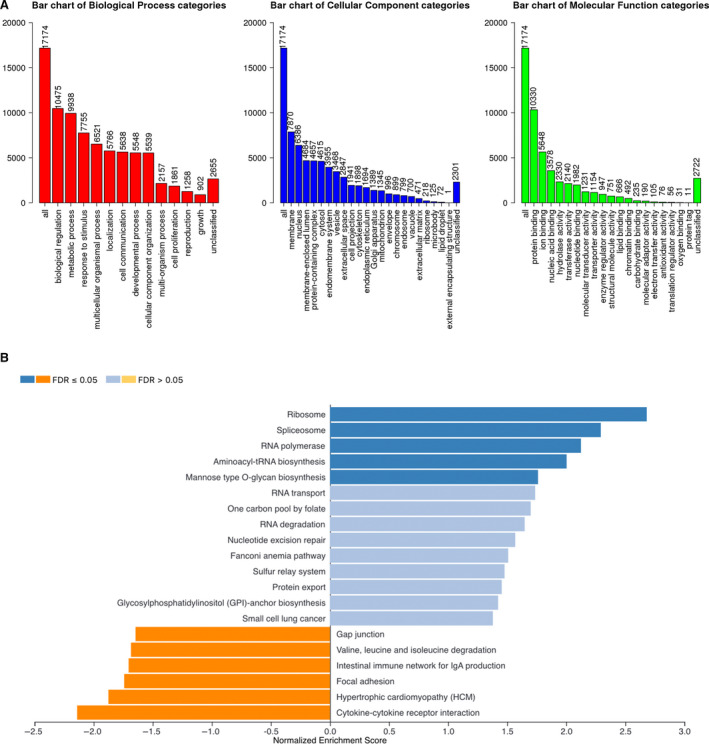
Certain members of the TRIM family have been shown to have abnormal expression and prognostic value in cancer. However, in the development and progression of melanoma, the role of different TRIM family members remains unknown. To address this issue, this study used the Oncomine, UCSC, Human Protein Atlas, DAVID, and GEPIA databases to study the role of TRIMs in the prognosis of melanoma. Differential expression of TRIM2, TRIM7, TRIM8, TRIM18 (MID1), TRIM19 (PML), TRIM27, and TRIM29 may play an important role in the development of melanoma. The expression TRIM7 and TRIM29 appeared to be helpful in the identification of primary tumors and metastases. Survival analysis suggested that the expression of TRIM27 significantly affected the overall survival and disease-free survival of melanoma, and its expression was confirmed by qRT-PCR. Our results indicated that the expression level of TRIM27 might be a prognostic marker of melanoma.

Keywords: GEPIA; Oncomine; TRIM; melanoma; prognosis.


Conflict of interest statement

The authors declare that they have no competing interests.

Figures

FIGURE 1
FIGURE 1
(A), Workflow of the present study. (B) By using the DAVID (Annotation, Visualization and Integration Discovery Database) tool, Gene Ontology (GO) analysis was performed on TRIMs. (C) The functions of TRIMs were predicted by analysis of Kyoto Encyclopedia of Genes and Genomes (KEGG) by DAVID (Database for Annotation, Visualization, and Integrated Discovery) tools
FIGURE 2
FIGURE 2
Transcriptional expression of TRIMs in 20 different types of cancer (Oncomine database). Differences in transcriptional expression were compared by Student's t‐test. The cut‐off values were as follows: p value: 1E‐4, fold change: 2, gene rank: 10%. Red represents high expression in tumor tissue and blue represents low expression
FIGURE 3
FIGURE 3
mRNA expression of different TRIM family members in melanoma tissue and adjacent normal tissues. Among them, TRIM2/27 was significantly overexpressed in melanoma, and TRIM7/29 was downregulated in tumor tissues
FIGURE 4
FIGURE 4
Representative immunohistochemical images of different TRIM family members in melanoma tissue and normal tissues. TRIM7 and TRIM29 were highly stained in normal tissues, but could not be detected in melanoma. TRIM27 was highly stained in melanoma and was up‐regulated at the protein level
FIGURE 5
FIGURE 5
A statistically significant correlation between TRIM2, TRIM7, TRIM8, TRIM18, TRIM19, TRIM27, and TRIM29
FIGURE 6
FIGURE 6
Hierarchical clustering of key genes was constructed using UCSC. Upregulation of genes is marked in red; downregulation of genes is marked in blue. TRIM7 and TRIM29 appeared to be mostly blue in metastatic melanoma, representing low expression, and mostly red in primary melanoma, representing high expression
FIGURE 7
FIGURE 7
The correlation analysis between each type of tumor immune infiltrating cells (B‐cells, CD4+ T‐cells, CD8+ T‐cells, neutrophils, macrophages and dendritic cells) and TRIM family. There is no prominent relationship between TRIM family members and tumor immune infiltrating cells
FIGURE 8
FIGURE 8
The overall survival analysis curve of low and high‐risk groups of the TRIMs signature. Among them, only the expression of TRIM18/27/29 had a significant effect on the overall survival of patients
FIGURE 9
FIGURE 9
The disease‐free survival analysis curve of low and high‐risk groups of the TRIMs signature. Of the seven possible key genes, only TRIM27 was significantly associated with disease‐free survival in melanoma patients
FIGURE 10
FIGURE 10
Expression of TRIMs that have a significant impact on survival (TRIM18/27/29) in melanoma cell line A375 compared to the normal cell line. “*” means statistically significant
FIGURE 11
FIGURE 11
Gene Ontology (GO) analysis and Kyoto Encyclopedia of Genes and Genomes (KEGG) analysis of the TRIM27 gene in melanoma. (A) GO analysis. (B) KEGG analysis

References

    1. Owens B. Melanoma. Nature. 2014;515:S109. - PubMed
    1. Paulson KG, Gupta D, Kim TS, et al. Age‐specific incidence of melanoma in the United States. JAMA Dermatol. 2020;156:57‐64. - PMC - PubMed
    1. Schadendorf D, van Akkooi ACJ, Berking C, et al. Melanoma. Lancet. 2018;392:971‐984. - PubMed
    1. Schadendorf D, Fisher DE, Garbe C, et al. Melanoma. Nat Rev Dis Primers. 2015;1:15003. - PubMed
    1. Jiang MX, Hong X, Liao BB, et al. Expression profiling of TRIM protein family in THP1‐derived macrophages following TLR stimulation. Sci Rep. 2017;7:42781. - PMC - PubMed

MeSH terms