. 2021 Jan 12;143(2):120-134.
doi: 10.1161/CIRCULATIONAHA.120.050498. Epub 2020 Oct 29.

Myocardial Gene Expression Signatures in Human Heart Failure With Preserved Ejection Fraction

Affiliations

Myocardial Gene Expression Signatures in Human Heart Failure With Preserved Ejection Fraction

Virginia S Hahn et al. Circulation. .

Erratum in

Abstract

Background: Heart failure (HF) with preserved ejection fraction (HFpEF) constitutes half of all HF but lacks effective therapy. Understanding of its myocardial biology remains limited because of a paucity of heart tissue molecular analysis.

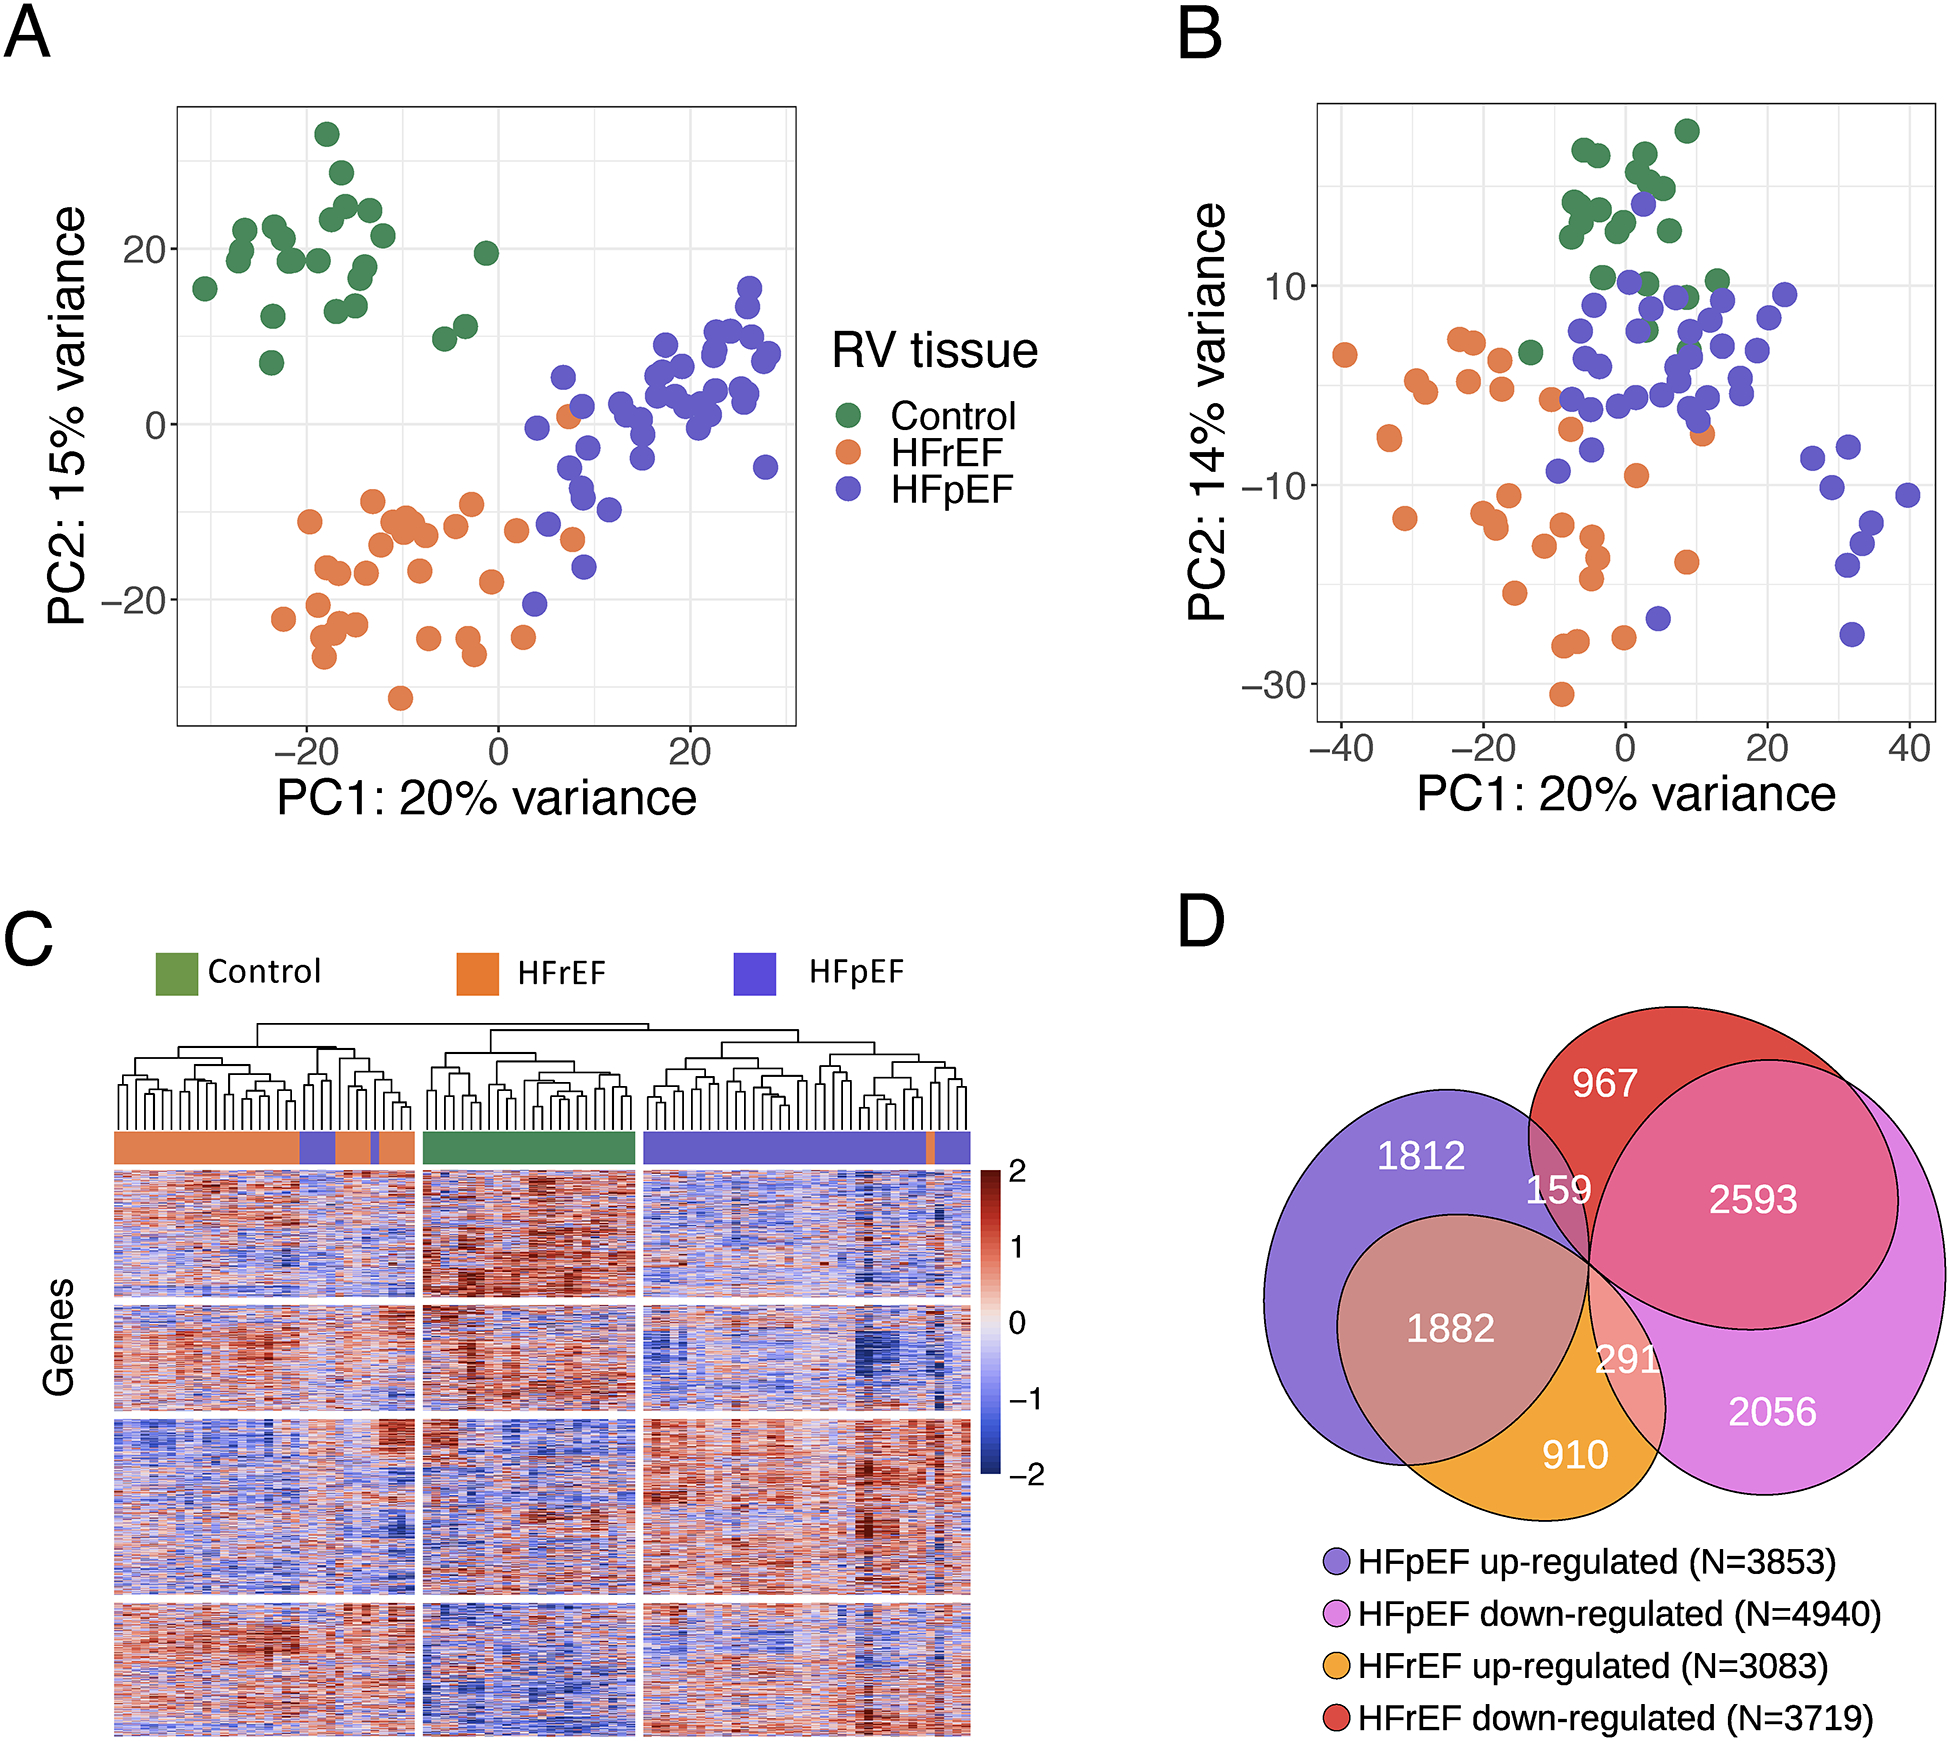
Methods: We performed RNA sequencing on right ventricular septal endomyocardial biopsies prospectively obtained from patients meeting consensus criteria for HFpEF (n=41) contrasted with right ventricular septal tissue from patients with HF with reduced ejection fraction (HFrEF, n=30) and donor controls (n=24). Principal component analysis and hierarchical clustering tested for transcriptomic distinctiveness between groups, effect of comorbidities, and differential gene expression with pathway enrichment contrasted HF groups and donor controls. Within HFpEF, non-negative matrix factorization and weighted gene coexpression analysis identified molecular subgroups, and the resulting clusters were correlated with hemodynamic and clinical data.

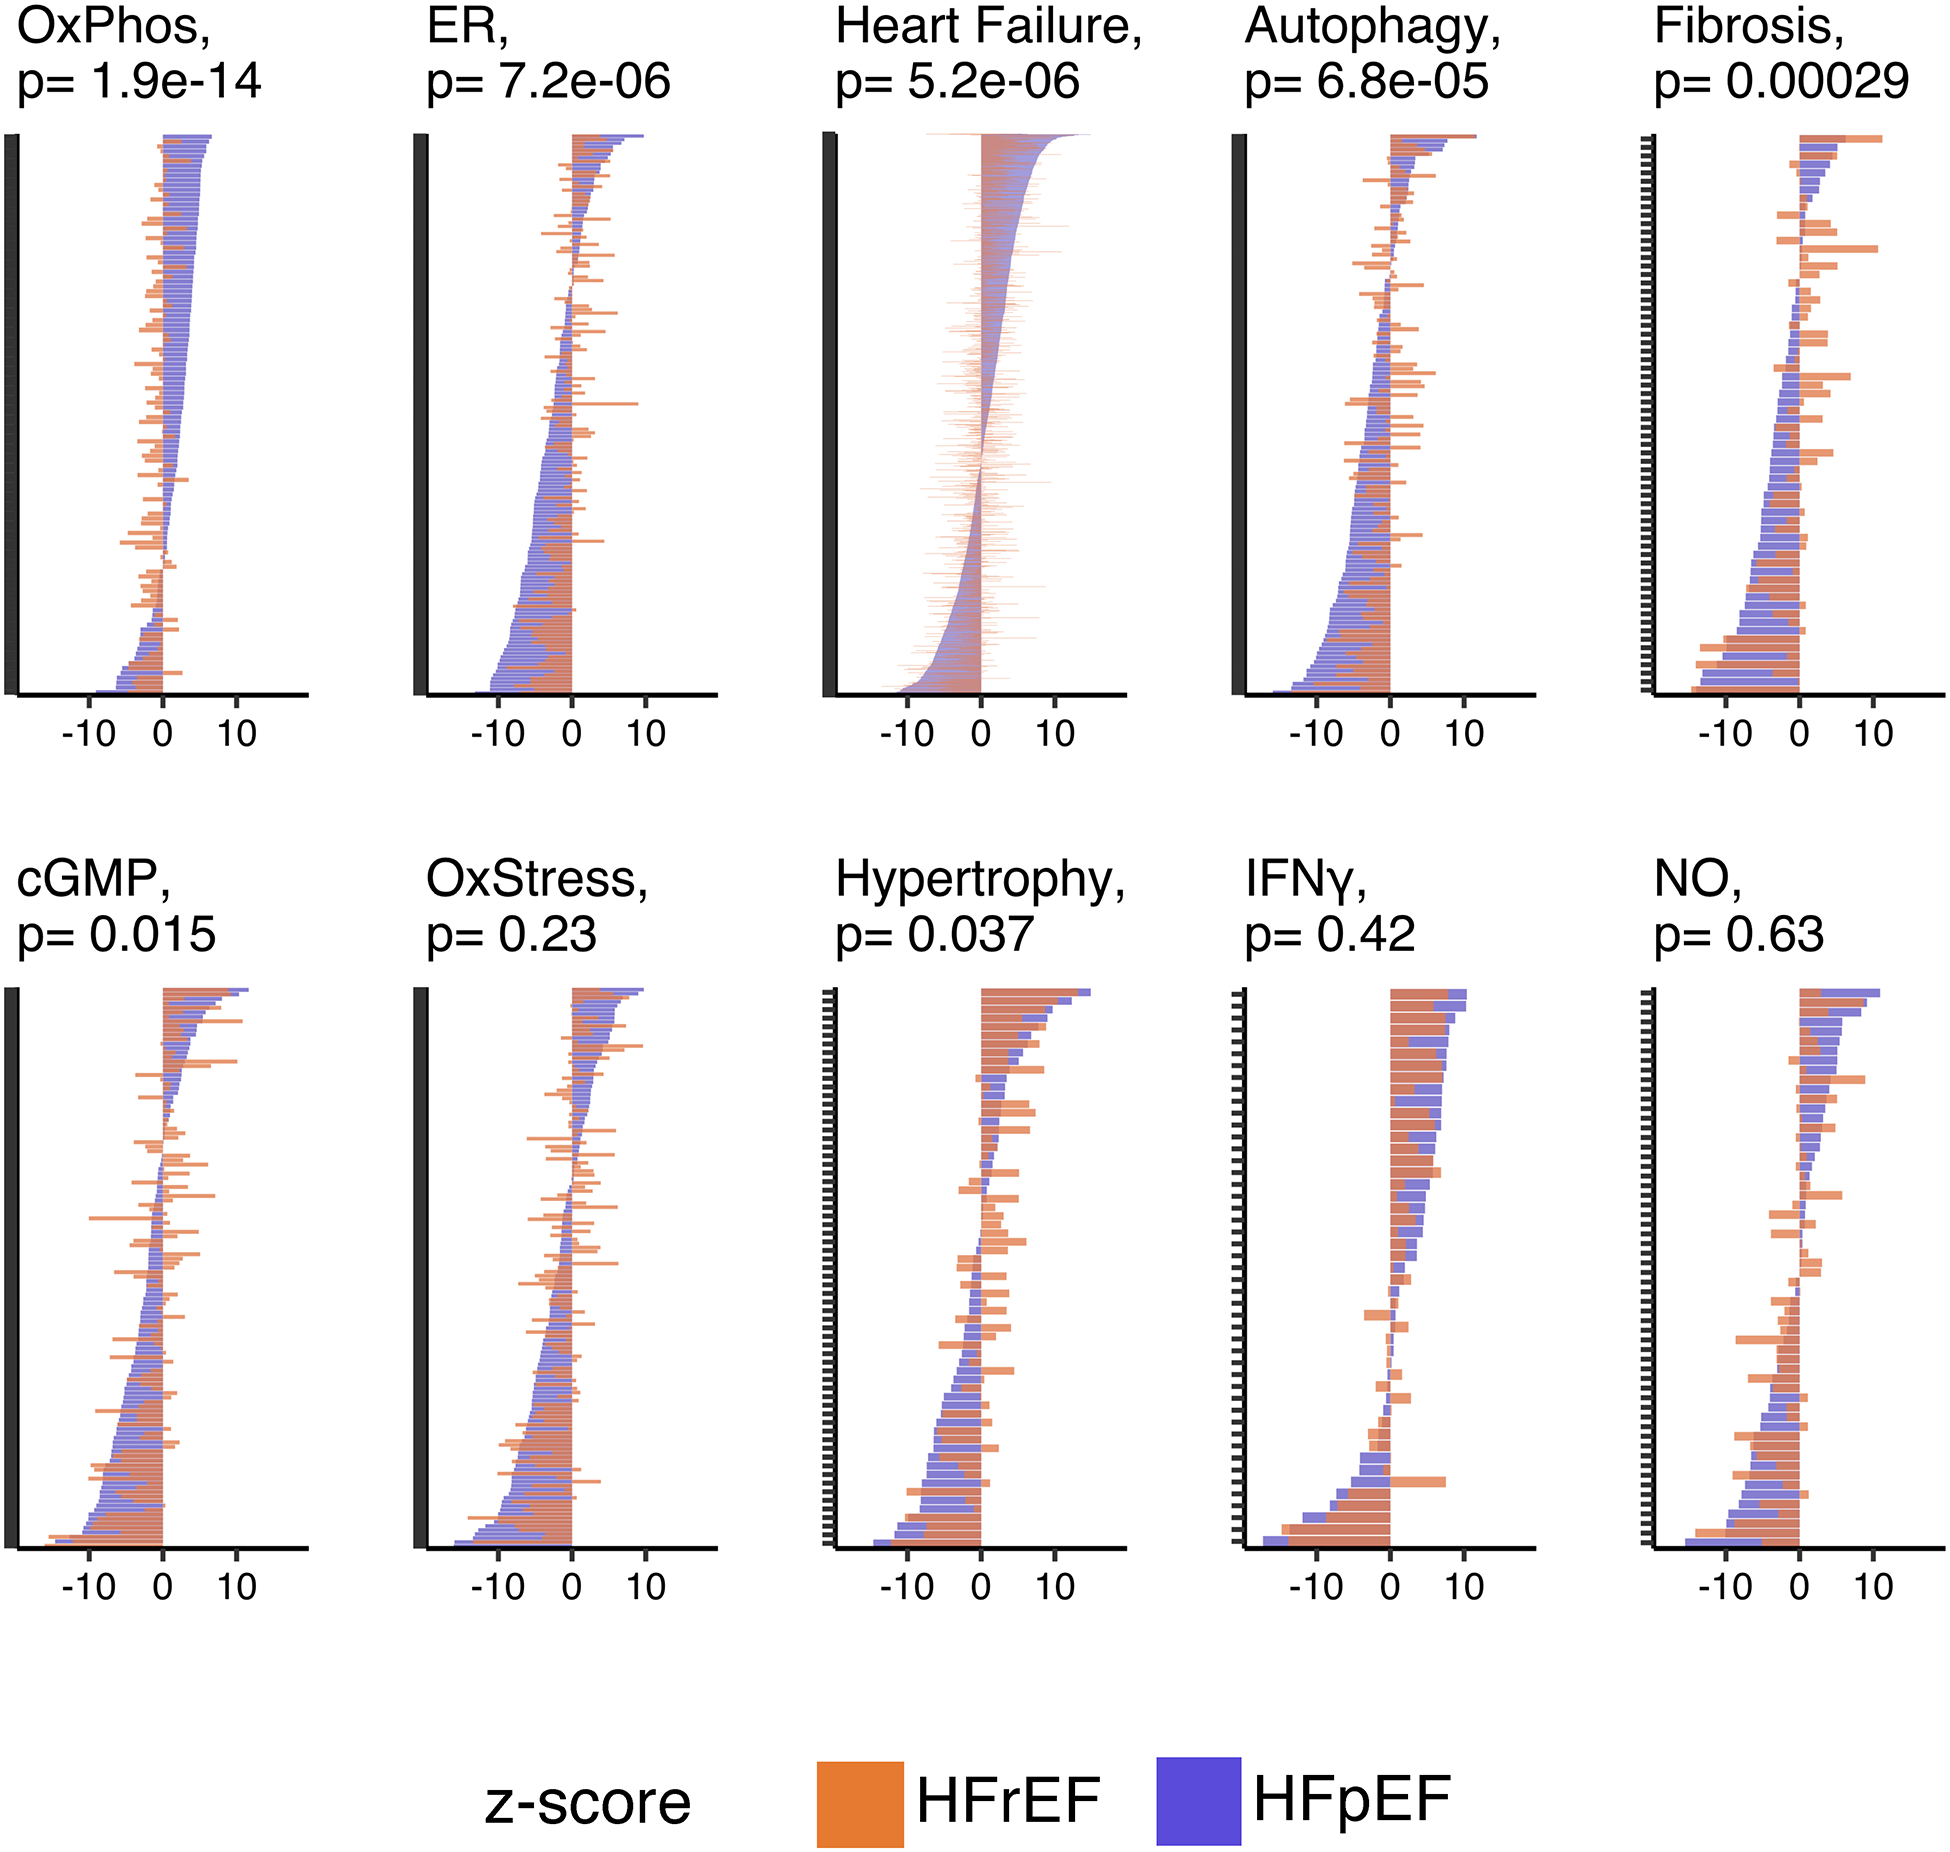
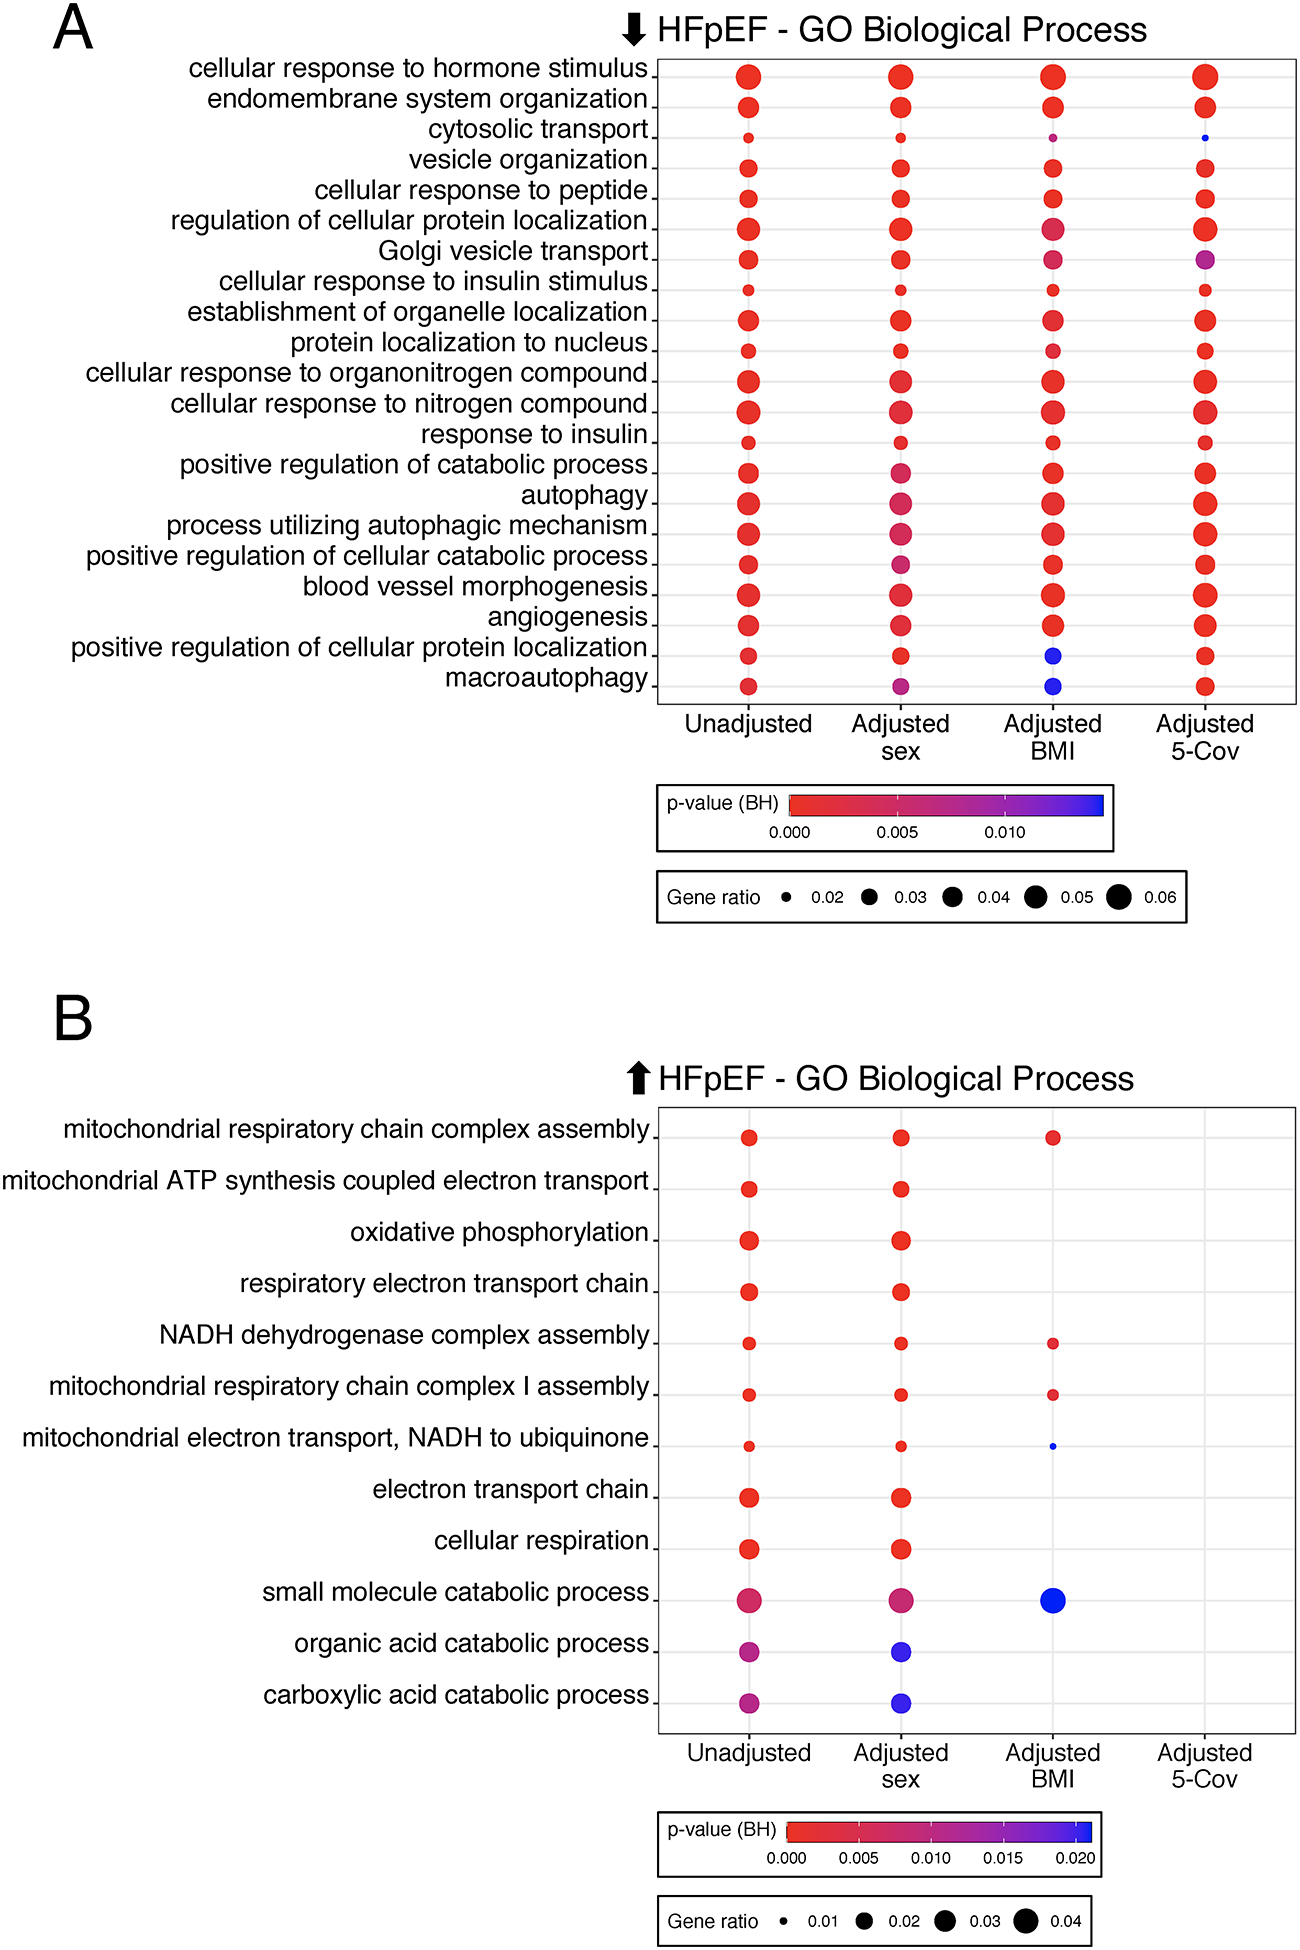
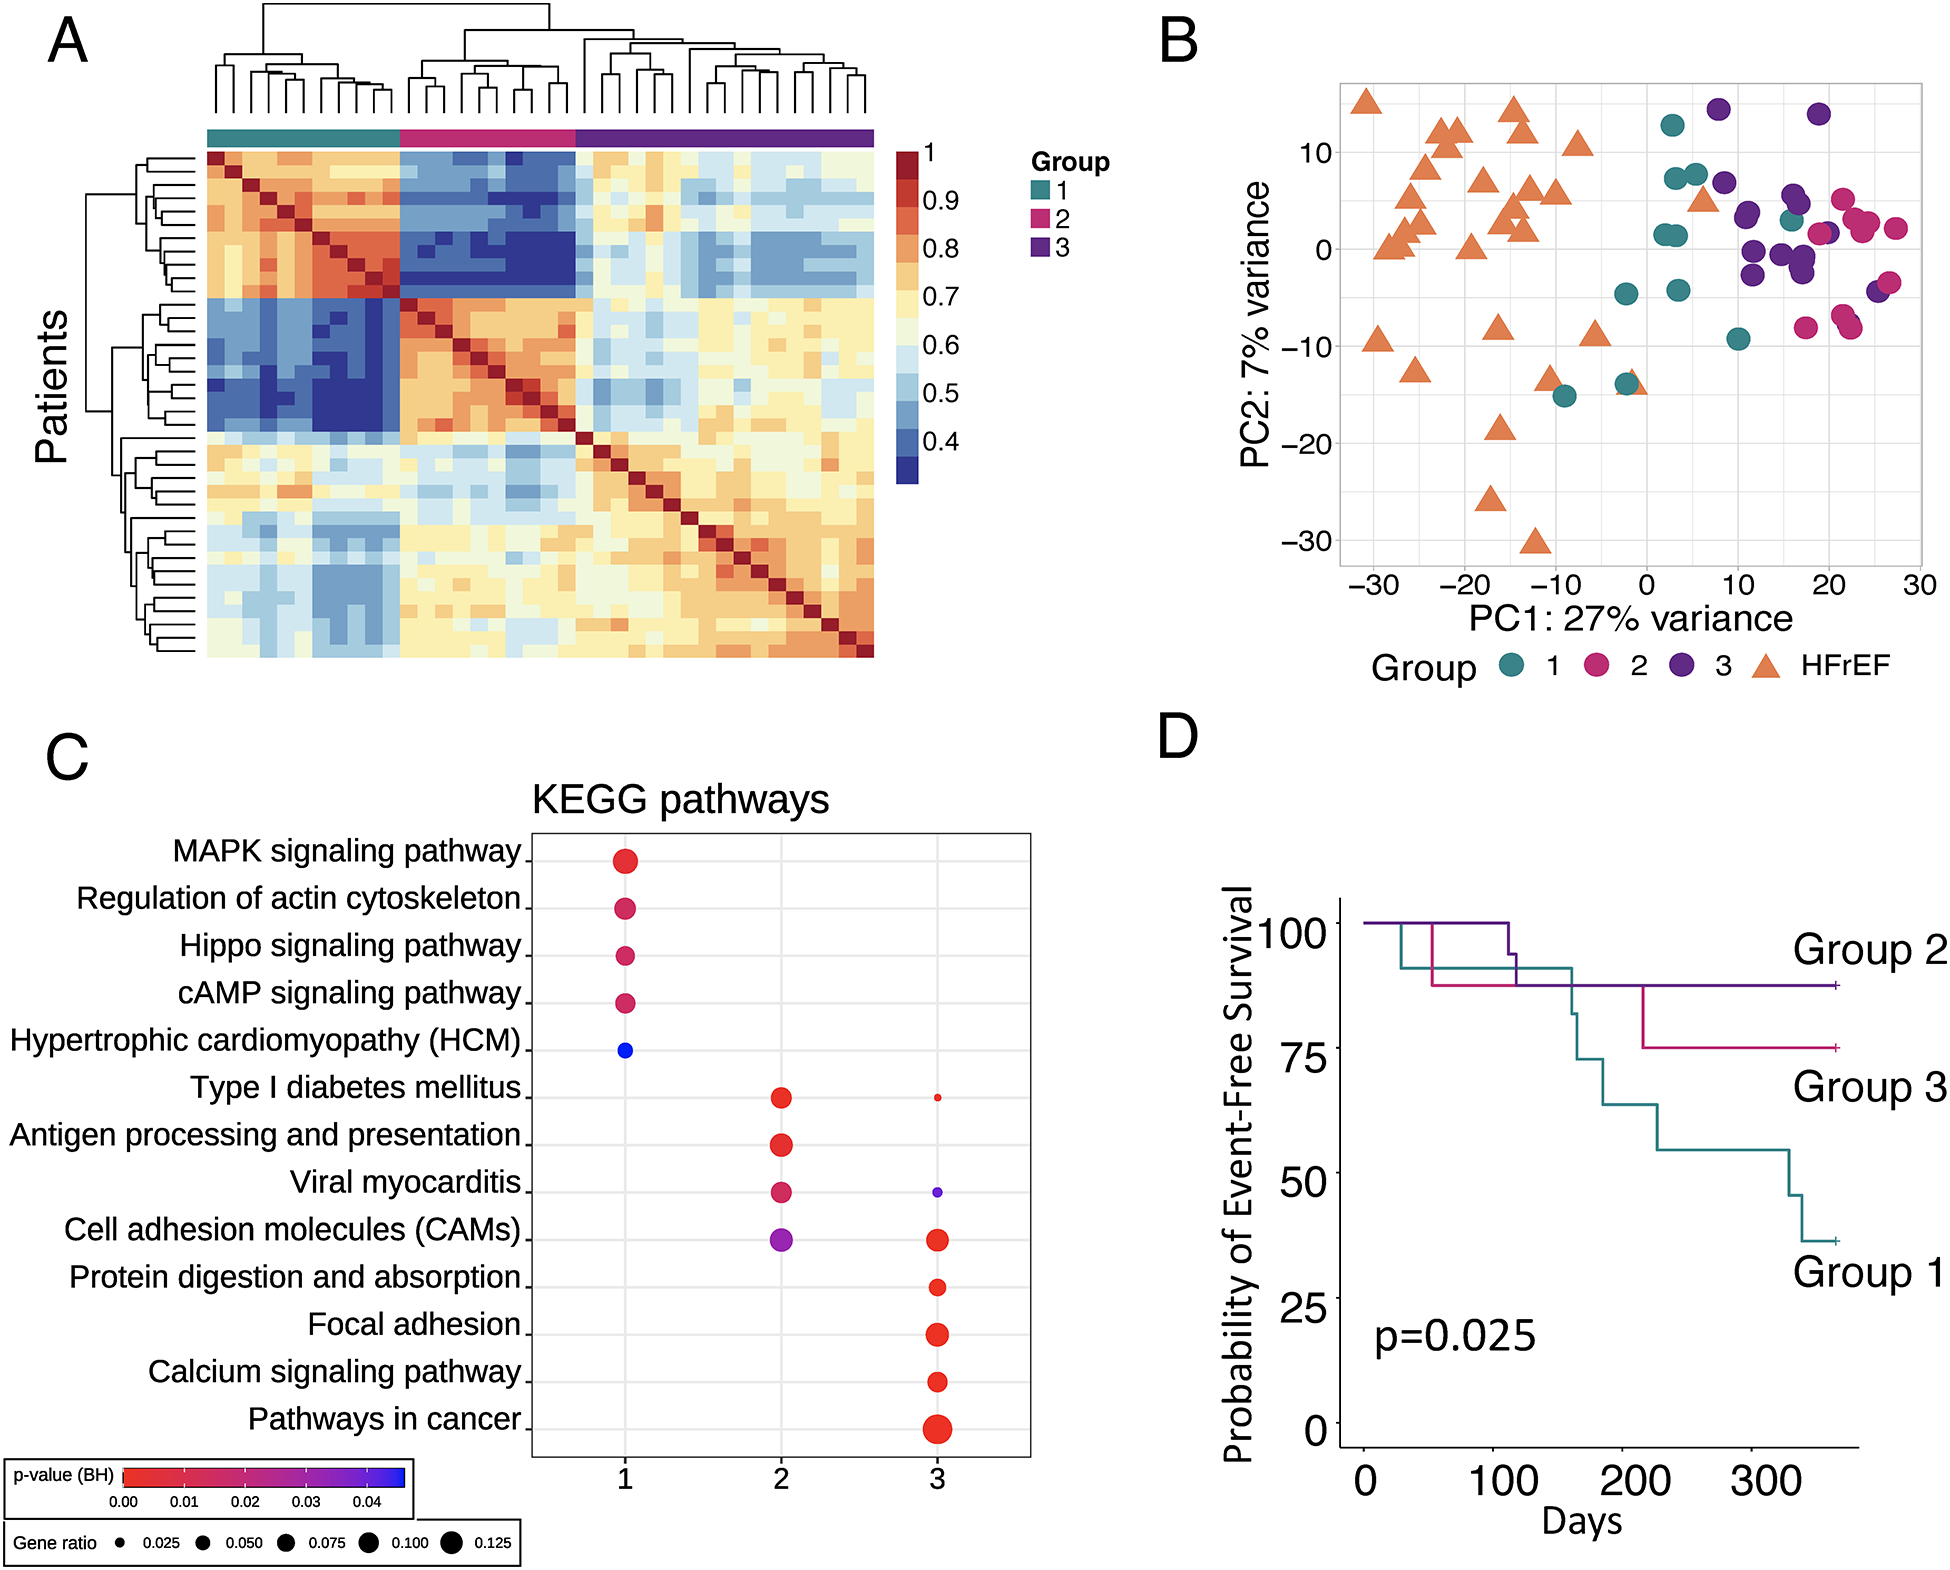
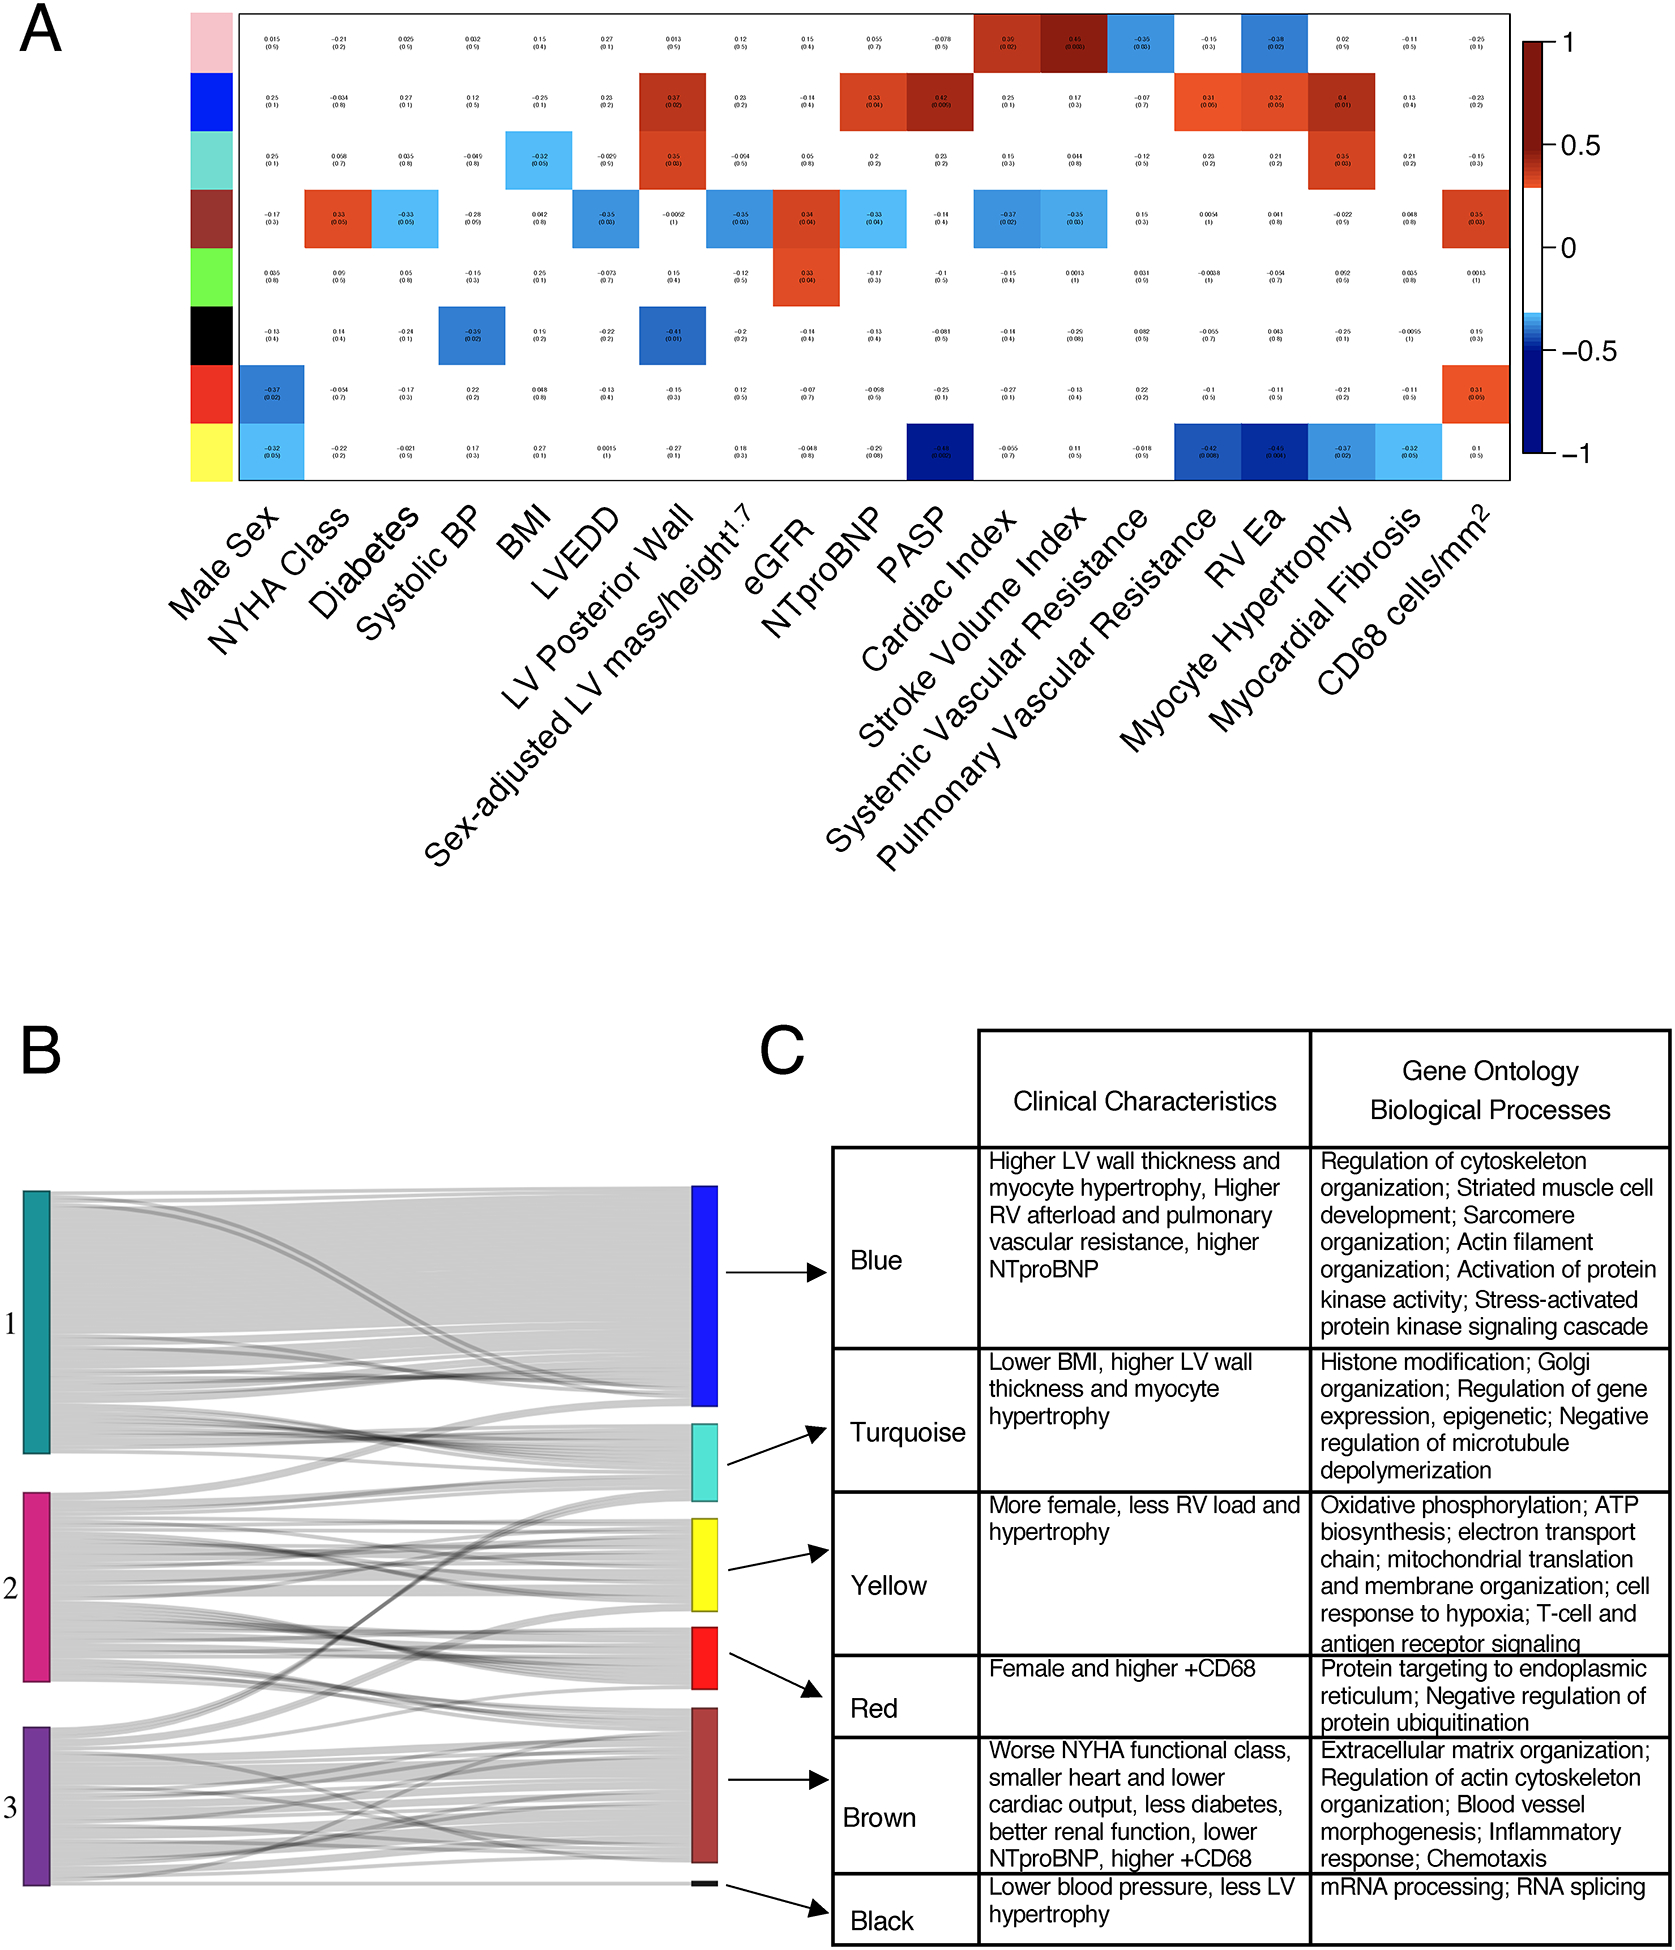
Results: Patients with HFpEF were more often women (59%), African American (68%), obese (median body mass index 41), and hypertensive (98%), with clinical HF characterized by 65% New York Heart Association Class III or IV, nearly all on a loop diuretic, and 70% with a HF hospitalization in the previous year. Principal component analysis separated HFpEF from HFrEF and donor controls with minimal overlap, and this persisted after adjusting for primary comorbidities: body mass index, sex, age, diabetes, and renal function. Hierarchical clustering confirmed group separation. Nearly half the significantly altered genes in HFpEF versus donor controls (1882 up, 2593 down) changed in the same direction in HFrEF; however, 5745 genes were uniquely altered between HF groups. Compared with controls, uniquely upregulated genes in HFpEF were enriched in mitochondrial adenosine triphosphate synthesis/electron transport, pathways downregulated in HFrEF. HFpEF-specific downregulated genes engaged endoplasmic reticulum stress, autophagy, and angiogenesis. Body mass index differences largely accounted for HFpEF upregulated genes, whereas neither this nor broader comorbidity adjustment altered pathways enriched in downregulated genes. Non-negative matrix factorization identified 3 HFpEF transcriptomic subgroups with distinctive pathways and clinical correlates, including a group closest to HFrEF with higher mortality, and a mostly female group with smaller hearts and proinflammatory signaling. These groupings remained after sex adjustment. Weighted gene coexpression analysis yielded analogous gene clusters and clinical groupings.

Conclusions: HFpEF exhibits distinctive broad transcriptomic signatures and molecular subgroupings with particular clinical features and outcomes. The data reveal new signaling targets to consider for precision therapeutics.

Keywords: computational biology; heart failure; humans; sequence analysis, RNA.


Figures

Figure 1.
Figure 1.. Transcriptomic differences between HFpEF and HFrEF.
RNAseq was performed on CON (n=24), HFrEF (n=30), and HFpEF (n=41). A) Principal component (PC) analysis using all identified genes for CON (green), HFrEF (orange), and HFpEF (purple) reveals within group clusters with minimal overlap. B) Principal component analysis after adjustment for age, sex, diabetes, body mass index [BMI], and estimated glomerular filtration rate. C) Hierarchical clustering analysis using all identified genes, using Pearson correlation, shown as a heatmap of variance stabilizing transforms of the reads that also largely separates the groups. Only 5 HFpEF patients grouped into HFrEF; 1 HFrEF patient grouped into HFpEF. D) Venn diagram of differentially expressed genes (5% FDR threshold) for the three groups, their directions versus CON, and relative portion unique or shared by each HF group.
Figure 2.
Figure 2.. Gene expression differences between HFpEF and HFrEF within targeted pathways of interest.
Gene-expression changes in HFpEF vs CON (purple) and HFrEF vs CON (orange) in 10 targeted pathways. Each plot is displayed as Z-scores for individual genes. Vertical placement is based highest-lowest HFpEF vs CON scores. Wilcoxon rank-sum P value displayed for differences in Z-scores between HF groups. OxPhos, oxidative phosphorylation; ER, protein processing in the endoplasmic reticulum; cGMP, cyclic guanosine monophosphate; OxStress, oxidative stress; IFNγ, Interferon gamma; NO, nitric oxide.
Figure 3.
Figure 3.. Impact of co-morbidities and functional analysis of differentially expressed HFpEF genes.
A) Enrichment of Gene Ontology (GO)-Biological Processes based on genes downregulated in HFpEF vs CON using unadjusted differential gene expression analysis, adjustment for sex or body mass index [BMI] alone, or adjustment for five clinical covariates (age, sex, diabetes, BMI, estimated glomerular filtration rate). Circle size reflects gene ratio - proportion of differentially expressed genes in a pathway versus all differentially expressed genes; color coding reflects Fisher’s exact P value after Benjamini-Hochberg (BH) adjustment for multiple comparisons. B) Same analysis using genes upregulated in HFpEF. Circle size and color coding as described in Fig. 2A.
Figure 4.
Figure 4.. Identification of HFpEF subgroups by agnostic clustering of gene expression.
A) Non-negative matrix factorization (NMF) identifies 3 HFpEF patient clusters (n=38). Two groups show high intra-group similarity, while the third is heterogeneous. B) Principal component (PC) analysis using HFpEF groups and HFrEF as comparator. C) Enrichment of Kyoto Encyclopedia of Genes and Genomes (KEGG) pathways in the subset of differentially expressed genes within HFpEF subgroups. Symbol size and color are as defined in Fig. 2A. D) Kaplan-Meier analysis of 12-month probability of event-free survival, with event being a composite of death or heart failure hospitalization. Log-rank p-value displayed.
Figure 5.
Figure 5.. Weighted gene correlation network analysis (WGCNA) in HFpEF.
A) WGCNA identified 8 gene clusters, represented as colors on the y-axis. Their correlation with clinical parameters is shown as red boxes indicating positive and blue boxes negative correlations. B) The top 300 metagenes inherent to NMF Group 1 HFpEF overlap significantly with the “blue” cluster from the WGCNA. Each line represents a gene in an NMF group that best defined that group and its match among the gene clusters identified by WGCNA. Genes from HFpEF Group 1 overlap most with the blue cluster, while genes from Group 2 mostly overlap with the yellow and red clusters, and Group 3 mostly overlaps with the brown cluster. C) Table identifies the clinical characteristics and gene ontology biological processes related to each group. Abbreviations: BP – blood pressure; BMI – body mass index, LVEDD, left ventricular end diastolic diameter; eGFR, estimated glomerular filtration rate; PASP, pulmonary artery systolic pressure; RV, RV Ea, Right ventricle arterial elastance.

References

    1. Benjamin EJ, Virani SS, Callaway CW, Chamberlain AM, Chang AR, Cheng S, Chiuve SE, Cushman M, Delling FN, Deo R, et al. Heart Disease and Stroke Statistics-2018 Update: A Report From the American Heart Association. Circulation. 2018;137:e67–e492. doi: 10.1161/CIR.0000000000000558 - DOI - PubMed
    1. Owan TE, Hodge DO, Herges RM, Jacobsen SJ, Roger VL and Redfield MM. Trends in prevalence and outcome of heart failure with preserved ejection fraction. N Engl J Med. 2006;355:251–259. doi: 10.1056/NEJMoa052256 - DOI - PubMed
    1. Sharma K, Hill T, Grams M, Daya NR, Hays AG, Fine D, Thiemann DR, Weiss RG, Tedford RJ, Kass DA, et al. Outcomes and Worsening Renal Function in Patients Hospitalized With Heart Failure With Preserved Ejection Fraction. Am J Cardiol. 2015;116:1534–1540. doi: 10.1016/j.amjcard.2015.08.019 - DOI - PubMed
    1. Topol EJ, Traill TA and Fortuin NJ. Hypertensive hypertrophic cardiomyopathy of the elderly. N Engl J Med. 1985;312:277–283. doi: 10.1056/NEJM198501313120504 - DOI - PubMed
    1. Borbely A, van der Velden J, Papp Z, Bronzwaer JG, Edes I, Stienen GJ and Paulus WJ. Cardiomyocyte stiffness in diastolic heart failure. Circulation. 2005;111:774–781. doi: 10.1161/01.CIR.0000155257.33485.6D - DOI - PubMed

Publication types