. 2021 Jun 16;117(7):1760-1775.
doi: 10.1093/cvr/cvaa307.

Transcriptome and proteome mapping in the sheep atria reveal molecular featurets of atrial fibrillation progression

Affiliations

Transcriptome and proteome mapping in the sheep atria reveal molecular featurets of atrial fibrillation progression

Alba Alvarez-Franco et al. Cardiovasc Res. .

Erratum in

Abstract

Aims: Atrial fibrillation (AF) is a progressive cardiac arrhythmia that increases the risk of hospitalization and adverse cardiovascular events. There is a clear demand for more inclusive and large-scale approaches to understand the molecular drivers responsible for AF, as well as the fundamental mechanisms governing the transition from paroxysmal to persistent and permanent forms. In this study, we aimed to create a molecular map of AF and find the distinct molecular programmes underlying cell type-specific atrial remodelling and AF progression.

Methods and results: We used a sheep model of long-standing, tachypacing-induced AF, sampled right and left atrial tissue, and isolated cardiomyocytes (CMs) from control, intermediate (transition), and late time points during AF progression, and performed transcriptomic and proteome profiling. We have merged all these layers of information into a meaningful three-component space in which we explored the genes and proteins detected and their common patterns of expression. Our data-driven analysis points at extracellular matrix remodelling, inflammation, ion channel, myofibril structure, mitochondrial complexes, chromatin remodelling, and genes related to neural function, as well as critical regulators of cell proliferation as hallmarks of AF progression. Most important, we prove that these changes occur at early transitional stages of the disease, but not at later stages, and that the left atrium undergoes significantly more profound changes than the right atrium in its expression programme. The pattern of dynamic changes in gene and protein expression replicate the electrical and structural remodelling demonstrated previously in the sheep and in humans, and uncover novel mechanisms potentially relevant for disease treatment.

Conclusions: Transcriptomic and proteomic analysis of AF progression in a large animal model shows that significant changes occur at early stages, and that among others involve previously undescribed increase in mitochondria, changes to the chromatin of atrial CMs, and genes related to neural function and cell proliferation.

Keywords: Atrial fibrillation; Chromatin; Mitochondria; Proteomics; RNA-seq.


Figures

Figure 1
Figure 1
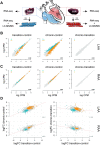
Transcriptomic profiling of a sheep model of AF progression. (A) Schematic diagram of the experimental strategy, the collected samples from the left (LA) and right (RA) atrial appendages and the analyses that were carried out. Three samples were collected in each case and for each analysis. (B and C) Correlation of mean expression values as log of counts per million (CPM) in atrial tissue RNA-seq between transition and control (left panel), chronic and control (middle panel), and chronic and transition (right panel) from left (B, LAA) and right (C, RAA) atrial appendages. Orange and blue indicate, respectively, up- and down-regulated genes for each comparison. The Pearson coefficient of correlation is indicated on the lower right corner of each plot. (D) Progression of changes in gene expression in atrial tissue along persistent AF. The linear regression adjustment of control-to-transition logFC (fold-change) to those of control-to-chronic (left panels) and transition-to-chronic (right panels), in left (upper panels) and right (lower panels) atrial tissue is shown. Orange and blue indicate up- and down-regulated genes. The R2 value is indicated on the lower right corner of each plot.
Figure 2
Figure 2
Co-inertia analysis of multidimensional data identifies the main components that drive variability in the sheep AF model. (A) Distribution of transcriptomic and proteomic samples (n = 3) in relation to principal components PC1 (disease progression) and PC2 (left/right identity). Lines connect paired samples, obtained from the same individual. Control, green; transition, purple; chronic, orange. LAA samples, dark colours; RAA samples, light colours. Atrial tissue RNA-seq, circles; cardiomyocyte RNA-seq, diamonds; cardiomyocyte LC-MS/MS, squares. (B) Distribution of transcriptomic and proteomic samples in relation to components PC1 (disease progression) and PC3 (transition state). Legend as in A. (C and D) Position of each of the thirty-one clusters identified by GMM unsupervised clustering along the axis that define disease progression and left/right identity (A) or transition state (B). The size of each cluster represented on the plot correlates with the number of features (genes and proteins) that it includes. Colour legend is shown below. Arrows indicate the position of representative clusters (see Figure 3).
Figure 3
Figure 3
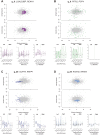
Distribution and expression of representative GMM clusters in the three-component space of AF progression. The position of all individual features of the specified GMM clusters (A, g_0; B, g_6; C, g_20; D, g_24) along the disease progression axis and left/right identity (top) or transition state (middle). Below, violin plots depicting the expression of the features from the specified cluster in each individual experiment (atria RNA-seq, cardiomyocyte RNA-seq, and cardiomyocyte LC-MS/MS), condition (control, transition, and chronic) for both LAA and RAA; mean expression is indicated by a horizontal black line. No proteomic data was available for cluster g_6. Colour legend of the GMM clusters is as in Figure 2.
Figure 4
Figure 4
AF progression increases mitochondrial mass. (A) Immunodetection of the respiratory super-complexes after BNGE of digitonin-solubilized mitochondrial proteins. Complexes and super-complexes detected are indicated. (B) Volcano plot of LAA and RAA cardiomyocyte LC/MS-MS data indicating significantly up-regulated (orange) and down-regulated (blue) proteins that localize to mitochondria in chronic sheep as compared to controls. (C) mtDNA copy number quantification in LAA and RAA by qPCR relative to nuclear DNA. n = 3; *P < 0.05; **P < 0.01; unpaired Student’s t-test.
Figure 5
Figure 5
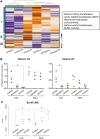
Cardiomyocyte chromatin is disorganized in AF. (A) Heatmap showing the expression (as z-scores) of 142 genes encoding for chromatin remodellers in cardiomyocytes from LAA and RAA of control, transition, and chronic AF sheep. Three main clusters are observed (left), with cluster I showing decreased expression in transition and chronic conditions. This cluster includes mayor histone modifiers and nucleosome remodellers (shown on the right). (B) Quantification of the expression of Histone 3 (left) and Histone 4 (right) during AF progression in cardiomyocytes form right and left atria, as measured by western blot. Values were normalized to those of TNNT2 as cardiomyocyte marker. n = 3; *P-value < 0.05, Student’s unpaired t-test. (C) BovB transposable element transcript abundance (counts) in the RNA-seq data from LAA and RAA cardiomyocytes during AF progression. n = 3; *P-value < 0.05, DEseq default method.
Figure 6
Figure 6
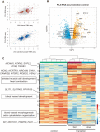
Transcriptomic profiling of posterior left atria tissue. (A) Correlation of the logFC of expression in transition versus control of PLA tissue with LAA tissue (upper panel) and with LAA cardiomyocytes (lower panel). Differentially expressed genes in LAA are shown in red and blue, respectively. Pearson correlation values are indicated in the right bottom corner of each graph. (B) Volcano plot of transition vs. control for PLA tissue. Differentially expressed genes at 5% FDR are shown in orange (up-regulated in transition compared to controls) or blue (down-regulated in transition compared to controls). (C) Heatmap showing the expression (as z-scores) of the 2185 genes found differentially expressed in the PLA when comparing transition versus control sheep (n = 6). Two main branches of the clustering segment the differentially expressed genes into down-regulated and up-regulated for this comparison (transition–control). Various clusters suggest the existence of two different gene expression patterns, for fast and slow sheep to reach persistent AF (indicated as burgundy and blue bars on top of the heatmap, respectively). Genes and GO terms related to individual clusters are indicated on the left.
Figure 7
Figure 7
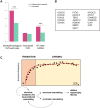
Overlap of intrinsic genetic determinants and extrinsic genetic changes in AF. (A) Graph showing the percentage of differentially expressed (pink) and all expressed (green) features (genes and proteins) in the sheep AF model that are present in the selected list of genes associated by GWAS to electrophysiological CVD and traits, myocardial CVD, and genes associated to AF in two recent meta-analysis loci., Differences between both sets was assessed by a hypergeometric test with Benjamini–Hochberg correction for multiple testing. ***P-value < 1e−04. (B) Representative genes included in the overlap between differentially expressed features in the sheep AF model and AF-associated genes, coding for ion channels (left row), developmental transcription factors and chromatin regulators (middle row), and other cellular components (right row). (C) Diagram depicting the progression of AF from an early state (transition), where electrical, metabolic, and transcriptional changes take place, to a later long-standing persistent (chronic) state when structural remodelling that leads to dilation and hypertrophy occur as a secondary effect. We also propose that chromatin remodelling is a critical factor in sustaining the disease state.

Comment in

References

    1. Chugh SS, Havmoeller R, Narayanan K, Singh D, Rienstra M, Benjamin EJ, Gillum RF, Kim YH, McAnulty JH Jr, Zheng ZJ, Forouzanfar MH, Naghavi M, Mensah GA, Ezzati M, Murray CJ. Worldwide epidemiology of atrial fibrillation: a Global Burden of Disease 2010 Study. Circulation 2014;129:837–847. - PMC - PubMed
    1. Krijthe BP, Kunst A, Benjamin EJ, Lip GY, Franco OH, Hofman A, Witteman JC, Stricker BH, Heeringa J. Projections on the number of individuals with atrial fibrillation in the European Union, from 2000 to 2060. Eur Heart J 2013;34:2746–2751. - PMC - PubMed
    1. Martins RP, Kaur K, Hwang E, Ramirez RJ, Willis BC, Filgueiras-Rama D, Ennis SR, Takemoto Y, Ponce-Balbuena D, Zarzoso M, O’Connell RP, Musa H, Guerrero-Serna G, Avula UMR, Swartz MF, Bhushal S, Deo M, Pandit SV, Berenfeld O, Jalife J. Dominant frequency increase rate predicts transition from paroxysmal to long-term persistent atrial fibrillation. Circulation 2014;129:1472–1482. - PMC - PubMed
    1. de Vos CB, Pisters R, Nieuwlaat R, Prins MH, Tieleman RG, Coelen RJ, van den Heijkant AC, Allessie MA, Crijns HJ. Progression from paroxysmal to persistent atrial fibrillation clinical correlates and prognosis. J Am Coll Cardiol 2010;55:725–731. - PubMed
    1. Nishida K, Michael G, Dobrev D, Nattel S. Animal models for atrial fibrillation: clinical insights and scientific opportunities. Europace 2010;12:160–172. - PubMed

Publication types