. 2021 May 4;15(5):800-812.
doi: 10.1093/ecco-jcc/jjaa220.

The Impact of NOD2 Genetic Variants on the Gut Mycobiota in Crohn's Disease Patients in Remission and in Individuals Without Gastrointestinal Inflammation

Affiliations

The Impact of NOD2 Genetic Variants on the Gut Mycobiota in Crohn's Disease Patients in Remission and in Individuals Without Gastrointestinal Inflammation

Andrew Nelson et al. J Crohns Colitis. .

Abstract

Background and aims: Historical and emerging data implicate fungi in Crohn's disease [CD] pathogenesis. However, a causal link between mycobiota, dysregulated immunity, and any impact of NOD2 variants remains elusive. This study aims to evaluate associations between NOD2 variants and faecal mycobiota in CD patients and non-CD subjects.

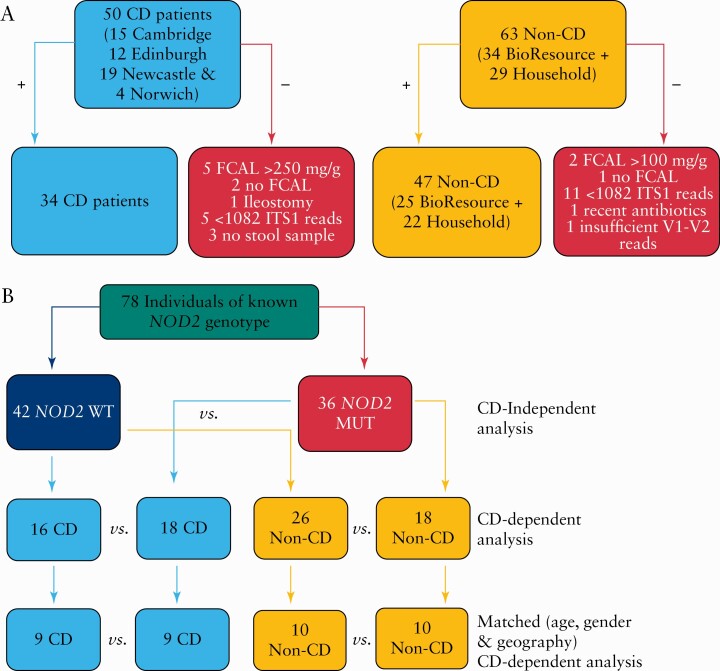
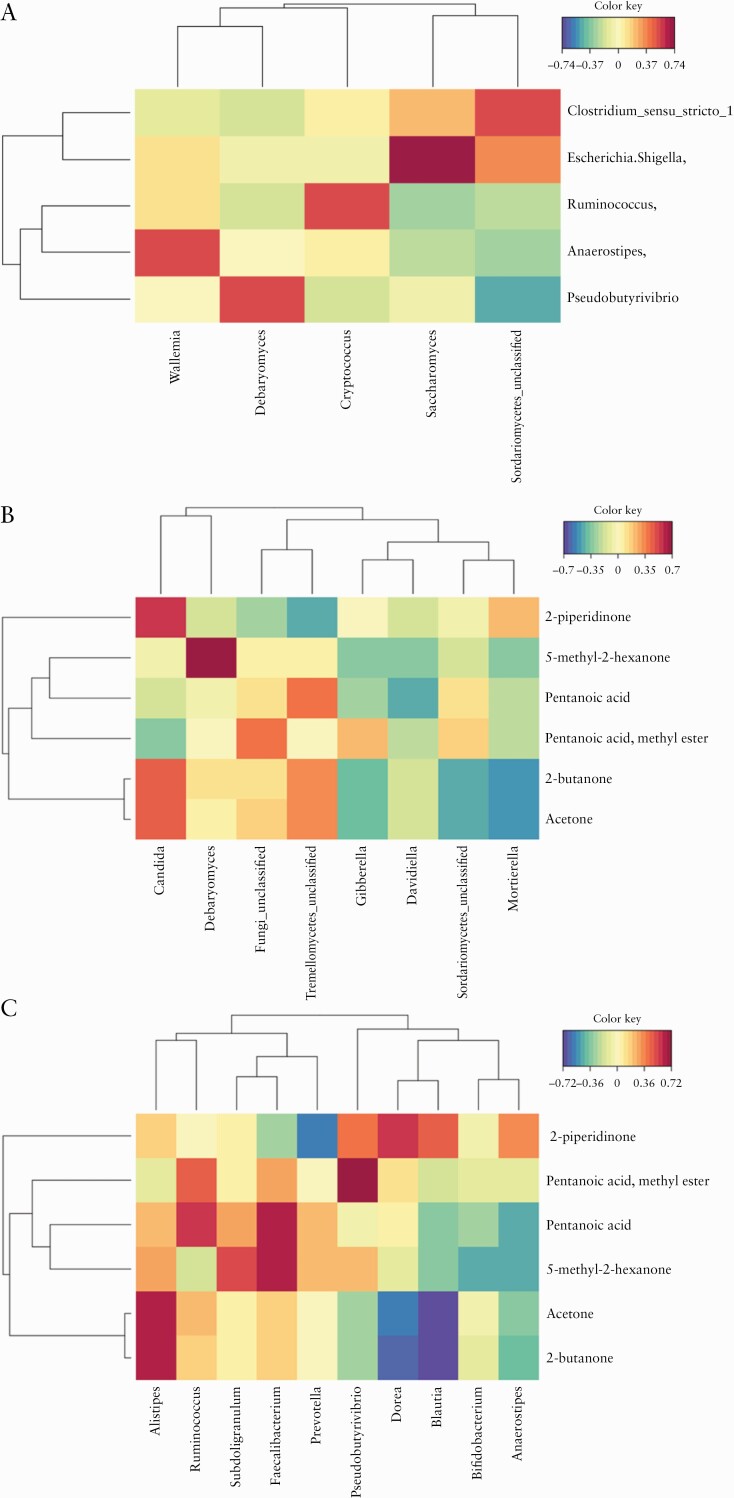
Methods: Faecal samples were obtained from 34 CD patients [18 NOD2 mutant, 16 NOD2 wild-type] identified from the UK IBD Genetics Consortium. To avoid confounding influence of mucosal inflammation, CD patients were in clinical remission and had a faecal calprotectin <250 μg/g; 47 non-CD subjects were included as comparator groups, including 22 matched household [four NOD2 mutant] and 25 non-household subjects with known NOD2 genotype [14 NOD2 mutant] identified by the NIHR BioResource Cambridge. Faecal mycobiota composition was determined using internal transcribed spacer 1 [ITS1] sequencing and was compared with 16S rRNA gene sequences and volatile organic compounds.

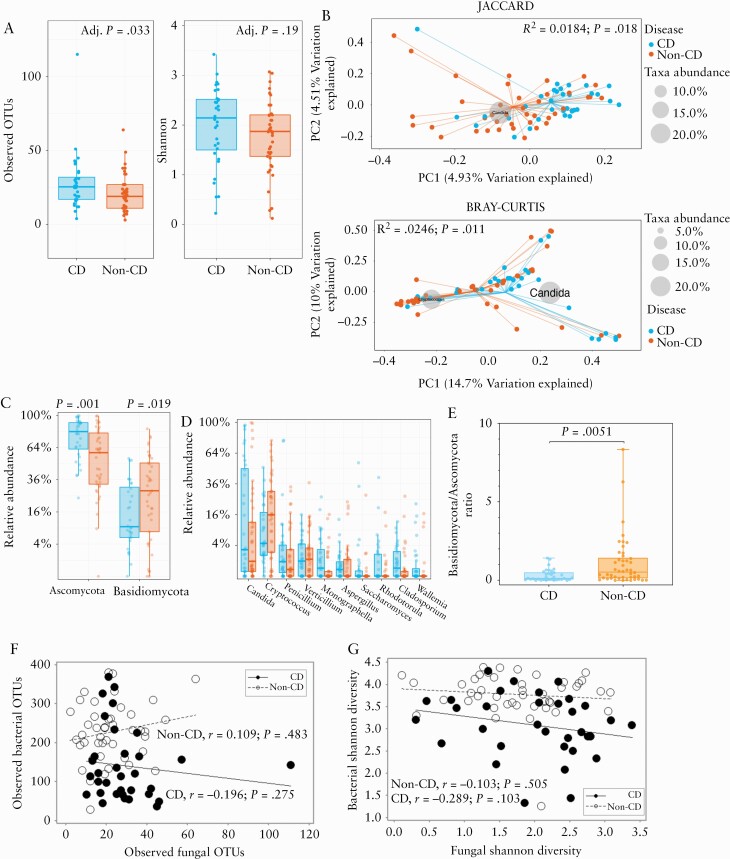
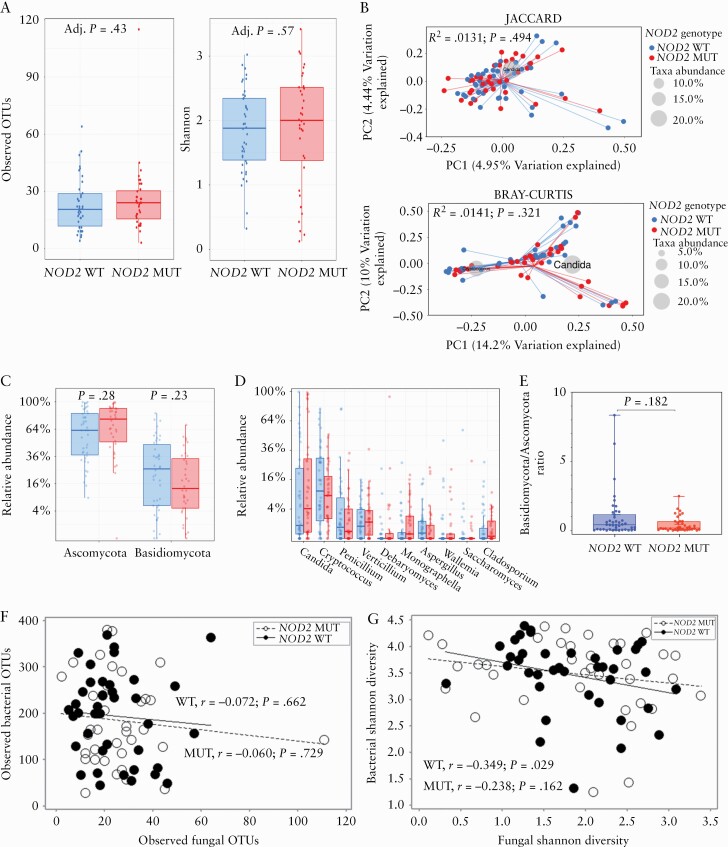
Results: CD was associated with higher numbers of fungal observed taxonomic units [OTUs] [p = 0.033]. Principal coordinates analysis using Jaccard index [p = 0.018] and weighted Bray-Curtis dissimilarities [p = 0.01] showed Candida spp. clustered closer to CD patients whereas Cryptococcus spp. clustered closer to non-CD. In CD, we found higher relative abundance of Ascomycota [p = 0.001] and lower relative abundance Basidiomycota [p = 0.019] phyla. An inverse relationship was found between bacterial and fungal Shannon diversity in NOD2 wild-type which was independent of CD [r = -0.349; p = 0.029].

Conclusions: This study confirms compositional changes in the gut mycobiota in CD and provides evidence that fungi may play a role in CD pathogenesis. No NOD2 genotype-specific differences were observed in the faecal mycobiota.

Keywords: NOD2 genotype; Crohn’s disease; gut mycobiota.


Figures

Figure 1.
Figure 1.
Flow diagrams summarising study participants inclusion criteria and NOD2 analyses. A] Data from 34 CD patients and 47 non-CD individuals were used in the primary analysis. B] Flow of NOD2 analyses to evaluate the impact of NOD2 mutations on the mycobiota independently of disease and to look at disease-NOD2 specific alterations. CD, Crohn’s disease.
Figure 2.
Figure 2.
Altered mycobiota diversity in CD patients during remission compared with non-CD individuals. A] Observed number of OTU and Shannon diversity of the mycobiota. The centre line denotes the median, the boxes cover the interquartile range [Q1-Q3], and the whiskers extend to the most extreme data point, which is no more than 1.5 times the length of the box away from the box. Points outside the whiskers represent outlier samples. [The ranges and descriptive statistics are the same for panels C and D] B] Beta-diversity metrics [Jaccard Index and Bray‐Curtis dissimilarity. C] Percentage relative abundance of Ascomycota and Basidiomycota. D] Percentage relative abundance of the top 10 most abundant fungal genera. E] Basidiomycota/Ascomycota ratio. The middle lines are the median ratio, the boxes cover the interquartile ranges [Q1-Q3]. The whiskers show the range from the minimum ratio to the maximum ratio. F] Association between bacterial and fungal observed OTUs in CD and non-CD [Spearman’s rank correlation test applied to both groups]. G] Association between bacterial and fungal Shannon diversity metrics in CD [Pearson’s correlation] and non-CD [Spearman’s rank correlation]. Where relevant, p-values were adjusted for multiple comparisons using FDR, and considered significant if p <0.05. CD, Crohn’s disease; OTUs, observed taxonomic units; FDR, false-discovery rate.
Figure 3.
Figure 3.
Altered mycobiota diversity in CD patients during remission compared with household matched controls. A] Alpha-diversity metrics [observed OTUs and Shannon]. The centre line denotes the median, the boxes cover the interquartile range [Q1-Q3], and the whiskers extend to the most extreme data point, which is no more than 1.5 times the length of the box away from the box. Points outside the whiskers represent outlier samples. [The ranges and descriptive statistics are the same for panels C and D] B.] Beta-diversity metrics (Jaccard Index [presence/absence of fungal genera] and Bray_Curtis distance [relative abundance of fungal genera]). C] Relative abundance of Ascomycota and Basidiomycota. D] Percentage relative abundance of the top 10 most dominant fungal genera. E] Basidiomycota/Ascomycota ratio. The middle lines are the median ratio, the boxes cover the interquartile ranges [Q1-Q3]. The whiskers show the range from the minimum ratio to the maximum ratio. F] Association between bacterial and fungal OTUs in CD and non-CD [Spearman’s rank correlation test applied to both groups]. G] Association between bacterial and fungal Shannon diversity metrics in CD [Pearson’s correlation] and non-CD [Spearman’s rank correlation]. Where relevant, p-values were adjusted for multiple comparisons using FDR and considered significant if p <0.05. CD, Crohn’s disease; OTUs, observed taxonomic units; FDR, false-discovery rate.
Figure 4.
Figure 4.
Evaluating the impact of NOD2 genotype independently of CD. A.] Alpha-diversity metrics [observed OTUs and Shannon] B] Beta-diversity metrics (Jaccard Index [presence/absence of fungal genera] and Bray‐Curtis distance [relative abundance of fungal genera]) C] Relative abundance of Ascomycota and Basidiomycota. The centre line denotes the median, the boxes cover the interquartile range [Q1-Q3], and the whiskers extend to the most extreme data point, which is no more than 1.5 times the length of the box away from the box. Points outside the whiskers represent outlier samples. [The ranges and descriptive statistics are the same for panels C and D]. D] Percentage relative abundance of the top 10 most prevalent fungal genera. E] Basidiomycota/Ascomycota ratio. The middle lines are the median ratio, the boxes cover the interquartile ranges [Q1-Q3]. The whiskers show the range from the minimum ratio to the maximum ratio. F] Association between bacterial and fungal OTUs in NOD2 wild-type and NOD2 mutant subjects [Spearman’s rank correlation test applied to both groups]. G] Association between bacterial and fungal Shannon diversity metrics in NOD2 wild-type subjects [Pearson’s correlation] and NOD2 mutant subjects [Spearman’s rank correlation]. Where relevant, p-values were adjusted for multiple comparisons using FDR and considered significant if p <0.05. CD, Crohn’s disease; OTUs, observed taxonomic units; FDR, false-discovery rate.
Figure 5.
Figure 5.
Canonical correlation analyses showing fungal and bacterial interactions and that certain volatile organic compounds [VOCs] associate strongly with the relative abundance of fungal and bacterial communities. These analyses are not stratified by disease or NOD2 genotype and include n = 81 study participants. The red and blue shadings indicate the strength of the positive and negative associations, and yellow shading indicates weak to no association. A] Shows the association between the five most dominant fungal genera with five most dominant bacterial genera. B] Shows the association between eight fungal genera and the six most discriminative VOCs [CD vs non-CD]. C] Shows the association between 10 bacterial genera and the six most discriminative VOCs [CD vs non-CD]. CD, Crohn’s disease.

References

    1. Jones GR, Lyons M, Plevris N, et al. . IBD prevalence in Lothian, Scotland, derived by capture-recapture methodology. Gut 2019;68:1953–60. - PMC - PubMed
    1. Ng SC, Shi HY, Hamidi N, et al. . Worldwide incidence and prevalence of inflammatory bowel disease in the 21st century: a systematic review of population-based studies. Lancet 2018;390:2769–78. - PubMed
    1. Cleynen I, Boucher G, Jostins L, et al. . Inherited determinants of Crohn’s disease and ulcerative colitis phenotypes: a genetic association study. Lancet 2016;387:156–67. - PMC - PubMed
    1. Peyrin-Biroulet L, Loftus EV Jr, Colombel JF, Sandborn WJ. The natural history of adult Crohn’s disease in population-based cohorts. Am J Gastroenterol 2010;105:289–97. - PubMed
    1. Cosnes J, Bourrier A, Nion-Larmurier I, et al. . Factors affecting outcomes in Crohn’s disease over 15 years. Gut 2012;61:1140–5. - PMC - PubMed

Substances