Review
. 2020 Nov 24;14(11):14528-14548.
doi: 10.1021/acsnano.0c07581. Epub 2020 Oct 29.

Plasmonic Sensors for Extracellular Vesicle Analysis: From Scientific Development to Translational Research

Affiliations
Review

Plasmonic Sensors for Extracellular Vesicle Analysis: From Scientific Development to Translational Research

Lip Ket Chin et al. ACS Nano. .

Abstract

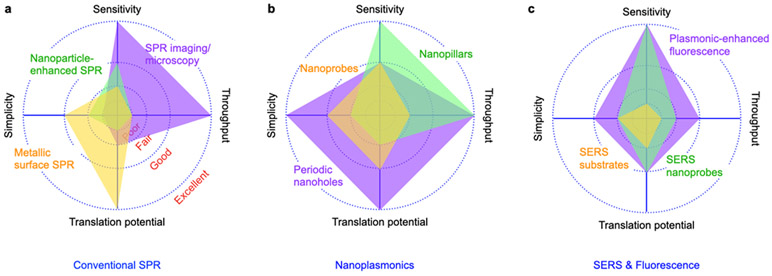
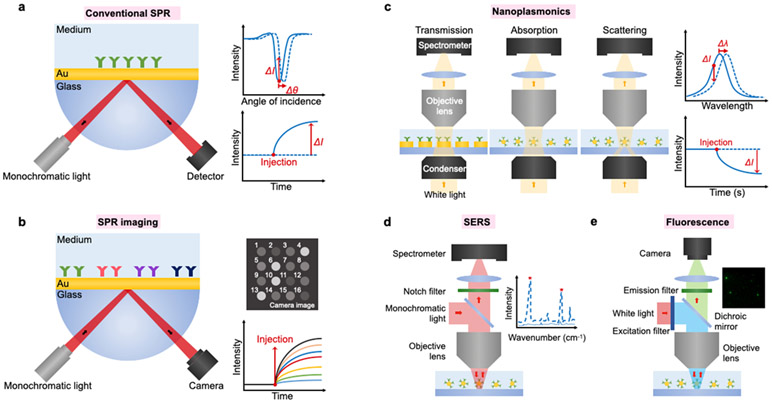
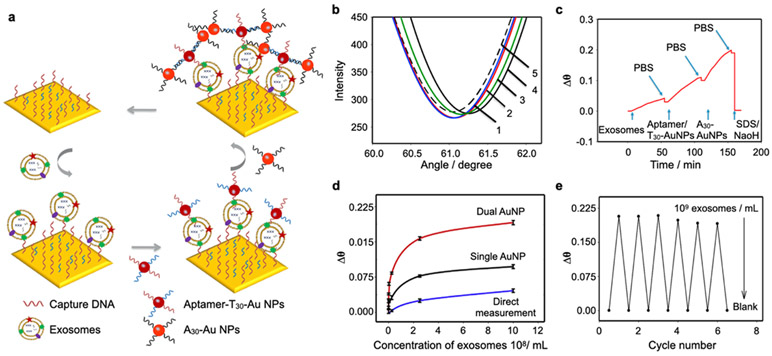
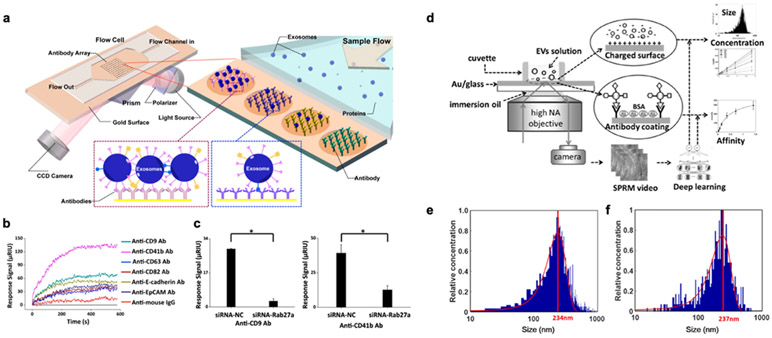
Extracellular vesicles (EVs), actively shed from a variety of neoplastic and host cells, are abundant in blood and carry molecular markers from parental cells. For these reasons, EVs have gained much interest as biomarkers of disease. Among a number of different analytical methods that have been developed, surface plasmon resonance (SPR) stands out as one of the ideal techniques given its sensitivity, robustness, and ability to miniaturize. In this Review, we compare different SPR platforms for EV analysis, including conventional SPR, nanoplasmonic sensors, surface-enhanced Raman spectroscopy, and plasmonic-enhanced fluorescence. We discuss different surface chemistries used to capture targeted EVs and molecularly profile their proteins and RNAs. We also highlight these plasmonic platforms' clinical applications, including cancers, neurodegenerative diseases, and cardiovascular diseases. Finally, we discuss the future perspective of plasmonic sensing for EVs and their potentials for commercialization and clinical translation.

Keywords: biomarkers; biosensing; diagnostics; extracellular vesicles; nanoplasmonics; plasmon-enhanced fluorescence; surface plasmon resonance; surface-enhanced Raman spectroscopy.


Figures

Figure 1.
Figure 1.. Comparison of SPR platforms.
a Conventional SPR. b Nanoplasmonics. c SERS and PEF. System performances are based on demonstrated platforms for EV detection, as summarized in Table 1. Definition of sensitivity indicator: Poor (>106), Fair (~106), Good (~103), Excellent (single exosome). Definition of throughput (demonstrated multiplexing capability) indicator: Poor (single), Fair (~10), Good (~100), Excellent (>1000 arrays). Simplicity is rated qualitatively based on the complexities in the detection system and chip fabrication. Translational potential is rated qualitatively based on demonstrated clinical validation and results with clinical samples.
Figure 2.
Figure 2.. Representative equipment setups of different plasmonic platforms.
a Conventional SPR system using a photodetector to monitor a change in the intensity or resonance angle. b SPR imaging and microscopy using a camera to monitor intensity change in image. c Nanoplasmonic systems using optical transmission configuration to monitor intensity or wavelength change in absorption or scattering spectrum. d SERS system using monochromatic light for excitation and spectrometer to measure a Raman spectrum. e Plasmonic-enhanced fluorescence system using typical fluorescence microscopy for single EV fluorescence imaging.
Figure 3.
Figure 3.. Nanoparticle enhanced SPR platforms.
a Dual Au nanoparticle-assisted signal amplification for exosome detection. b SPR spectra of (1) aptamer modified Au film; (2) target exosomes; (3) reaction with T30 AuNPs; (4) reaction with A30 AuNPs; (5) regeneration. c SPR response of dual AuNP-assisted SPR sensor. d The relationship between Δθ and exosomes concentrations by using different sensing strategies: direct measurement, single AuNP amplified SPR aptasensor, and dual AuNP amplified SPR aptasensor. e Reproducibility investigation of the SPR biosensor. Reprinted with permission from ref. . Copyright 2019 Elsevier.
Figure 4.
Figure 4.. SPR imaging and microscopy.
a SPR imaging in combination with antibody microarray to capture and detect exosomes. b SPRi sensorgrams showing binding of exosomes to various antibodies. c Exosome secretion was suppressed by siRNA-Rab27a (siRNA-NC as a negative control). Reprinted with permission from ref. . Copyright 2014 American Chemical Society. d EVs detection with SPR microscopy with a high NA objective. A deep learning algorithm was developed for automatic SPRM image analysis. e-f Size measurement of EVs with SPRM (e) and nanoparticle tracking analysis (f). Mean values were located at 234 and 237 nm, respectively. Reprinted with permission from ref. . Copyright 2020 American Chemical Society.
Figure 5.
Figure 5.. Nanoplasmonics using periodic nanoholes.
a A scanning electron micrograph of the periodic nanoholes in the nPLEX sensor. b Finite-difference time-domain (FDTD) simulation shows the enhanced electromagnetic fields tightly confined near a periodic nanohole surface. c A representative schematic of changes in transmission spectra showing exosome detection with nPLEX, and scanning electron microscopy shows exosome captured by functionalized nPLEX. d Prototype with 12 × 3 detection spots. The nanohole arrays in the shaded area were integrated with microfluidics. e Comparison of the detection sensitivity of nPLEX and ELISA. f mRNA analysis of exosomes eluted from CaOV3 cells. Following nPLEX protein measurements, captured exosomes were released from the chip and subsequently analyzed for mRNA contents. Reprinted with permission from ref. . Copyright 2014 Springer Nature. g APEX assay for exosome profiling through an in situ enzymatic amplification. h Schematic of changes in the transmission spectra with APEX amplification. i FDTD simulations with back illumination. j Step-by-step APEX transmission spectral changes. The deposit formation led to ~400% signal enhancement. k Comparison of the detection sensitivities of APEX, ELISA, and western blotting. l specificity of APEX assays for measuring target proteins. Reprinted with permission from ref. . Copyright 2019 Springer Nature. Creative Common CC-BY.
Figure 6.
Figure 6.. Nanoplasmonics using nanoprisms and nanoprobes.
a Schematic representation of Au nanoprisms for miR-10b detection. b Comparison of miR-10b (red bars) and miR-10a (blue bars) concentration-dependent plasmonic responses. c Schematic representation illustrates electron-transport through duplex DNA hybridization with miR-10b and miR-10a. Reprinted with permission from ref. . Copyright 2015 American Chemical Society. d Schematic illustration of multicolor visual detection of exosomes based on HCR and enzyme-catalyzed metallization of Au NRs. e-f Color variation (e) and UV–vis absorption spectra (f) of Au NRs in response to different concentrations of exosomes from 0 to 9 × 10³ particles/mL. Reprinted with permission from ref. . Copyright 2019 American Chemical Society.
Figure 7.
Figure 7.. SERS platform.
a Detection process and design inspiration of the Au-coated TiO2 MIO SERS substrate. b SERS spectra of exosomes separated from plasma of different cancer patients and normal individuals. SERS intensity at 1,087 cm−1 is used for analysis. Reprinted with permission from ref. . Copyright 2020 American Chemical Society. c Multiplex exosome detection using SERS nanoprobes. Multiplexed capture probes were constructed by the co-modification of three types of aptamer DNAs. Followed by the recognition between aptamers and target exosomes, the SERS probes are released, and SERS signals are attenuated. d SEM images of the hybridized complexes of SERS probes–magnetic bead, and exosome-magnetic bead. e SERS spectra of the complexes obtained in the presence of single (left) and multiple (right) exosomes. Reprinted with permission from ref. . Copyright 2020 Royal Society of Chemistry.
Figure 8.
Figure 8.. EV molecular profiling for cancer diagnosis.
a Multiparametric plasma EV profiling using periodic nanoholes for the diagnosis of pancreatic malignancy. Scanning electron micrographs show the periodically arranged nanopore array and EVs captured on the surface. b Heatmap analysis of EV markers. The PDACEV signature is defined as a combined marker panel of EGFR, EPCAM, MUC1, GPC1, and WNT2. c The established PDACEV signature signals, d EV concentrations, and e single GPC1 signal as measured for plasma EVs collected from 22 PDAC patients, 8 with pancreatitis, 5 with benign cystic tumors, and 8 age-matched controls. Reprinted with permission from ref. . Copyright 2017 American Association for the Advancement of Science. f Tracking extracellular vesicle phenotypes for melanoma monitoring. EVs from melanoma cells are captured, and SERS nanotags are attached. The characterization of EV phenotypes is performed by SERS mapping (MCSP-MBA, red; MCAM-TFMBA, blue; ErbB3-DTNB, green; LNGFR-MPY, yellow). g Representative false-color SERS spectral images and h corresponding average SERS spectra from patient and normal samples. i Monitoring EV phenotypic evolution of patients 16 and 17 during targeted therapies. Patient 16 was treated with dabrafenib. Stable disease (SD) on day 143 and developed progressive disease (PD) after cessation of treatment (day 263) were shown. Patient 17 received the combination treatment of dabrafenib and trametinib. SD on day 120 and PD at the third visit (day 339) were shown. Reprinted with permission from ref. . Copyright 2020 The Authors, some rights reserved; exclusive licensee American Association for the Advancement of Science. Distributed under a Creative Commons Attribution NonCommercial License 4.0 (CC BY-NC) http://creativecommons.org/licenses/by-nc/4.0/.
Figure 9.
Figure 9.. Subtyping of brain-derived exosomes reflecting brain diseases.
a Detection and characterization of different brain-derived subpopulations of plasma exosomes by SPR imaging. b Sensorgram of exosome detection on the SPRi chip with spots of different antibodies. c SPRi intensities related to the injections of anti-CD81 and anti-GM1 in sequence for exosomes derived from blood plasma of five healthy subjects. Reprinted with permission from ref. . Copyright 2018 American Chemical Society. d Aβ proteins, the main component of amyloid plaques found in AD brain pathology, are released into the extracellular space. Through their surface glycoproteins and glycolipids, exosomes can associate with the released Aβ proteins. e Subtyping of circulating exosome-bound amyloid β using nanoplasmonics with periodic nanoholes. Correlations of different populations of circulating Aβ42 with global average PET brain imaging. When correlated to the global imaging data of brain amyloid plaque, the exosome-bound Aβ42 measurements demonstrated the best correlation. Reprinted with permission from ref. . Copyright 2019 Springer Nature. Creative Common CC-BY.

References

    1. Mathieu M; Martin-Jaular L; Lavieu G; Théry C Specificities of Secretion and Uptake of Exosomes and Other Extracellular Vesicles for Cell-to-Cell Communication. Nat Cell Biol 2019, 21, 9–17. - PubMed
    1. Fraser K; Jo A; Giedt J; Vinegoni C; Yang KS; Peruzzi P; Chiocca EA; Breakefield XO; Lee H; Weissleder R Characterization of Single Microvesicles in Plasma from Glioblastoma Patients. Neuro Oncol 2019, 21, 606–615. - PMC - PubMed
    1. Verma M; Lam TK; Hebert E; Divi RL Extracellular Vesicles: Potential Applications in Cancer Diagnosis, Prognosis, and Epidemiology. BMC Clin Pathol 2015, 15, 6. - PMC - PubMed
    1. Zhang X; Yuan X; Shi H; Wu L; Qian H; Xu W Exosomes in Cancer: Small Particle, Big Player. J Hematol Oncol 2015, 8, 83. - PMC - PubMed
    1. Skog J; Würdinger T; van Rijn S; Meijer DH; Gainche L; Sena-Esteves M; Curry WT; Carter BS; Krichevsky AM; Breakefield XO Glioblastoma Microvesicles Transport RNA and Proteins That Promote Tumour Growth and Provide Diagnostic Biomarkers. Nat Cell Biol 2008, 10, 1470–1476. - PMC - PubMed

Publication types