Clinical Trial
. 2021 Jan 4;131(1):e140491.
doi: 10.1172/JCI140491.

Sustained cellular immune dysregulation in individuals recovering from SARS-CoV-2 infection

Affiliations
Clinical Trial

Sustained cellular immune dysregulation in individuals recovering from SARS-CoV-2 infection

Jacob K Files et al. J Clin Invest. .

Abstract

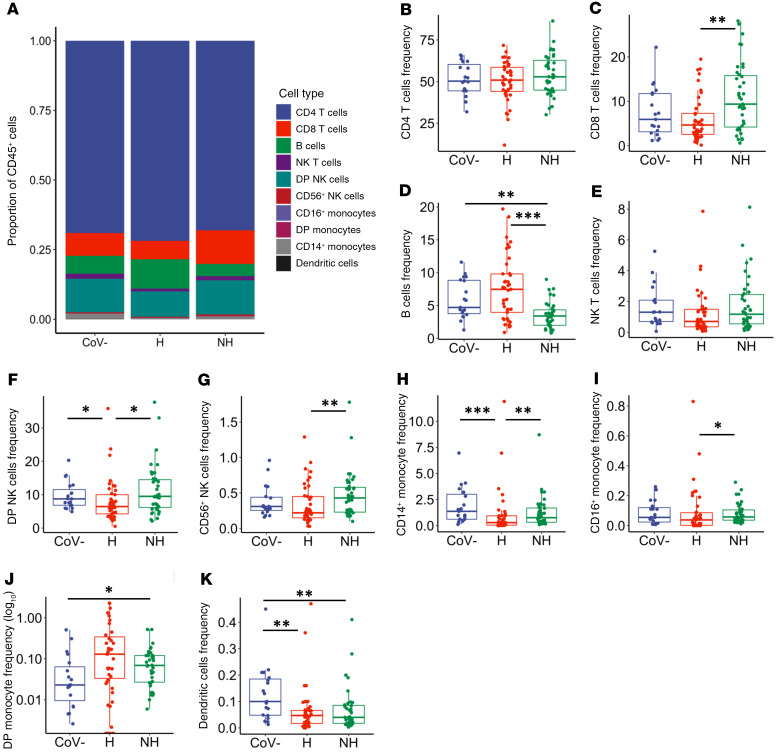
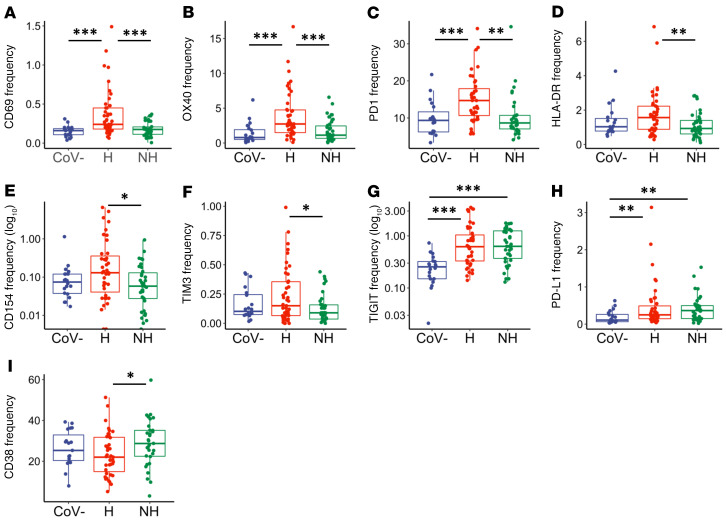
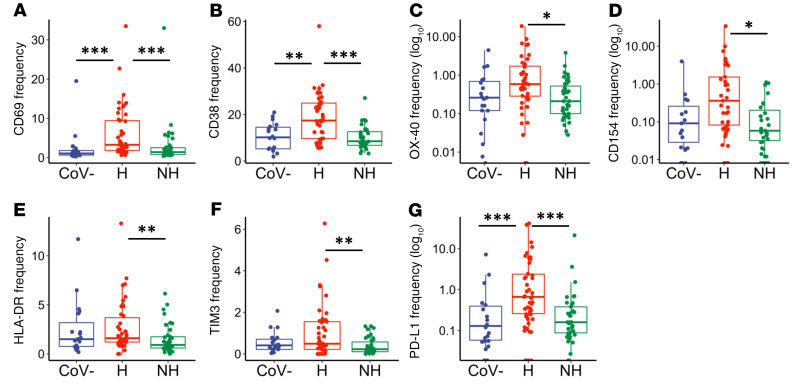
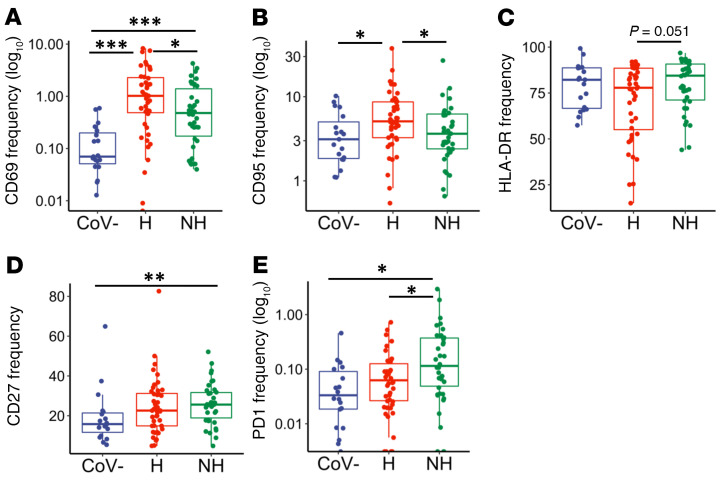
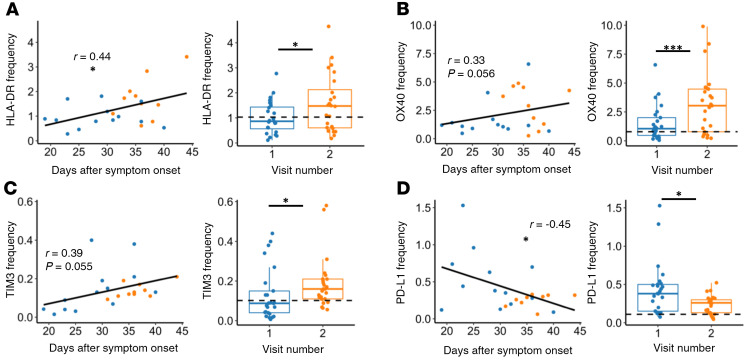
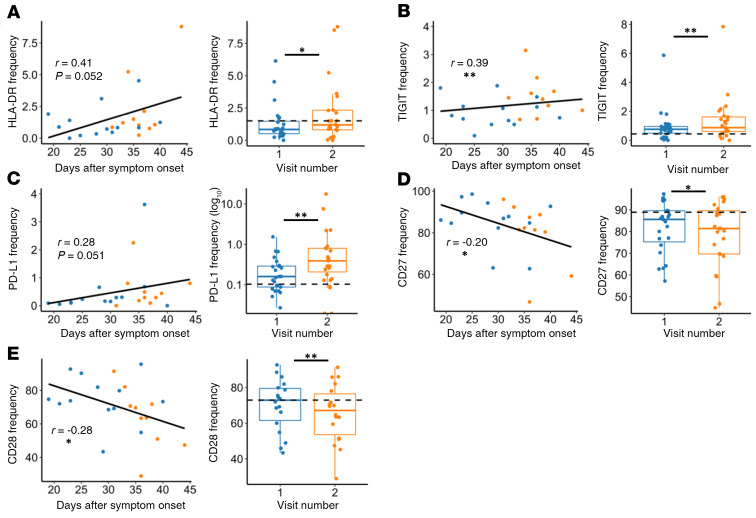
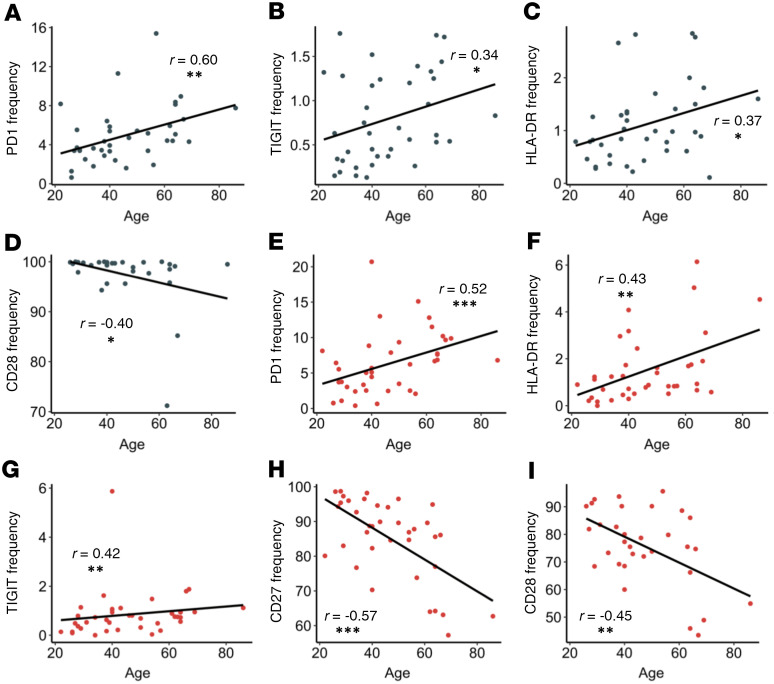
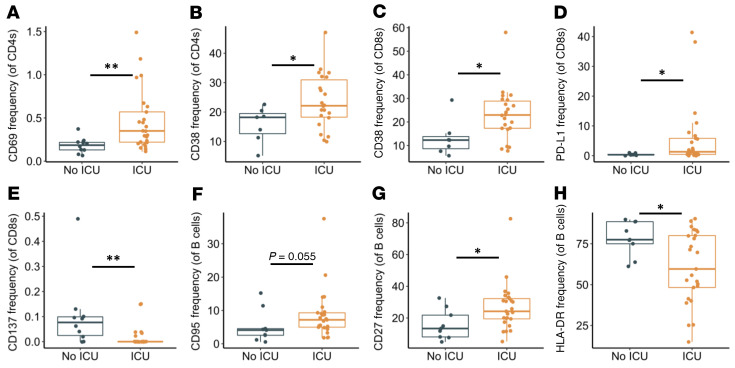
SARS-CoV-2 causes a wide spectrum of clinical manifestations and significant mortality. Studies investigating underlying immune characteristics are needed to understand disease pathogenesis and inform vaccine design. In this study, we examined immune cell subsets in hospitalized and nonhospitalized individuals. In hospitalized patients, many adaptive and innate immune cells were decreased in frequency compared with those of healthy and convalescent individuals, with the exception of an increase in B lymphocytes. Our findings show increased frequencies of T cell activation markers (CD69, OX40, HLA-DR, and CD154) in hospitalized patients, with other T cell activation/exhaustion markers (PD-L1 and TIGIT) remaining elevated in hospitalized and nonhospitalized individuals. B cells had a similar pattern of activation/exhaustion, with increased frequency of CD69 and CD95 during hospitalization followed by an increase in PD1 frequencies in nonhospitalized individuals. Interestingly, many of these changes were found to increase over time in nonhospitalized longitudinal samples, suggesting a prolonged period of immune dysregulation after SARS-CoV-2 infection. Changes in T cell activation/exhaustion in nonhospitalized patients were found to positively correlate with age. Severely infected individuals had increased expression of activation and exhaustion markers. These data suggest a prolonged period of immune dysregulation after SARS-CoV-2 infection, highlighting the need for additional studies investigating immune dysregulation in convalescent individuals.

Keywords: COVID-19; Cellular immune response; Immunology.


Conflict of interest statement

Conflict of interest: The authors have declared that no conflict of interest exists.

Figures

Figure 1
Figure 1. Differential frequencies of immune cell subsets in hospitalized and nonhospitalized individuals.
Staining of isolated PBMCs from healthy (CoV–, n = 19), hospitalized (H, n = 41), and nonhospitalized (NH, n = 39) samples, showing immune cell subsets as a frequency of the total CD45+ population. (A) Overview of all immune cell subsets, with a more in-depth look at (B) CD4+ and (C) CD8+ T cells; (D) B cells; (E) NK T cells; (F) CD56+CD16+ and (G) CD56+CD16 NK cells; (H) CD14+, (I) CD16+, and (J) CD14+CD16+ monocytes; and (K) DCs. Boxplots indicate median, IQR, and 95% confidence interval. P values determined by Wilcoxon’s rank-sum tests and are indicated as follows: *P ≤ 0.05, **P ≤ 0.01, ***P ≤ 0.001.
Figure 2
Figure 2. CD4+ T cell activation and exhaustion in hospitalized and nonhospitalized individuals.
Frequency of CD4+ T cells expressing a given activation or exhaustion marker. (AF) Markers that were elevated in hospitalized patients and similar to baseline in nonhospitalized individuals. (GI) Markers that remained elevated in hospitalized and nonhospitalized individuals. Boxplots indicate median, IQR, and 95% confidence interval. P values determined by Wilcoxon’s rank-sum test. *P ≤ 0.05, **P ≤ 0.01, ***P ≤ 0.001. Healthy: CoV– (nCoV-= 20), hospitalized: H (nH= 46), nonhospitalized: NH (nNH= 39).
Figure 3
Figure 3. CD8+ T cell activation and exhaustion in hospitalized and nonhospitalized individuals.
Frequency of CD8+ T cells expressing a given activation or exhaustion marker. (AG) Markers that were elevated in hospitalized over nonhospitalized individuals. Boxplots indicate median, IQR, and 95% confidence interval. P values determined by Wilcoxon’s rank-sum test. *P ≤ 0.05, **P ≤ 0.01, ***P ≤ 0.001. Healthy: CoV– (nCoV-= 20), hospitalized: H (nH= 46), nonhospitalized: NH (nNH= 39).
Figure 4
Figure 4. B cell activation and exhaustion in hospitalized and nonhospitalized individuals.
Frequency of B cells expressing a given activation or exhaustion marker. (A and B) CD95 and CD69 frequencies were elevated in hospitalized samples, while (C and D) HLA-DR and CD27 frequencies were elevated in nonhospitalized samples. (E) PD1 frequencies remained elevated in nonhospitalized group. Boxplots indicate median, IQR, and 95% confidence interval. P values determined by Wilcoxon’s rank-sum test. *P ≤ 0.05, **P ≤ 0.01, ***P ≤ 0.001. Healthy: CoV– (nCoV-= 20), hospitalized: H (nH= 46), nonhospitalized: NH (nNH= 39).
Figure 5
Figure 5. CD4+ T cell activation and exhaustion over time in nonhospitalized individuals.
(AC) HLA-DR, OX40, and TIM3 frequencies increased over time, while (D) PD-L1 frequency decreased over time in nonhospitalized patients. Plots on left show days after symptom onset versus frequency (n = 23, P values determined by mixed-effects model and relationship represented by linear regression; blue: visit 1, orange: visit 2). Plots on right show paired analysis of first versus second visits (n = 25, P values determined by paired Wilcoxon’s signed-rank test). Dotted line shows median values of healthy samples as baseline. Boxplots indicate median, IQR, and 95% confidence interval. *P ≤ 0.05, ***P ≤ 0.001.
Figure 6
Figure 6. CD8+ T cell activation and exhaustion over time in nonhospitalized individuals.
(AC) Expression of HLA-DR, TIGIT, and PD-L1 increased over time in nonhospitalized individuals, while (DE) CD27 and CD28 frequencies decreased over time. Plots on left show days after symptom onset versus frequency (n = 23, P values determined by mixed-effects model, relationship represented by linear regression; blue: visit 1, orange: visit 2). Plots on right show paired analysis of first versus second convalescent visits (n = 25, P values determined by paired Wilcoxon’s signed-rank test). Dotted line shows median values of healthy samples as baseline. Boxplots indicate median, IQR, and 95% confidence interval. *P ≤ 0.05, **P ≤ 0.01.
Figure 7
Figure 7. Correlations between T cell marker frequencies and age in nonhospitalized individuals.
(AC) PD1, TIGIT, and HLA-DR frequencies on CD4+ T cells (gray dots) increased with age. (D) CD28 frequencies on CD4+ T cells decreased with age. (EG) PD1, HLA-DR, and TIGIT frequencies on CD8+ T (red dots) cells increased with age. (HI) CD27 and CD28 on CD8+ T cells decreased with age. P and r values determined by Spearman’s rank correlation test. *P ≤ 0.05, **P ≤ 0.01, ***P ≤ 0.001; n = 39.
Figure 8
Figure 8. Activation and exhaustion markers in viremic hospitalized ICU patients.
Frequencies of CD4+ T cells, CD8+ T cells, and B cells expressing given activation or exhaustion markers in ICU patients. (A and B) Expression of CD69 and CD38 was elevated in CD4+ T cells. (C and D) Expression of CD38 and PDL1 was elevated in CD8+ T cells, while (E) expression of CD137 was decreased. (F and G) CD95 and CD27 expression was increased in B cells, while (H) HLA-DR expression was decreased. Boxplots indicate median, IQR, and 95% confidence interval. P values determined by Wilcoxon’s rank-sum test. *P ≤ 0.05, **P ≤ 0.01. nNo ICU = 10, nICU = 26.

Comment in

  • Prolonged adaptive immune activation in COVID-19: implications for maintenance of long-term immunity? doi: 10.1172/JCI143928

References

    1. Zhu N, et al. A novel coronavirus from patients with pneumonia in China, 2019. N Engl J Med. 2020;382(8):727–733. doi: 10.1056/NEJMoa2001017. - DOI - PMC - PubMed
    1. Li Q, et al. Early transmission dynamics in Wuhan, China, of novel coronavirus-infected pneumonia. N Engl J Med. 2020;382(13):1199–1207. doi: 10.1056/NEJMoa2001316. - DOI - PMC - PubMed
    1. Wang W, et al. Detection of SARS-CoV-2 in different types of clinical specimens. JAMA. 2020;323(18):1843–1844. - PMC - PubMed
    1. Richardson S, et al. Presenting characteristics, comorbidities, and outcomes among 5700 patients hospitalized with COVID-19 in the New York City area. JAMA. 2020;323(20):2052–2059. doi: 10.1001/jama.2020.6775. - DOI - PMC - PubMed
    1. Huang C, et al. Clinical features of patients infected with 2019 novel coronavirus in Wuhan, China. Lancet. 2020;395(10223):497–506. doi: 10.1016/S0140-6736(20)30183-5. - DOI - PMC - PubMed

Publication types

Substances