. 2020 Oct 29;15(10):e0240963.
doi: 10.1371/journal.pone.0240963. eCollection 2020.

Monitoring physical distancing for crowd management: Real-time trajectory and group analysis

Affiliations

Monitoring physical distancing for crowd management: Real-time trajectory and group analysis

Caspar A S Pouw et al. PLoS One. .

Abstract

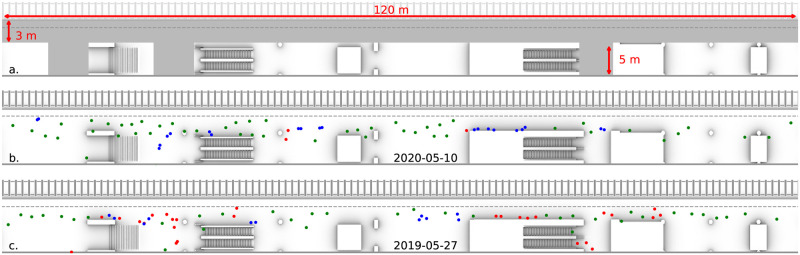
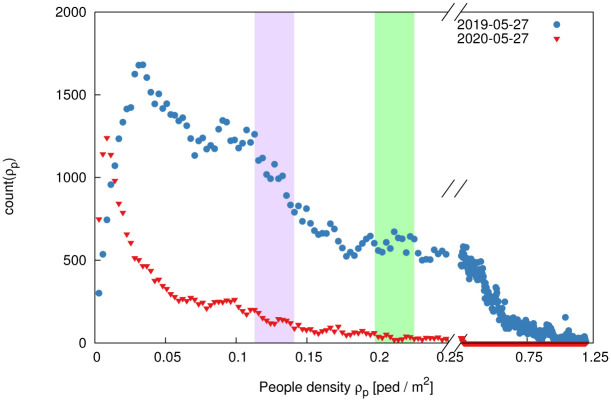
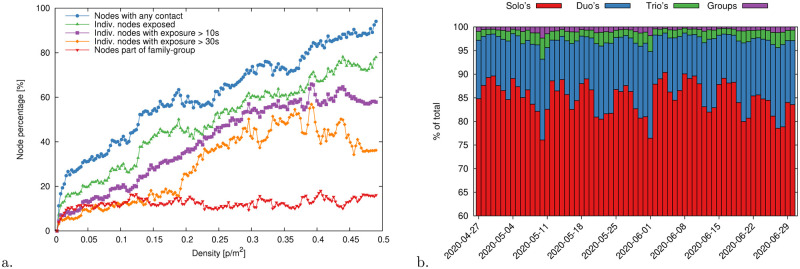
Physical distancing, as a measure to contain the spreading of Covid-19, is defining a "new normal". Unless belonging to a family, pedestrians in shared spaces are asked to observe a minimal (country-dependent) pairwise distance. Coherently, managers of public spaces may be tasked with the enforcement or monitoring of this constraint. As privacy-respectful real-time tracking of pedestrian dynamics in public spaces is a growing reality, it is natural to leverage on these tools to analyze the adherence to physical distancing and compare the effectiveness of crowd management measurements. Typical questions are: "in which conditions non-family members infringed social distancing?", "Are there repeated offenders?", and "How are new crowd management measures performing?". Notably, dealing with large crowds, e.g. in train stations, gets rapidly computationally challenging. In this work we have a two-fold aim: first, we propose an efficient and scalable analysis framework to process, offline or in real-time, pedestrian tracking data via a sparse graph. The framework tackles efficiently all the questions mentioned above, representing pedestrian-pedestrian interactions via vector-weighted graph connections. On this basis, we can disentangle distance offenders and family members in a privacy-compliant way. Second, we present a thorough analysis of mutual distances and exposure-times in a Dutch train platform, comparing pre-Covid and current data via physics observables as Radial Distribution Functions. The versatility and simplicity of this approach, developed to analyze crowd management measures in public transport facilities, enable to tackle issues beyond physical distancing, for instance the privacy-respectful detection of groups and the analysis of their motion patterns.


Conflict of interest statement

The authors have declared that no competing interests exist.

Figures

Fig 1
Fig 1
(a) Floorplan of platform 3 at Utrecht Central Station (NL). The area monitored by the sensors is highlighted in grey. (b) Sample of 75 passengers waiting for a train to arrive on the 10th of May 2020, during the Covid-19 pandemic. Pedestrians which respect the 1.5m physical distance regulations are colored in green, people who are part of a family-group are colored in blue, distance offenders are colored in red. This classification is performed via the method proposed in Section 5. In this situation only 3 out of the 75 people violate the physical distancing rules. (c) Same number of people distributed over the platform on the 27th of May 2019, one year prior to the Covid-19 outbreak, here about one-third of the people stand closer than 1.5m to someone else.
Fig 2
Fig 2. Histogram of observed crowd density levels comparing a day before the Covid-19 outbreak (27th of May 2019, blue dots) and for a day during the Covid-19 pandemic (27th of May 2020, red triangles).
Prior to the Covid-19 outbreak, densities in excess of 1ped/m2 occurred daily. One year later, during the Covid-19 pandemic, the maximum crowd density recorded is only about 0.3ped/m2. We compare measurements acquired at similar density levels, i.e. where the average available space per person is comparable. We focus on two density levels: 40-50 passengers (purple band, cf. Figs 3(a), 3(c) and 6(a)) and 70-80 passengers (green band, cf. Figs 1, 3(b), 3(d) and 6(b)).
Fig 3
Fig 3
(a, b) Radial cumulative distribution functions (RCDF), g(r), and (c, d) radial distribution functions (RDF), G(r), for density levels on a typical working day. On the left (a, c) for density level 1, with 40-50 pedestrians on the platform, (green domain in Fig 2) and on the right (b, d) for density level 2, with 70-80 pedestrians on the platform (purple domain in Fig 2). Vertical dashed lines at 1.5m, 2.2m and 2.5m indicate, respectively, the Dutch social distancing regulations (r < D), the usable width of the platform (without danger zone) and the critical threshold D′. The solid black line at small r values highlights the ∼r2 growth ratio up to 2.2 m and a blue line for the ∼r1 trend at larger mutual distances. In (b,d) the normalization constant c is chosen such that 0cg(z)dz=N, where N is the number of people on the platform. Similar plots for a weekend day are reported in Fig 6. We compare the pre-Covid situation with the present, and with a Monte Carlo model of a random distribution of passengers across a region identical to the platform. We report the RDF and RCDF of the current situation including and excluding family-groups contributions, as made possible by the method introduced in Section 5.
Fig 4
Fig 4
(a) Conceptual sketch representing the accumulation of information on the graph H. Whenever two pedestrians, say p1, p2 stand at a distance d smaller than D′, this gets recorded in the histogram weight of the edge between nodes p1 and p2 as an additive contribution to the bin approximating d. In the sketch we report a section of the platform: edge appear between nodes according to the distance; the histogram weights are reported atop and beneath the sketch with the same color coding of the edges and scaled with the sampling time (thus they translate to the contact time conditioned by the distance). Nodes are reported in red if they have performed at least one Corona event (thus they have an edge with non-zero contributions at distances below D′), else they are in green. (b) Examples of graphs acquired in windows of about ten minutes around each train arrival (determining the peaks in the counts at the bottom). We report a magnified version of one among these graphs. Nodes are colored by the node degree, i.e. by the number of first neighbors, ranging from yellow to red. Edge thickness scaled by the contact time, Ted, Eq (7). The higher the degree of a node, the larger the number of distance offenses performed by the associated pedestrian.
Fig 5
Fig 5
(a) Detected clique consisting of two nodes representing two people traveling together. Both entering the platform through the stairs, waiting together for the next train to arrive and finally boarding the train through the same door. The hue of the trajectories is proportional to the time spent on the platform. Lighter hue when the people enter and a darker hue when they leave. Jump in hue indicating the place where the travelers were waiting. (b) Detected node with degree higher than 10, i.e. a repeated offender who violates physical distancing with more than 10 other people. The trajectory of the repeated offender is reported in shades scaled to the exposure time, while the trajectories of other people that were met violating physical distancing are in gray. The considered offender entered the platform via the escalators and waited underneath the escalators for their train.
Fig 6
Fig 6
Radial distribution functions (RDF), g(r), for a typical weekend day in case of (a) 40-50 pedestrians on the platform, (green domain in Fig 2) and (b) 70-80 pedestrians on the platform (purple domain in Fig 2). The same conventions of Fig 2 hold. The presence of family-groups determine a peak in the RDFs around r ≈ 0.5m, which is much more pronounced than in the working day case. Discounting these contributions via the graph analysis notably restores a ∼r1 growth rate at small r values.
Fig 7
Fig 7
(a) Average individual exposure time without family contributions (Eq (9); weeks 17-26, working days only. Corona lockdown measures in The Netherlands started around week 13). Each line reports average data from bins w0(e),w1(e), etc. The inset on the left shows the average daily passenger count, Ndaily. The inset on the right reports the same individual exposure time data for week 21 in histogram form. A change in the train schedule on the 2nd of June (week 23, indicated with a vertical black dashed line) increased the train frequency by a factor γ ≈ 1.7 (Eq 14). This improved the distribution of pedestrians over the day thereby temporarily decreasing the individual exposure time. To make the data comparable over time and compensate for the train increment, we multiply the exposure times by γ, Eq (14) (dashed green line, bin w2(e) only, i.e. r ∈ [1.0, 1.5] mD). We notice that the compensated exposure time grows steadily in time gaining a factor 3.5×. This is a combined effect of the passenger growth and a reduction in attention and/or difficulty in adhering to physical distancing regulations. In panel (b) we scale the exposure time by the number of passengers, i.e. we report γTp,fd/N (d = 2). This ratio, which we further scale to its value at week 18, displays a ≈100% growth between week 18 and 26, to confirm that the increment of passengers contributes only for 150% of the overall exposure time growth.
Fig 8
Fig 8
(a) Distribution of node-pedestrian degree per day as a percentage of the total number of passengers. The degree of a node counts the number of people encountered with a mutual distance smaller than 1.5m (hence, degree 0 means that a person did not have any Corona event). We observe that high-degree nodes, i.e. repeated distance offenders, increased steadily until the train schedule change (e.g. nodes with 10+ contacts grew from ≈1% to ≈10%). The schedule change yielded a temporary drop in the offender percentage after which it started increasing again. This can be a sign of warning towards the relaxation in the compliance of physical distancing rules. (b) Probability density function of the individual exposure time discounted of families, Tp,fd considering different maximum distances (Eq (9)). Exposure times show a power-law behavior. The PDF depletion after T = 5minutes is most likely due to the time windowing that we operate around each train arrival (cf. Fig 4b). This yields a data cut-off for large times.
Fig 9
Fig 9
(a) Percentage of pedestrian nodes exposed to contacts as a function of the global density on the platform (density calculated as number of people in a frame divided by the total sensor area, 450m2, discounted of the danger zone, 96m2). Exposed nodes that have at least one contact, of any duration, with another pedestrian (within or outside their family-group or not) are in blue. This percentage if further broken down into nodes part of a family group (red) and actual distance offenders (green). The purple and orange lines restrict, respectively, to nodes with a minimum exposure time of 10s and 30s. Linear fitting parameters are reported in Table 1. (b) Distribution of individuals and cliques day-by-day as a percentage of the total number of nodes. Between 80% and 85% of the nodes do not belong to cliques, i.e. they travel alone and their contacts are all distance infringements. Family-groups of two people cover about 12%–15% of the remaining nodes; family-groups of three and more provide a minimal ≈3% contribution.

Similar articles

Cited by

References

    1. World Health Organization. COVID-19: physical distancing; 2020. Available from: https://www.who.int/westernpacific/emergencies/covid-19/information/phys....
    1. Tian H, Liu Y, Li Y, Wu CH, Chen B, Kraemer MUG, et al. An investigation of transmission control measures during the first 50 days of the COVID-19 epidemic in China. Science. 2020;368(6491):638 10.1126/science.abb6105 - DOI - PMC - PubMed
    1. Rader B, Scarpino S, Nande A, Hill A, Reiner R, Pigott D, et al. Crowding and the epidemic intensity of COVID-19 transmission. medRxiv. 2020. 10.1101/2020.04.15.20064980 - DOI
    1. Anderson RM, Heesterbeek H, Klinkenberg D, Hollingsworth TD. How will country-based mitigation measures influence the course of the COVID-19 epidemic? Lancet. 2020;395(10228):931–934. 10.1016/S0140-6736(20)30567-5 - DOI - PMC - PubMed
    1. Chinazzi M, Davis J, Ajelli M, Gioannini C, Litvinova M, Merler S, et al. The effect of travel restrictions on the spread of the 2019 novel coronavirus (COVID-19) outbreak. Science. 2020;368(6489):395–400. 10.1126/science.aba9757 - DOI - PMC - PubMed

Publication types