Review
. 2021 Apr 6;22(7):1176-1189.
doi: 10.1002/cbic.202000744. Epub 2020 Dec 9.

Optical Biosensors for Virus Detection: Prospects for SARS-CoV-2/COVID-19

Affiliations
Review

Optical Biosensors for Virus Detection: Prospects for SARS-CoV-2/COVID-19

Hemanth Maddali et al. Chembiochem. .

Abstract

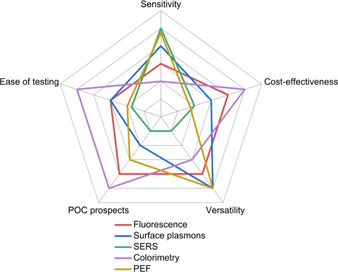
The recent pandemic of the novel coronavirus disease 2019 (COVID-19) has caused huge worldwide disruption due to the lack of available testing locations and equipment. The use of optical techniques for viral detection has flourished in the past 15 years, providing more reliable, inexpensive, and accurate detection methods. In the current minireview, optical phenomena including fluorescence, surface plasmons, surface-enhanced Raman scattering (SERS), and colorimetry are discussed in the context of detecting virus pathogens. The sensitivity of a viral detection method can be dramatically improved by using materials that exhibit surface plasmons or SERS, but often this requires advanced instrumentation for detection. Although fluorescence and colorimetry lack high sensitivity, they show promise as point-of-care diagnostics because of their relatively less complicated instrumentation, ease of use, lower costs, and the fact that they do not require nucleic acid amplification. The advantages and disadvantages of each optical detection method are presented, and prospects for applying optical biosensors in COVID-19 detection are discussed.

Keywords: COVID-19; colorimetry; fluorescence; optical biosensors; plasmons; virus detection.


Conflict of interest statement

The authors declare no conflict of interest.

Figures

Figure 1
Figure 1
Comparison of CT, SPECT, PET, MRI, fluorescence, and bioluminescence molecular‐imaging modalities as related to resolution, sensitivity, detection element, pros and cons. [13]
Figure 2
Figure 2
Fluorescence techniques for virus detection. A) Bioorthogonal labeling of H5N1p with NIR QDs for a noninvasive detection method. Reproduced with permission from ref. [19a]; copyright: 2014, American Chemical Society. B) PT and PT/CB[7] synthesis to form a supramolecular structure with TMV and other pathogens resulting in a change in fluorescence intensity. Reproduced with permission from ref. [4]; copyright: 2018, American Chemical Society. C) Formation of supra‐dots from p‐dots and DCM dye molecules causing a decrease in FRET signal when the supra‐dots bind to the hemagglutinin of the influenza virus. Reproduced with permission from ref. [37]; copyright: 2017, American Chemical Society. D) Fluorescence detector flow strip using antibodies to capture antibody‐conjugated latex NPs for the detection of influenza virus. Reproduced with permission from ref. [38]; copyright: 2016, Ivyspring International.
Figure 3
Figure 3
Different SPR techniques for detecting virus particles. A) SPR intensity imaging for norovirus using an antibody‐functionalized plasmonic chip and QD sandwiching technology. Reproduced with permission from ref. [52]; copyright: 2017, Elsevier. B) Scattering‐intensity LSPR detection of hybridized HIV DNA with DNA–AgNPs forming a low‐scattering agglomerate. Reproduced with permission from ref. [53]; copyright: 2012, Royal Society of Chemistry. C) Angle‐dependent Surface plasmon spectroscopy using antibody modified polymer sensor film to bind virus proteins. Reproduced with permission from ref. [54]; copyright: 2020, MDPI.
Figure 4
Figure 4
Use of colorimetry in virus detection. A) Detection of dengue (green), yellow fever (orange), and Ebola (red) viruses by binding virus particles between surface conjugated antibodies on a flow device and multicolored antibody conjugated Au nanoplates (depicted by triangles). Reproduced with permission from ref. [71]; copyright: 2015, Elsevier. B) Colorimetric detection of H1 N1 using peptide modified PDA as a nanosensor. Reproduced with permission from ref. [72]; copyright: 2016, Royal Society of Chemistry.
Figure 5
Figure 5
Radar chart comparing fluorescence, SPR, SERS, colorimetry and plasmon‐enhanced fluorescence optical detection techniques as tools in testing different viral pathogens. Different parameters are used to qualitatively compare each technique, including: sensitivity[ 71 , 80 ] (detection limit/viral load); cost (instrumentation, fabrication and personnel); versatility [81] (ability to test different pathogens through test modifications); POC prospects; [82] and ease of testing (including testing rate). The further from the center, the higher the relative score the technique received for a particular parameter. This ranking is not absolute and is only provided for the context of this manuscript between the optical phenomena that are discussed.
Figure 6
Figure 6
Use of biomolecules for virus detection. A) Inhibition effect of GXM on TMV infection efficiency through wavelength shift of surface plasmons induced by environmental effects. Reproduced with permission from ref. [85]; copyright: 2013, Royal Society of Chemistry. B) SERS imaging using a sandwich hybridization technique to bind hepatitis B DNA (blue) to a DNA‐capture strand (black) and a DNA‐reporter strand (pink) labeled with a Raman reporter (green). Reproduced with permission from ref. [80d]; copyright: 2017, Wiley. C) QD and AuNP peptide conjugate system for the detection of influenza virus by a decrease in the intensity of LSPR. Reproduced with permission from ref. [86]; copyright: 2020, Elsevier. D) Detection of CTV using antibody conjugated CdTe QDs and antigen conjugated AuNPs. Reproduced with permission from ref. [87]; copyright: 2016, Elsevier.
Figure 7
Figure 7
Microfluidic approaches to virus detection. A) A dual fluidic analysis system first uses microfluidics to specifically bind RNA Ebola particles to magnetic oligonucleotide microbeads, then virus RNA chains are thermally released and fluorescently labeled as they are pumped to an optofluidic device for fluorescence‐enhanced SPR detection. Reproduced with permission from ref. [80b]. Copyright: 2015, Nature Research. B) LFA for the detection of TRV by using OHT‐AuNPs that selectively bind to TRV particles and cause a color change when the conjugated system binds to the test line. Reproduced with permission from ref. [90]. Copyright: 2018, Nature Research.

References

    1. Dimastromatteo J., Charles E. J., Laubach V. E., Respir. Res. 2018, 19, 17. - PMC - PubMed
    1. Ruuskanen O., Lahti E., Jennings L. C., Murdoch D. R., Lancet 2011, 377, 1264–1275. - PMC - PubMed
    1. Li X., Zeng W., Li X., Chen H., Shi L., Li X., Xiang H., Cao Y., Chen H., Liu C., Wang J., J. Transl. Med. 2020, 18, 154. - PMC - PubMed
    1. Bai H., Lu H., Fu X., Zhang E., Lv F., Liu L., Wang S., Biomacromolecules 2018, 19, 2117–2122. - PubMed
    1. World Health Organization, Laboratory testing for coronavirus disease 2019 (COVID-19) in suspected human cases: interim guidance, 2 March 2020. World Health Organization, Geneva, 2020.

Publication types