. 2020 Oct 27;12(11):3134.
doi: 10.3390/cancers12113134.

Reduced SLIT2 is Associated with Increased Cell Proliferation and Arsenic Trioxide Resistance in Acute Promyelocytic Leukemia

Affiliations

Reduced SLIT2 is Associated with Increased Cell Proliferation and Arsenic Trioxide Resistance in Acute Promyelocytic Leukemia

Isabel Weinhäuser et al. Cancers (Basel). .

Abstract

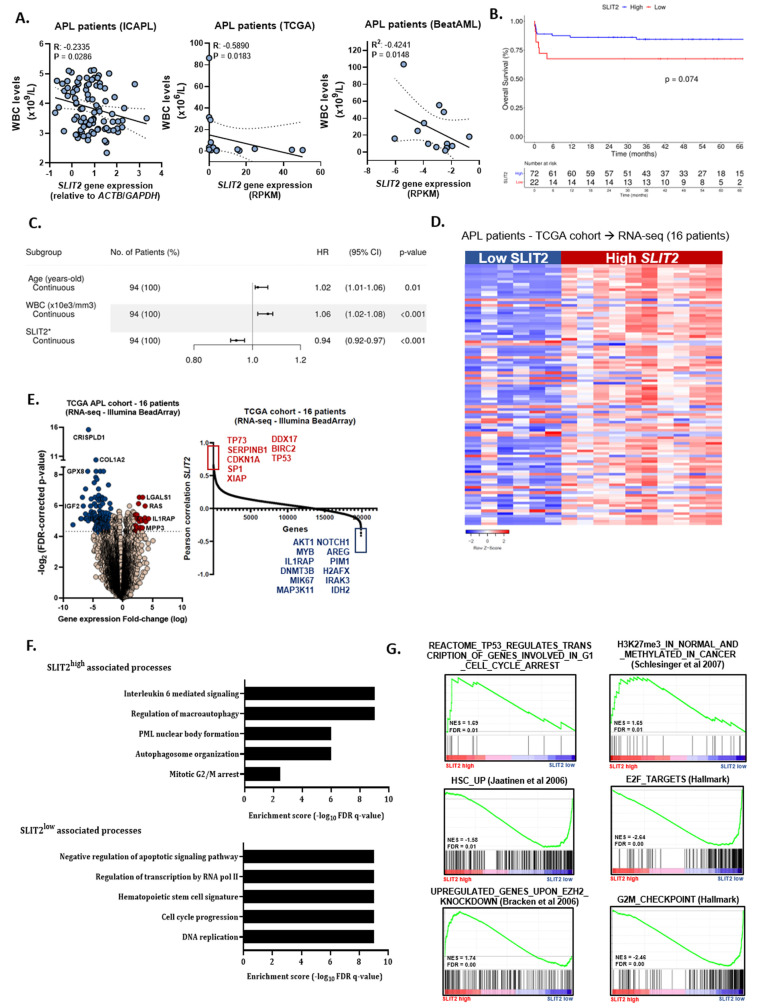
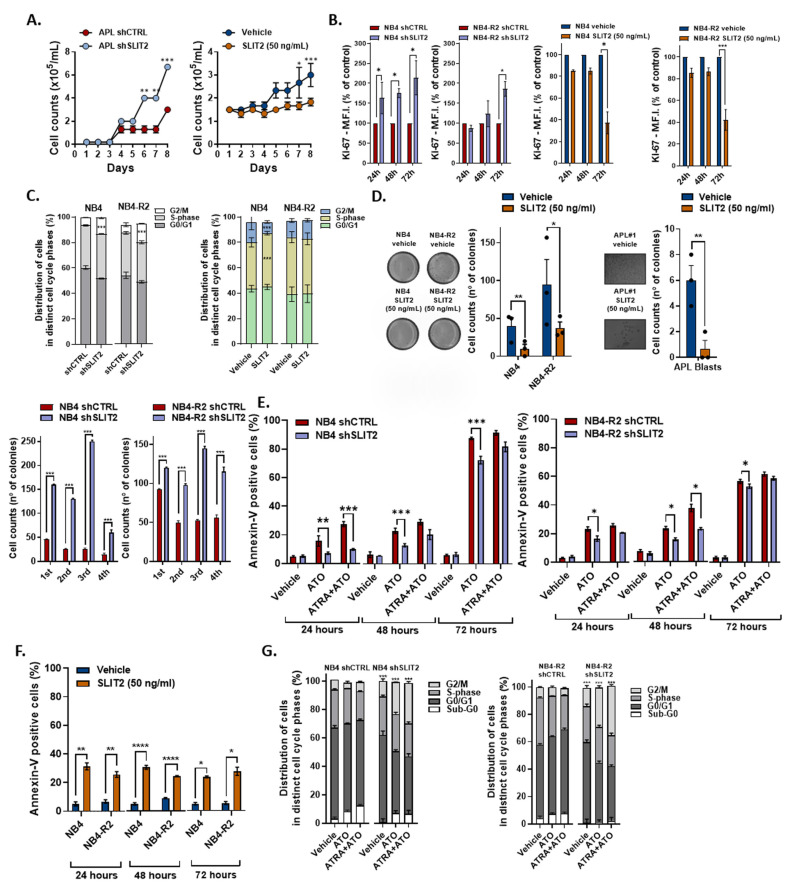
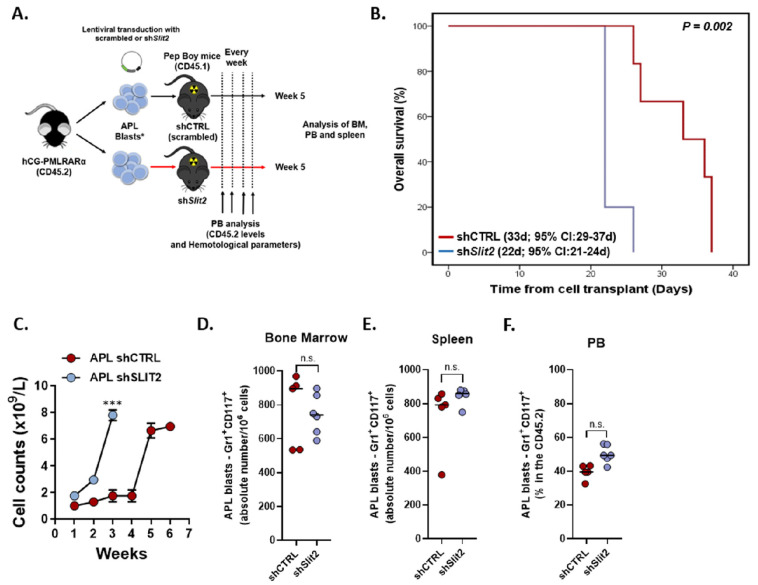
The SLIT-ROBO axis plays an important role in normal stem-cell biology, with possible repercussions on cancer stem cell emergence. Although the Promyelocytic Leukemia (PML) protein can regulate SLIT2 expression in the central nervous system, little is known about SLIT2 in acute promyelocytic leukemia. Hence, we aimed to investigate the levels of SLIT2 in acute promyelocytic leukemia (APL) and assess its biological activity in vitro and in vivo. Our analysis indicated that blasts with SLIT2high transcript levels were associated with cell cycle arrest, while SLIT2low APL blasts displayed a more stem-cell like phenotype. In a retrospective analysis using a cohort of patients treated with all-trans retinoic acid (ATRA) and anthracyclines, high SLIT2 expression was correlated with reduced leukocyte count (p = 0.024), and independently associated with improved overall survival (hazard ratio: 0.94; 95% confidence interval: 0.92-0.97; p < 0.001). Functionally, SLIT2-knockdown in primary APL blasts and cell lines led to increased cell proliferation and resistance to arsenic trioxide induced apoptosis. Finally, in vivo transplant of Slit2-silenced primary APL blasts promoted increased leukocyte count (p = 0.001) and decreased overall survival (p = 0.002) compared with the control. In summary, our data highlight the tumor suppressive function of SLIT2 in APL and its deteriorating effects on disease progression when downregulated.

Keywords: ATRA; SLIT2; acute promyelocytic leukemia; treatment outcomes.


Conflict of interest statement

The authors have no competing financial interests.

Figures

Figure 1
Figure 1
Clinical role of SLIT2 in acute promyelocytic leukemia (APL). (A) Correlation analysis of SLIT2 expression and white blood cell count in APL patients included in the International Consortium of Acute Promyelocytic Leukemia (IC-APL) cohort (left panel), in the TCGA cohort (middle panel) and in the BeatAML study (right panel). The r and p-values are indicated on the figure, Spearman correlation test. (B) The probability of overall survival in APL patients according to the SLIT2 expression. Survival curves were estimated using the Kaplan–Meier method and the log-rank test was used for comparison. (C) Multivariate Cox model for overall survival. Differential expression of SLIT2 can categorize APL patients into different risk groups. (D) Heatmap of differentially expressed genes (supervised clustering) in APL samples from TCGA cohort dichotomized based on the SLIT2 gene expression (dichotomization point: expression below 1; groups: high (n = 10) and low (n = 6) expression). (E) Volcano plot comparing APL patients with low SLIT2 expression versus APL patients with high SLIT2. Fold change was set at 2 for upregulated and downregulated gene expression. Significance was set at a corrected FDR < 0.05. A total of 232 genes were downregulated (blue) and 108 were upregulated (red). (F) Gene ontology (GO) and (G) gene set enrichment analysis (GSEA) on a ranked gene list based on the leading-edge genes for SLIT2 expression in 16 de novo APL patient samples from TCGA study. Genes were ranked based on Pearson correlation using the SLIT2 gene expression. Normalized enrichment score (NES) and false discovery rate (FDR) was used to determine significance.
Figure 2
Figure 2
Effect of SLIT2 on APL cell proliferation. (A) Growth curves using human primary blasts from APL patients, transduced with shSLIT2 or scrambled control (shCTRL) (left panel), and treated with SLIT2 peptide (50 ng/mL) (right panel). (B) Ki67 staining and (C) cell cycle analysis of NB4 and NB4-R2 cell lines transduced with shSLIT2 or scrambled (shCTRL) and wild-type NB4 and NB4-R2 cells treated with SLIT2 peptide (50 ng/mL). (D) Representative example of one of three independent experiments of colony formation assay in methylcellulose using wild-type NB4, NB4-R2 (left panel), and primary human APL blast cells (right panel) treated with SLIT2 peptide (50 ng/mL). Graphic bars represent the average of the number of colony-forming cells when treated. Lower panel shows the graphic bars representing the average of the number of colonies from APL cell lines (NB4 and NB4-R2) transduced with shSLIT2 and control (shCTRL). Effect of SLIT2 on drug-induced apoptosis. Percentage of apoptotic transduced cells (E) and SLIT2-treated cells (F) after 24, 48, and 72 h in culture with apoptotic stimulus. (G) Cell cycle analysis of NB4 and NB4-R2 cell lines transduced with shSLIT2 or scrambled (shCTRL) upon arsenic trioxide (ATO) (1 µM) and ATO + all-trans retinoic acid (ATRA) (1 µM each), for 24 h. Graphic bars represent the mean and standard error (SD) of four independent experiments. * indicates p < 0.05, ** indicates p < 0.01, *** indicates p < 0.001, **** indicates p < 0.0001.
Figure 3
Figure 3
SLIT2 knockdown induces APL clonal expansion and reduces overall survival in vivo. Overview of the mouse model for APL generation. (A) Schematic representation of the generation of the isogeneic mouse model for APL engraftment using blasts from the hCG-PMLRARA mice (CD45.2) transplanted in Pepboy mice (CD45.1). (B) The probability of overall survival in mice transplanted with murine APL blasts transduced with shSlit2 and scrambled as a control (shCTRL). Survival curves were estimated using the Kaplan–Meier method and the log-rank test was used for comparison. (C) Weekly bleedings of mice were used to determine the leukocyte count (*109/L) and monitor disease progression. At sacrifice, APL blasts and cells from Pepboy mice were analyzed by flow cytometry using markers against CD117, Gr1, CD16/32, and CD34, as indicated (inside the population CD45.2+ and lineage negative). Scatter plots showing engraftment of donor APL blast cells (D) in bone marrow (BM), (E) spleen (percentual of engraftment and spleen weight), and (F) peripheral blood (PB) of transplanted mice at sacrifice. Data were expressed as median values. *** indicates p < 0.001; n.s. indicates not significant.

References

    1. Zhou B.B.S., Zhang H., Damelin M., Geles K.G., Grindley J.C., Dirks P.B. Tumour-initiating cells: Challenges and opportunities for anticancer drug discovery. Nat. Rev. Drug Discov. 2009;8:806–823. doi: 10.1038/nrd2137. - DOI - PubMed
    1. Jiang Z., Liang G., Xiao Y., Qin T., Chen X., Wu E., Ma Q., Wang Z. Targeting the SLIT/ROBO pathway in tumor progression: Molecular mechanisms and therapeutic perspectives. Ther. Adv. Med. Oncol. 2019;11:1–14. doi: 10.1177/1758835919855238. - DOI - PMC - PubMed
    1. Huang T., Kang W., Cheng A.S.L., Yu J., To K.F. The emerging role of Slit-Robo pathway in gastric and other gastro intestinal cancers. BMC Cancer. 2015;15:1–9. doi: 10.1186/s12885-015-1984-4. - DOI - PMC - PubMed
    1. Gu F., Ma Y., Zhang J., Qin F., Fu L. Function of Slit/Robo signaling in breast cancer. Front. Med. 2015;9:431–436. doi: 10.1007/s11684-015-0416-9. - DOI - PubMed
    1. Blockus H., Chédotal A. Slit-robo signaling. Development. 2016;143:3037–3044. doi: 10.1242/dev.132829. - DOI - PubMed

LinkOut - more resources