

Troponin and Other Biomarker Levels and Outcomes Among Patients Hospitalized With COVID-19: Derivation and Validation of the HA2T2 COVID-19 Mortality Risk Score
- PMID: 33121304
- PMCID: PMC8174190
- DOI: 10.1161/JAHA.120.018477
Troponin and Other Biomarker Levels and Outcomes Among Patients Hospitalized With COVID-19: Derivation and Validation of the HA2T2 COVID-19 Mortality Risk Score
Abstract
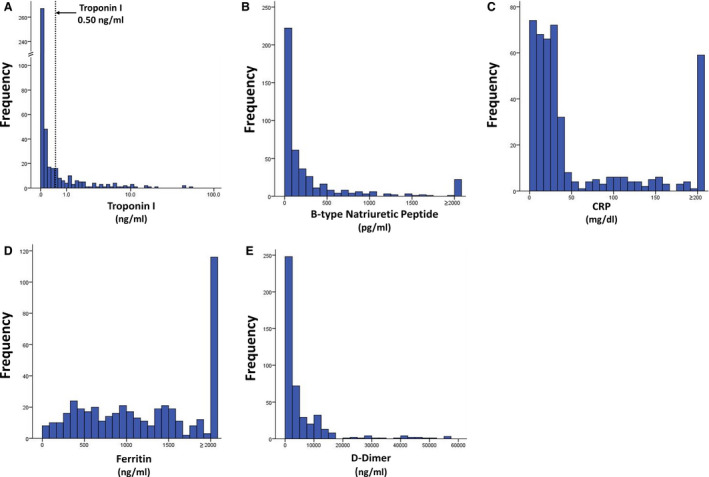
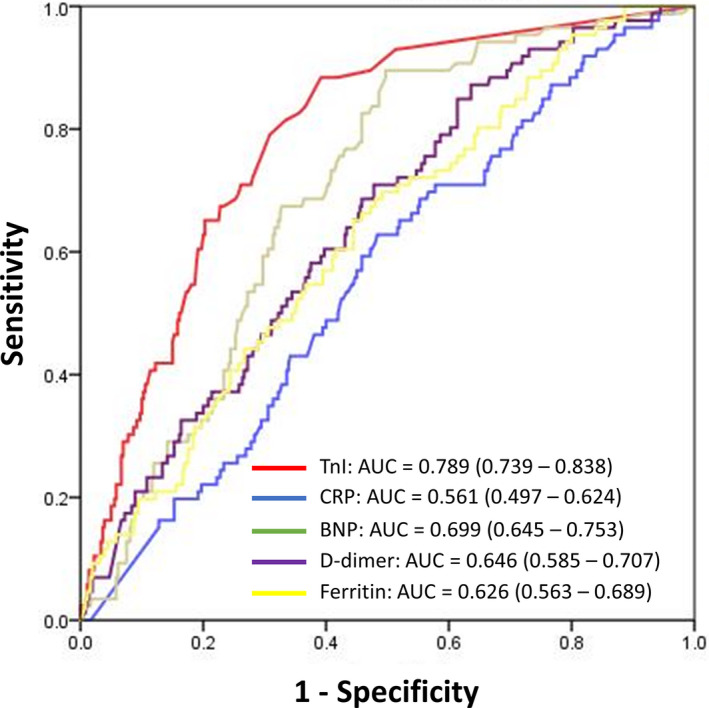
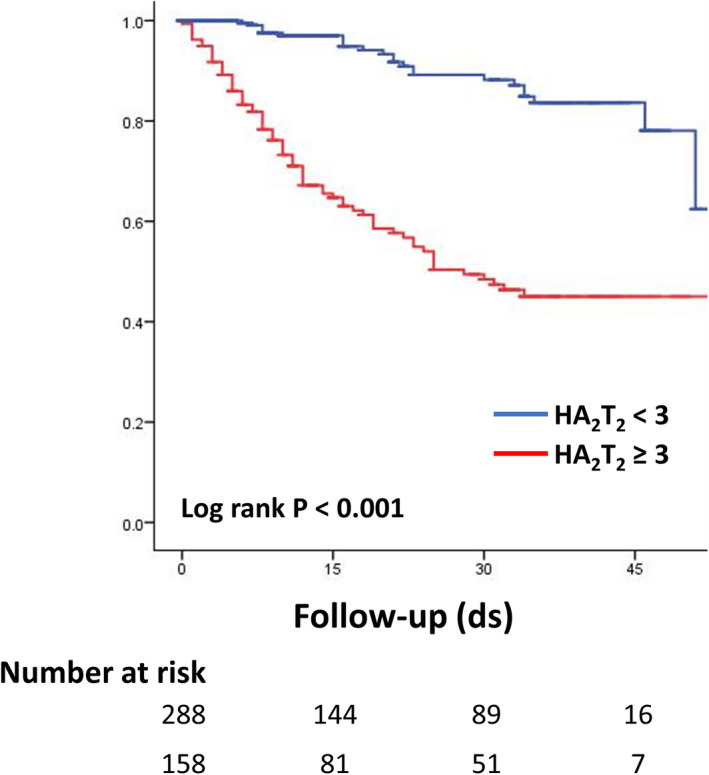
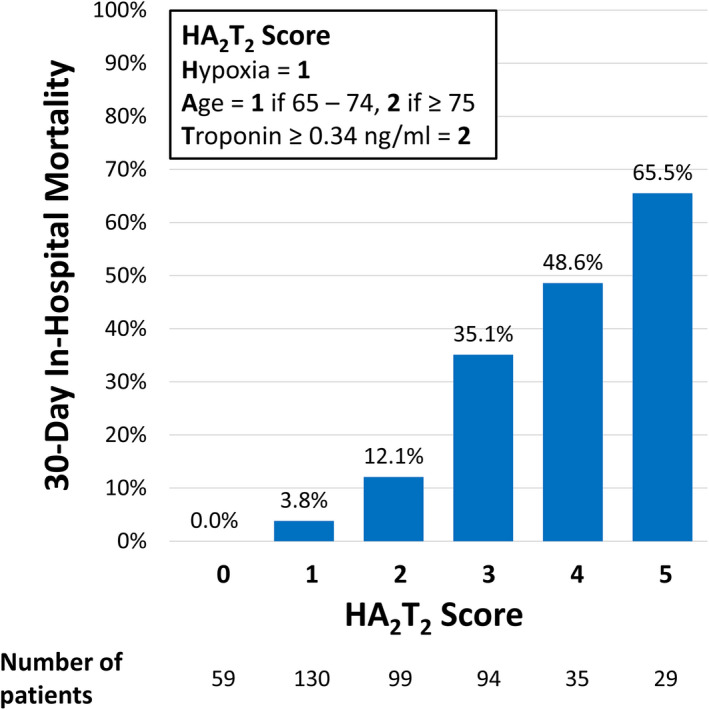
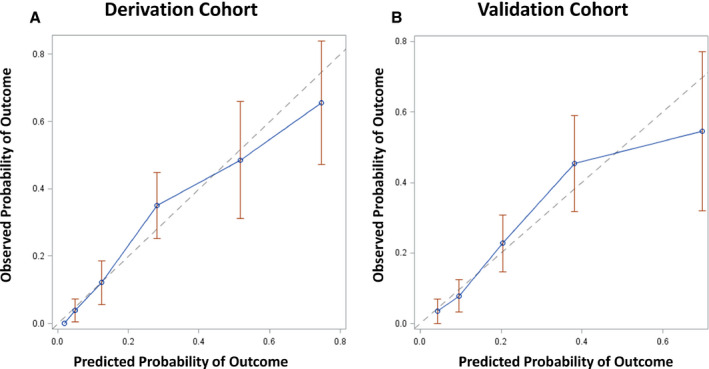
Background The independent prognostic value of troponin and other biomarker elevation among patients with coronavirus disease 2019 (COVID-19) are unclear. We sought to characterize biomarker levels in patients hospitalized with COVID-19 and develop and validate a mortality risk score. Methods and Results An observational cohort study of 1053 patients with COVID-19 was conducted. Patients with all of the following biomarkers measured-troponin-I, B-type natriuretic peptide, C-reactive protein, ferritin, and d-dimer (n=446) -were identified. Maximum levels for each biomarker were recorded. The primary end point was 30-day in-hospital mortality. Multivariable logistic regression was used to construct a mortality risk score. Validation of the risk score was performed using an independent patient cohort (n=440). Mean age of patients was 65.0±15.2 years and 65.3% were men. Overall, 444 (99.6%) had elevation of any biomarker. Among tested biomarkers, troponin-I ≥0.34 ng/mL was the only independent predictor of 30-day mortality (adjusted odds ratio, 4.38; P<0.001). Patients with a mortality score using hypoxia on presentation, age, and troponin-I elevation, age (HA2T2) ≥3 had a 30-day mortality of 43.7% while those with a score <3 had mortality of 5.9%. Area under the receiver operating characteristic curve of the HA2T2 score was 0.834 for the derivation cohort and 0.784 for the validation cohort. Conclusions Elevated troponin and other biomarker levels are commonly seen in patients hospitalized with COVID-19. High troponin levels are a potent predictor of 30-day in-hospital mortality. A simple risk score can stratify patients at risk for COVID-19-associated mortality.
Keywords: COVID‐19; biomarkers; mortality; troponin.
Conflict of interest statement
Dr Cheung has received consulting fees from Abbott, Biosense Webster, Biotronik, and Boston Scientific and fellowship grant support from Abbott, Biosense Webster, Biotronik, Boston Scientific, and Medtronic. Dr Safford has received research grant support from Amgen. The remaining authors have no disclosures to report.
Figures
References
-
- Center for Systems Science and Engineering, Johns Hopkins University . COVID dashboard. https://coronavirus.jhu.edu/map.html. Accessed September 15, 2020.
Publication types
MeSH terms
Substances
Grants and funding
LinkOut - more resources
Full Text Sources
Other Literature Sources
Medical
Research Materials
