. 2020 Oct 29;19(1):152.
doi: 10.1186/s12943-020-01267-6.

YTHDF2 mediates the mRNA degradation of the tumor suppressors to induce AKT phosphorylation in N6-methyladenosine-dependent way in prostate cancer

Affiliations

YTHDF2 mediates the mRNA degradation of the tumor suppressors to induce AKT phosphorylation in N6-methyladenosine-dependent way in prostate cancer

Jiangfeng Li et al. Mol Cancer. .

Abstract

Background: N6-methyladenosine (m6A) is the most abundant modification in mRNA of humans. Emerging evidence has supported the fact that m6A is comprehensively involved in various diseases especially cancers. As a crucial reader, YTHDF2 usually mediates the degradation of m6A-modified mRNAs in m6A-dependent way. However, the function and mechanisms of m6A especially YTHDF2 in prostate cancer (PCa) still remain elusive.

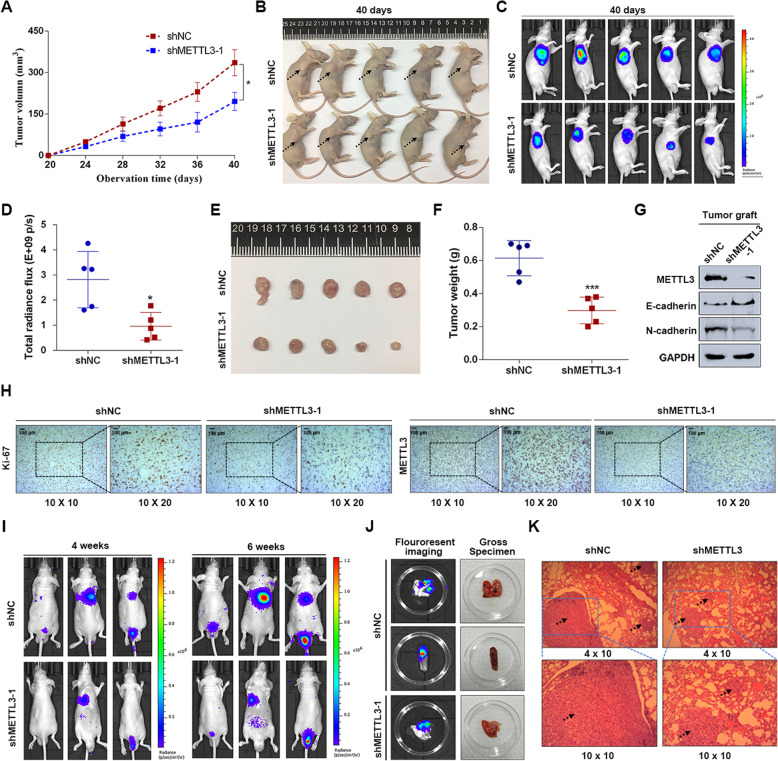
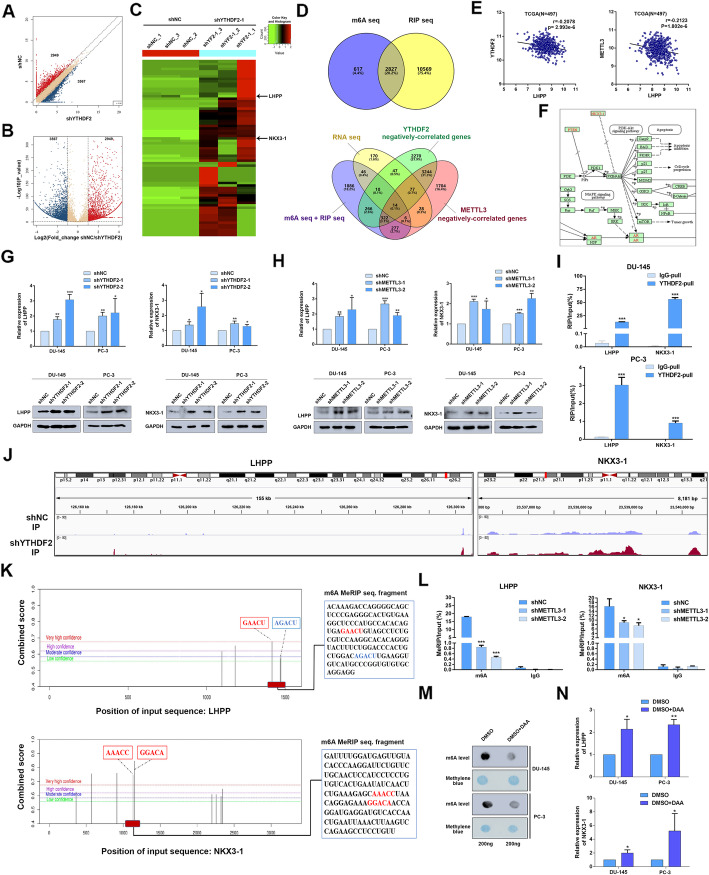
Methods: To investigate the functions and mechanisms of YTHDF2 in PCa, in vitro, in vivo biofunctional assays and epigenetics experiments were performed. Endogenous expression silencing of YTHDF2 and METTL3 was established with lentivirus-based shRNA technique. Colony formation, flow cytometry and trans-well assays were performed for cell function identifications. Subcutaneous xenografts and metastatic mice models were combined with in vivo imaging system to investigate the phenotypes when knocking down YTHDF2 and METTL3. m6A RNA immunoprecipitation (MeRIP) sequencing, mRNA sequencing, RIP-RT-qPCR and bioinformatics analysis were mainly used to screen and validate the direct common targets of YTHDF2 and METTL3. In addition, TCGA database was also used to analyze the expression pattern of YTHDF2, METTL3 and the common target LHPP in PCa, and their correlation with clinical prognosis.

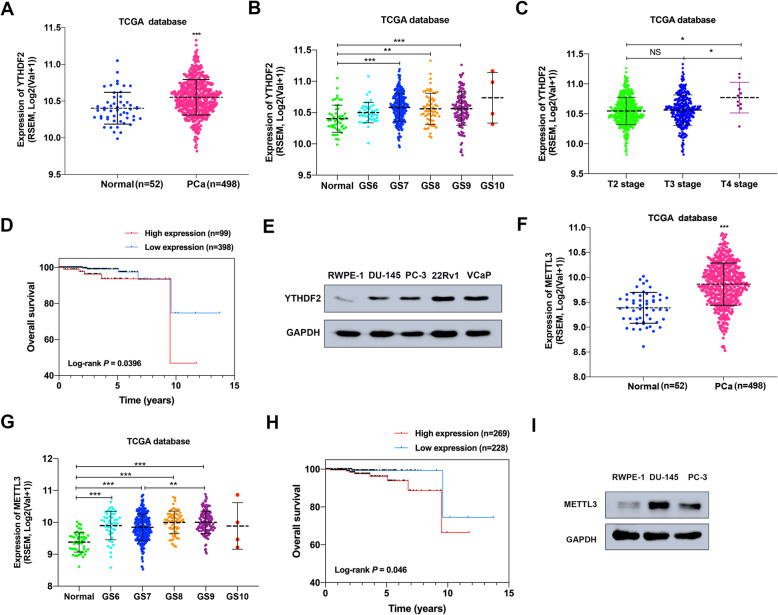
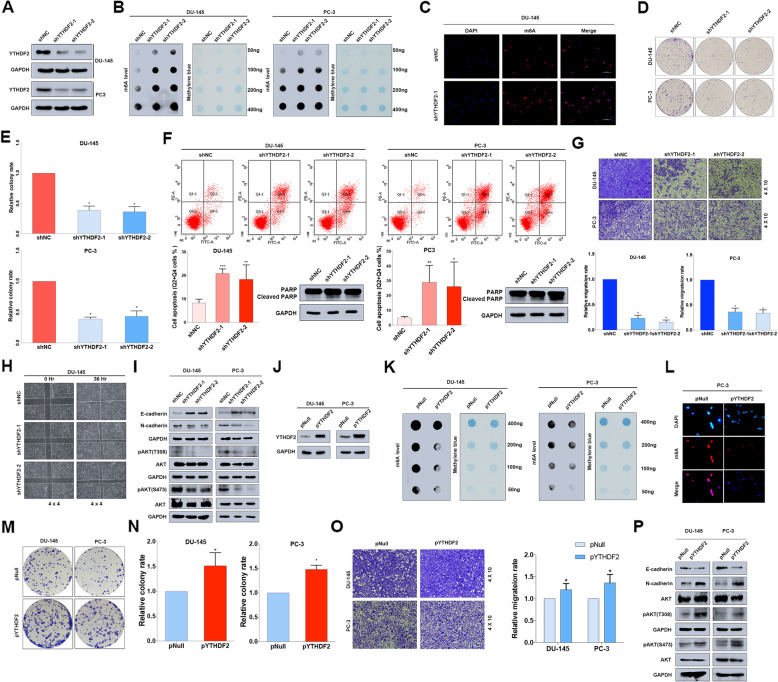
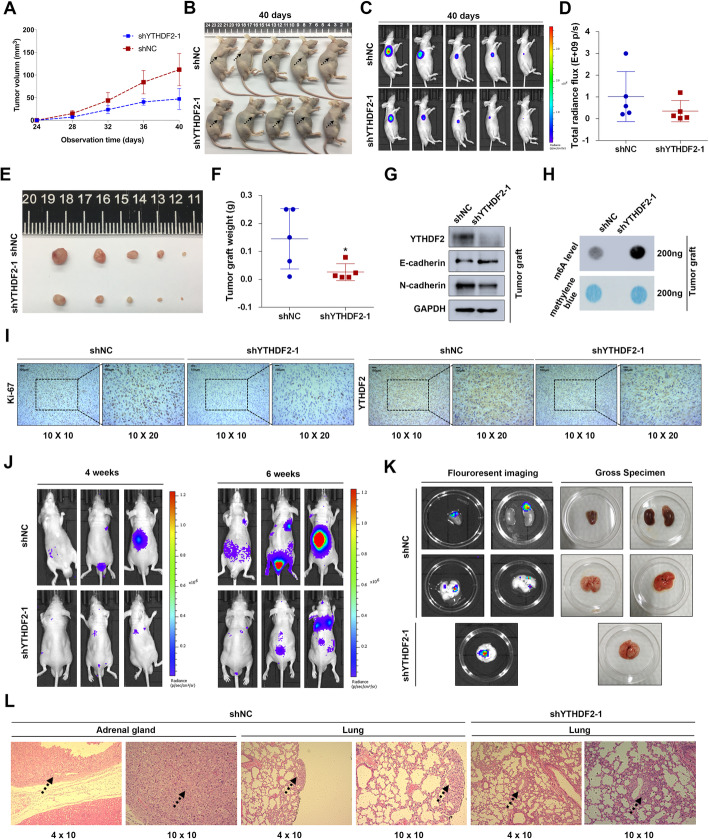
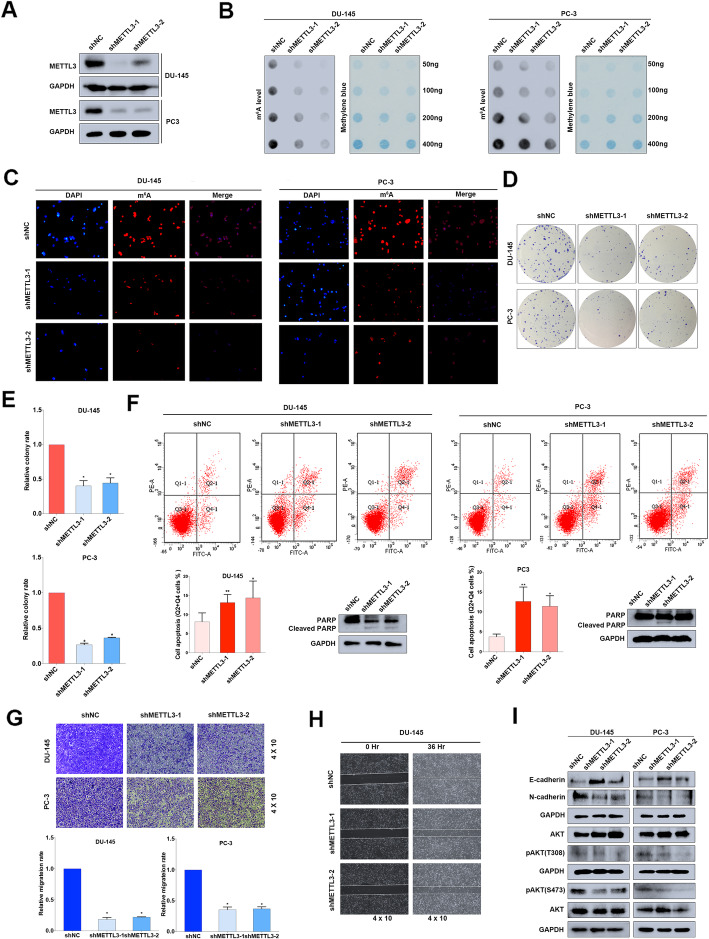
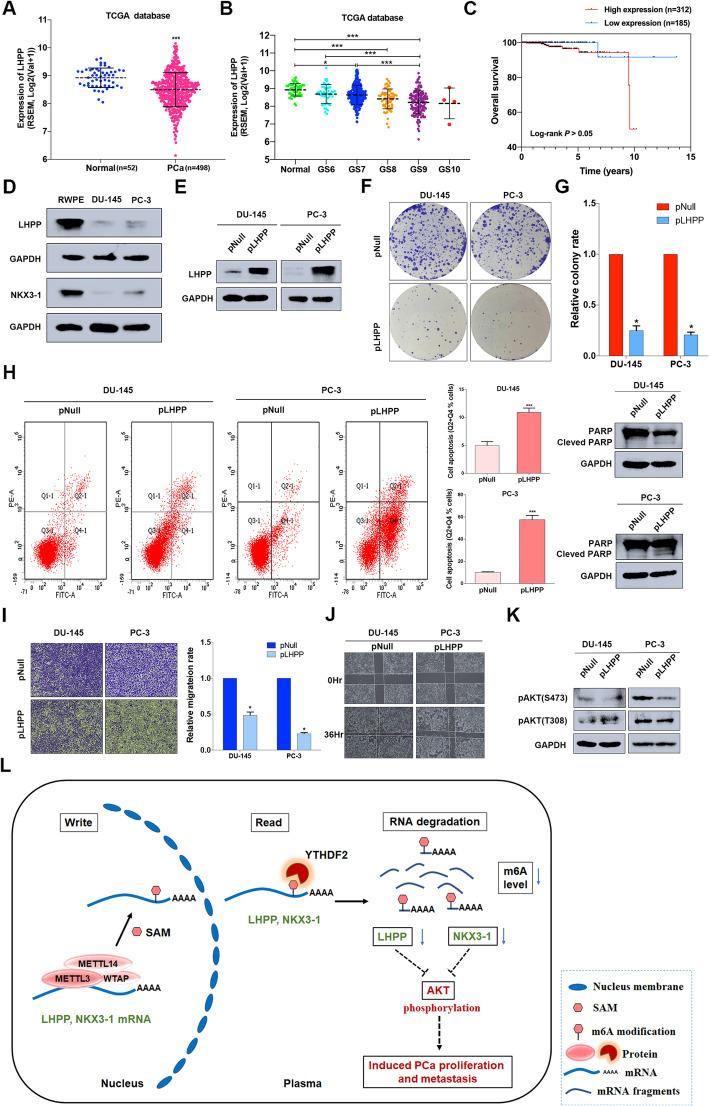
Results: The upregulated YTHDF2 and METTL3 in PCa predicted a worse overall survival rate. Knocking down YTHDF2 or METTL3 markedly inhibited the proliferation and migration of PCa in vivo and in vitro. LHPP and NKX3-1 were identified as the direct targets of both YTHDF2 and METTL3. YTHDF2 directly bound to the m6A modification sites of LHPP and NKX3-1 to mediate the mRNA degradation. Knock-down of YTHDF2 or METTL3 significantly induced the expression of LHPP and NKX3-1 at both mRNA and protein level with inhibited phosphorylated AKT. Overexpression of LHPP and NKX3-1 presented the consistent phenotypes and AKT phosphorylation inhibition with knock-down of YTHDF2 or METTL3. Phosphorylated AKT was consequently confirmed as the downstream of METTL3/YTHDF2/LHPP/NKX3-1 to induce tumor proliferation and migration.

Conclusion: We propose a novel regulatory mechanism in which YTHDF2 mediates the mRNA degradation of the tumor suppressors LHPP and NKX3-1 in m6A-dependent way to regulate AKT phosphorylation-induced tumor progression in prostate cancer. We hope our findings may provide new concepts of PCa biology.

Keywords: M6A; Prostate cancer; RNA degradation; RNA methylation; YTHDF2.


Conflict of interest statement

The authors declare no potential conflicts of interest.

Figures

Fig. 1
Fig. 1
YTHDF2 and METTL3 are frequently upregulated in PCa. a-c The expression pattern of YTHDF2 in total, separate Gleason scores or different T stages were analyzed in 498 PCa tissues and 52 normal controls (TCGA database). Student’s t test was used for statistical analysis of two groups. One-way ANOVA test with Bonferroni’s correction was used for statistical analysis of more than two groups comparisons. d Kaplan–Meier curve was used to evaluate the overall survival rate in a cohort of 497 PCa patients according to the relative mRNA expression of YTHDF2. P value (P = 0.0396) was calculated with log-rank test. e The protein level of YTHDF2 in RWPE-1 and PCa cell lines analyzed by the western blot assay. GAPDH was the internal reference. f, g The expression pattern of METTL3 in total or in separate Gleason score in 498 PCa tissues (52 normal controls) were analyzed by TCGA database. Student’s t test was used for the statistical analysis of two groups comparison. One-way ANOVA test with Bonferroni’s correction was used for statistical analysis of more than two groups comparisons. h The survival probability of METTL3 in PCa patients was analyzed with Kaplan–Meier analysis and log-rank test in 497 PCa patients according to the relative expression of METTL3. i The protein level of METTL3 in RWPE-1 and PCa cell lines analyzed by the western blot assay. GAPDH was the internal reference. Error bars represent the SD obtained from at least three independent experiments; *P ≤ 0.05, **P ≤ 0.01, ***P ≤ 0.001
Fig. 2
Fig. 2
Knock-down of YTHDF2 inhibits the tumor progression of PCa in vitro. a The knock-down efficiency of YTHDF2 shRNAs (shYTHDF2–1 and shYTHDF2–2) with lentivirus constructs in DU-145 and PC-3 cell lines was confirmed by western blot. GAPDH was the internal reference. b m6A RNA dot-blot assay. The m6A level alterations at different total RNA concentrations (50 ng, 100 ng, 200 ng, 400 ng) in DU-145 and PC-3 cell lines were detected. Methylene blue staining was loading control. c The m6A levels detected by IF in DU-145 cell line after knocking down YTHDF2 (shYTHDF2–1), scale bar = 100 μm. d The proliferation ability after knocking down YTHDF2 was evaluated by colony formation assay (representative wells were presented) and (e) statistically analyzed by Mann-Whitney test. f Flow cytometry assay (representative images were presented) and western blot assay were used to confirm the apoptosis analysis induced by knock-down of YTHDF2. GAPDH was the internal reference. Student’s t test was used for the statistical analysis. g and h Trans-well assay and wound-healing assay (representative wells were presented) were assessed for the cell migration in YTHDF2 knock-down cell lines. Mann-Whitney test was used for the statistical analysis. i Western blot assay was used to detect the alterations of EMT-associated proteins and AKT phosphorylation level in YTHDF2 knock-down PCa cell lines. GAPDH was the internal reference. j The overexpression efficiency of pYTHDF2 plasmid (transient transfection with FuGENE HD Transfection Reagent, 0.5 μg/ml) compared with control pNull in DU-145 and PC-3 cell lines was detected by western blot assay. GAPDH was the internal reference. k and l m6A RNA dot-blot assay and IF assay were used to determine the m6A levels after overexpression of YTHDF2. Methylene blue staining was loading control. m Proliferation ability was evaluated by colony formation assay (representative wells were presented) in YTHDF2-overexpressed cell lines, and (n) statistically analyzed with Mann-Whitney test. o Trans-well assay (representative wells were presented) was used to detect the cell migration. Mann-Whitney test was used for the statistical analysis. p The alterations of EMT-associated proteins and AKT phosphorylation level were all detected by western blot assay after overexpression of YTHDF2 in DU-145 and PC-3 cell lines. GAPDH was the internal reference. Error bars represent the SD obtained from at least three independent experiments; *P ≤ 0.05, **P ≤ 0.01, ***P ≤ 0.001
Fig. 3
Fig. 3
Knock-down of YTHDF2 inhibits tumor growth and metastasis in vivo. a-i Subcutaneous tumor model (BALB/c nude mice). a The tumor growth curve of xenografts was plotted in shNC and shYTHDF2 group (n = 5 each group) by measuring the tumor size (width2 × length × 0.52) with vernier caliper each 4 days. b The subcutaneous tumor models were observed at 40 days in two different groups (blank arrows indicated tumor xenografts). c and d The luciferase activities (radiance values) of subcutaneous tumor xenografts were measured at 40 days by in vivo imaging system in two groups. The values of above groups were analyzed with student’s t test. e The BALB/c nude mice were sacrificed for the xenografts, and the size was measured by the beside ruler. f The anatomized subcutaneous tumor xenografts were weighed and analyzed with student’s t test between two groups. g The EMT associated proteins and YTHDF2 protein extracted from anatomized tumor xenografts were analyzed by western blot assay. GAPDH was the internal reference. h Total RNA was extracted from the tumor xenografts, and m6A levels were determined by m6A RNA dot-blot assay. Methylene blue staining was loading control. i Representative IHC staining micrographs of Ki-67, YTHDF2 in tumor xenografts were conducted. Scale bar = 100 μm. j-l Metastatic model (BALB/c nude mice). j The BALB/c nude mice injected with cells (1.5 × 106 per mouse) via tail vein were in vivo imaged at 4th weeks and 6th weeks to evaluate the whole metastasis. k The mice were sacrificed for the metastatic organs which were further in vivo imaged to reconfirm the metastasis. The representative photographs and corresponding gross specimens (right panel) were presented. l Representative H&E staining of metastatic organs (adrenal gland and lung) were performed to identify the metastasis loci. Error bars represent the SD obtained from at least three independent experiments; *P ≤ 0.05, **P ≤ 0.01, ***P ≤ 0.001
Fig. 4
Fig. 4
Knock-down of METTL3 inhibits PCa progression in vitro. a The knock-down efficiency of METTL3 shRNAs (shMETTL3–1, shMETTL3–2) with lentivirus constructs in DU-145 and PC-3 cell lines were detected by western blot assay. GAPDH was the internal reference. b and c m6A RNA dot-blot assay and IF were used to evaluate the m6A level alterations after knocking down METTL3. Methylene blue staining was loading control. d and e The proliferation ability was evaluated by colony formation assay after knocking down METTL3 (representative wells were presented) and statistically analyzed by Mann-Whitney test. f Flow cytometry assay and western blot assay were used to evaluate the apoptosis analysis induced by knock-down of METTL3. GAPDH was the internal reference. Student’s t test was used for the statistical analysis. g and h The trans-well assay and wound-healing assay (representative wells were presented) were used to determine the cell migration after knocking down METTL3. Mann-Whitney test was used for the statistical analysis. i The EMT-associated proteins and AKT phosphorylation were detected by western blot assay. GAPDH was the internal reference. Error bars represent the SD obtained from at least three independent experiments; *P ≤ 0.05, **P ≤ 0.01, ***P ≤ 0.001
Fig. 5
Fig. 5
Knock-down of METTL3 inhibits tumor growth and metastasis in vivo. a-h Subcutaneous tumor model (BALB/c nude mice). a The tumor growth curve of xenografts was plotted in shNC and shMETTL3 group (n = 5 each group) by measuring the tumor size (width2 × length × 0.52) with vernier caliper. The tumor size at the endpoint in above group was analyzed with student’s t test. b The subcutaneous tumor models were observed at 40 days in two different groups (blank arrows indicated tumor xenografts). c and d The luciferase activities (radiance values) of subcutaneous tumor xenografts were measured by in vivo imaging system in two groups. The values of above were analyzed with student’s t test. e The BALB/c nude mice were sacrificed for the xenografts, and the size was measured by the beside ruler. f The anatomized subcutaneous tumor xenografts were weighed and analyzed with student’s t test. g The EMT associated proteins and METTL3 protein extracted from anatomized tumor xenografts were analyzed by western blot assay. GAPDH was the internal reference. h Representative IHC staining micrographs of Ki-67, METTL3 in tumor xenografts were conducted. Scale bar = 100 μm. i-k Metastatic model (BALB/c nude mice). i The BALB/c nude mice injected with cells (1.5 × 106 per mouse) via tail vein were in vivo imaged at 4th weeks and 6th weeks to evaluate the whole metastasis. j The mice were sacrificed for the metastatic organs which were further in vivo imaged to reconfirm the metastasis. The representative photographs and corresponding gross specimens (right panel) were presented. k H&E staining of several metastatic organs (lung) were performed to identify the metastasis loci. Error bars represent the SD obtained from at least three independent experiments; *P ≤ 0.05, **P ≤ 0.01, ***P ≤ 0.001
Fig. 6
Fig. 6
YTHDF2 mediates the mRNA degradation of LHPP and NKX3–1 in m6A-dependent way. a-c MeRIP-seq data in two groups (shNC and shYTHDF2, three triplicates respectively). a Scatter plot of differentially methylated genes. The values of X and Y axes in the scatter plot are the averaged RPM (reads per million) values of each group (log2 scaled). Genes above the top line (2949 red dots, upregulation in shNC group) or below the bottom line (3567 blue dots, upregulation in shYTHDF2 group) indicate more than 2-fold change between two compared groups. Brown dots indicate methylation level without differentially expression. b Volcano plot of differentially methylated genes. The values of X and Y axes in the volcano plot are the fold change (log2 transformed) and P value (−log10 transformed) between two groups, respectively. Red/Blue dots indicate 2-fold change differentially methylated genes with statistical significance (3567 blue dots, upregulated in shYTHDF2 group, 2949 red dots, upregulated in shNC group). Brown circles indicate non-differentially methylated gene. c Heatmap analyzed from MeRIP-seq data listed the representative upregulated genes in m6A levels after knocking down YTHDF2, black arrow referred to the candidate target genes discussed below. d Venn diagram was plotted to show the intersected genes from MeRIP-seq, RIP-seq, mRNA-seq and YTHDF2/METTL3 negatively-correlated genes. Fourteen common genes were screened out. e The correlation between LHPP and YTHDF2 or METTL3 was plotted with GraphPad prism 6.0 by analyzing the negatively-correlated genes downloaded from LinkedOmics (TCGA data). And r = − 0.2078 (P = 2.993e-6) or − 0.2123 (P = 1.802e-6) separately. f The prostate cancer pathway involved in KEGG analysis was obtained from DAVID tool by inputting the 3567 upregulated genes in shYTHDF2 group in MeRIP-seq results as gene list. The graph was downloaded from KEGG database. g and h The mRNA and protein levels of LHPP and NKX3–1were detected with RT-qPCR and western blot after knocking down YTHDF2 or METTL3. GAPDH was the internal reference. Data were analyzed with student’s t test. i RIP-RT-qPCR was utilized to confirm the LHPP and NKX3–1 mRNA enrichment by YTHDF2 in DU-145 and PC-3 cell lines. Data were analyzed with student’s t test. j The mapped reads represent enriched RNA fragments by MeRIP experiment. RNA methylation profiles were loaded in IGV and m6A modification peak alterations in LHPP and NKX3–1 mRNA full length were visualized. k The potential m6A sites of LHPP and NKX3–1 predicted by SRAMP were combined and co-localized with m6A MeRIP-seq results. Different color lines indicated different confidences (red, purple, blue and green respectively represents very high, high, moderate and low confidence). The sequence beside is the fragments captured in MeRIP-seq, which was co-localized with predicted sites. l MeRIP-RT-qPCR was used to detect the m6A level alterations of LHPP and NKX3–1 after knocking down METTL3 in PC-3 cell line. Data was analyzed with student’s t test. m The total RNA m6A level after treatment of DAA was detected with m6A RNA dot-blot assay and compared with DMSO treatment. Methylene blue staining was loading control. n RT-qPCR was utilized to detect the mRNA level of LHPP and NKX3–1 after DAA treatment. Data was analyzed with student’s t test. Error bars represent the SD obtained from at least three independent experiments; *P ≤ 0.05, **P ≤ 0.01, ***P ≤ 0.001
Fig. 7
Fig. 7
The tumor suppressor role of LHPP and NKX3–1 in PCa. a, b The expression pattern of LHPP in total or in separate Gleason score of 498 PCa tissues (52 normal controls) were plotted with TCGA database. Student’s t test was used for the statistical analysis of two groups comparison. One-way ANOVA test with Bonferroni’s correction was used for statistical analysis of more than two groups comparisons. c The survival probability of LHPP was determined with Kaplan–Meier analysis and log-rank test in 497 PCa patients according to the relative expression of LHPP. d The expression of LHPP and NKX3–1 in RWPE-1 and PCa cell lines were identified by western blot. GAPDH was the internal reference. e The overexpression efficiency of pLHPP plasmid (transient transfection with FuGENE HD Transfection Reagent, 0.5 μg/ml) was validated by western blot assay. GAPDH was the internal reference. f and g The colony formation assay (representative wells were presented) was used to evaluate the colony rate after overexpressing LHPP. Mann-Whitney test was used for the statistical analysis. h Flow cytometry assay (representative images were presented) and western blot assay were used to evaluate the apoptosis analysis induced by overexpressing LHPP. GAPDH was the internal reference. i and j Trans-well assay and wound-healing assay (representative wells were presented) were used to determine the cell migration after overexpressing LHPP. Mann-Whitney test was used for the statistical analysis. k The AKT phosphorylation inhibited by LHPP was analyzed by western blot assay. GAPDH was the internal reference. l All the findings in this study is concluded as a schematic diagram. Error bars represent the SD obtained from at least three independent experiments; *P ≤ 0.05, **P ≤ 0.01, ***P ≤ 0.001

Similar articles

Cited by

References

    1. Yue Y, Liu J, He C. RNA N6-methyladenosine methylation in post-transcriptional gene expression regulation. Genes Dev. 2015;29:1343–1355. doi: 10.1101/gad.262766.115. - DOI - PMC - PubMed
    1. Frye M, Harada BT. RNA modifications modulate gene expression during development. Science. 2018;361:1346–1349. doi: 10.1126/science.aau1646. - DOI - PMC - PubMed
    1. Ping XL, Sun BF, Wang L, Xiao W, Yang X, Wang WJ, Adhikari S, Shi Y, Lv Y, Chen YS. Mammalian WTAP is a regulatory subunit of the RNA N6-methyladenosine methyltransferase. Cell Res. 2014;24:177. doi: 10.1038/cr.2014.3. - DOI - PMC - PubMed
    1. Liu J, Yue Y, Han D, Wang X, Fu Y, Zhang L, Jia G, Yu M, Lu Z, Deng X. A METTL3-METTL14 complex mediates mammalian nuclear RNA N6-adenosine methylation. Nat Chem Biol. 2014;10:93–95. doi: 10.1038/nchembio.1432. - DOI - PMC - PubMed
    1. Wang X, Zhao BS, Roundtree IA, Lu Z, Han D, Ma H, Weng X, Chen K, Shi H, He C. N6-methyladenosine modulates messenger RNA translation efficiency. Cell. 2015;161:1388–1399. doi: 10.1016/j.cell.2015.05.014. - DOI - PMC - PubMed

Publication types

MeSH terms