. 2020 Oct 30;12(1):94.
doi: 10.1186/s13073-020-00786-7.

A cell-of-origin epigenetic tracer reveals clinically distinct subtypes of high-grade serous ovarian cancer

Affiliations

A cell-of-origin epigenetic tracer reveals clinically distinct subtypes of high-grade serous ovarian cancer

Pietro Lo Riso et al. Genome Med. .

Abstract

Background: High-grade serous ovarian cancer (HGSOC) is a major unmet need in oncology. The remaining uncertainty on its originating tissue has hampered the discovery of molecular oncogenic pathways and the development of effective therapies.

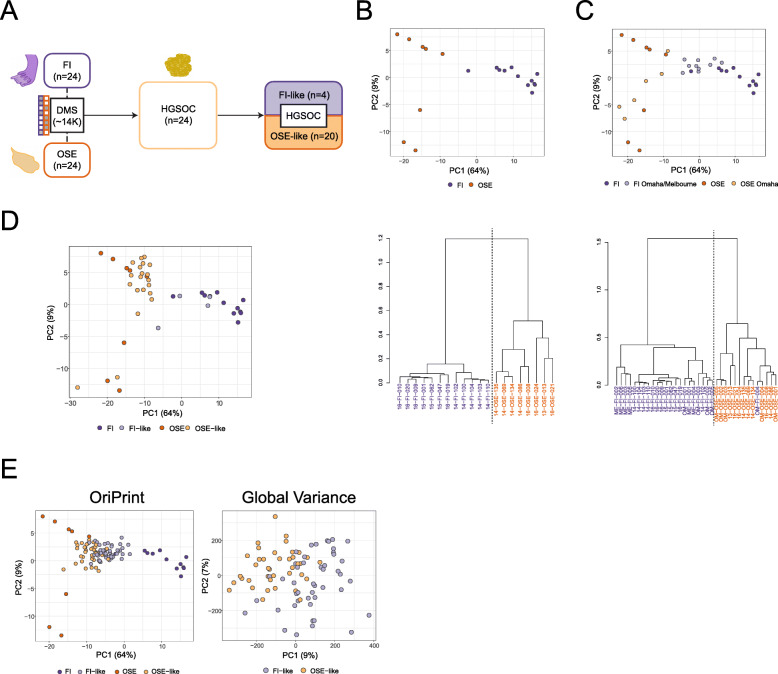
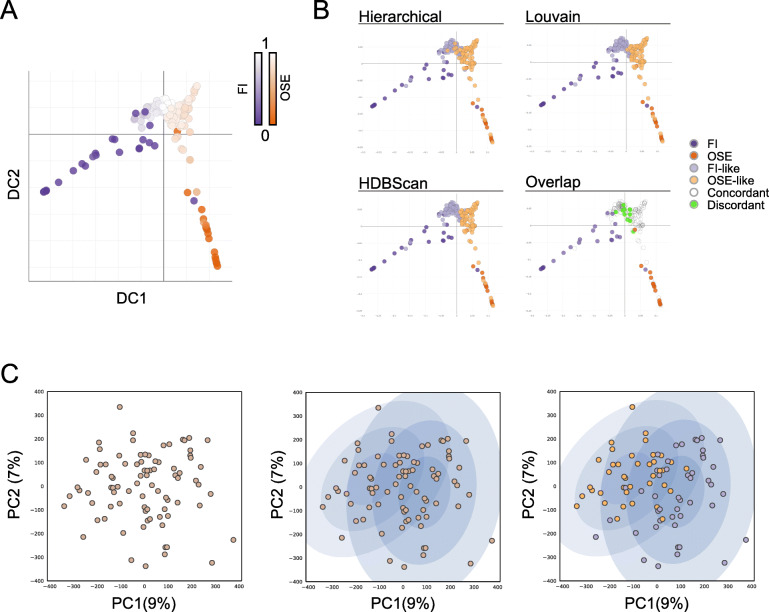
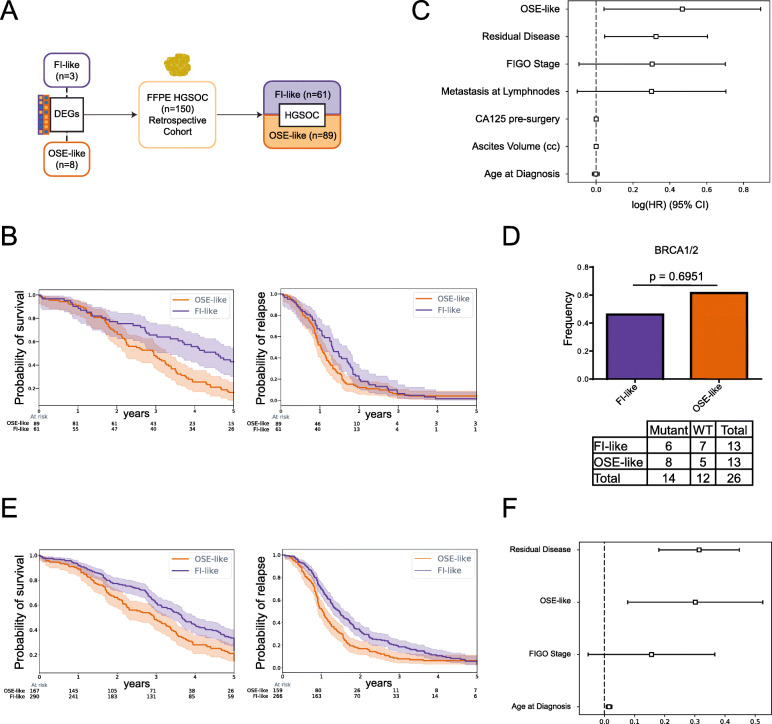
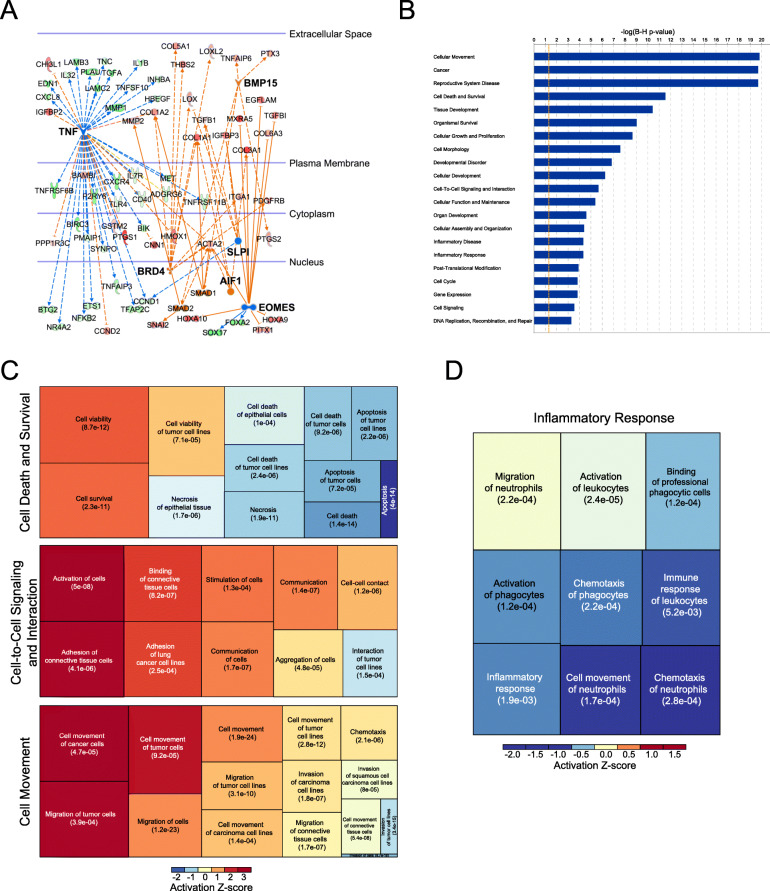
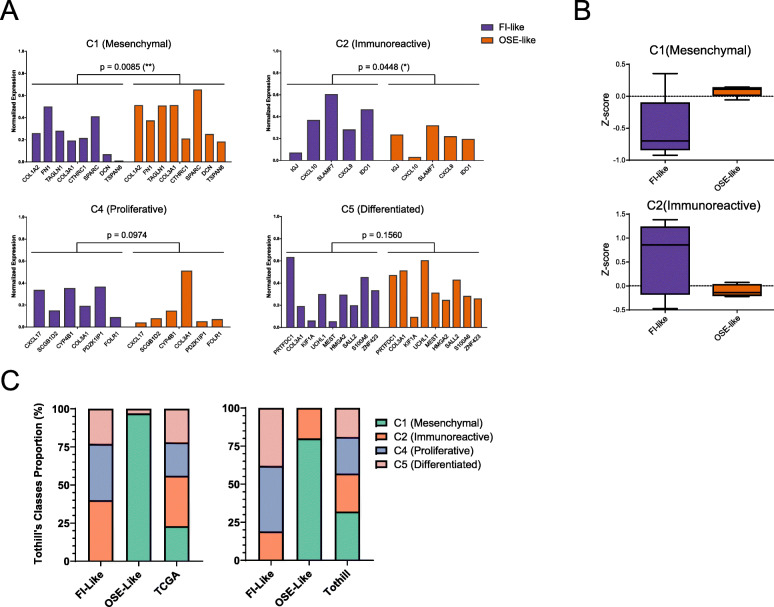
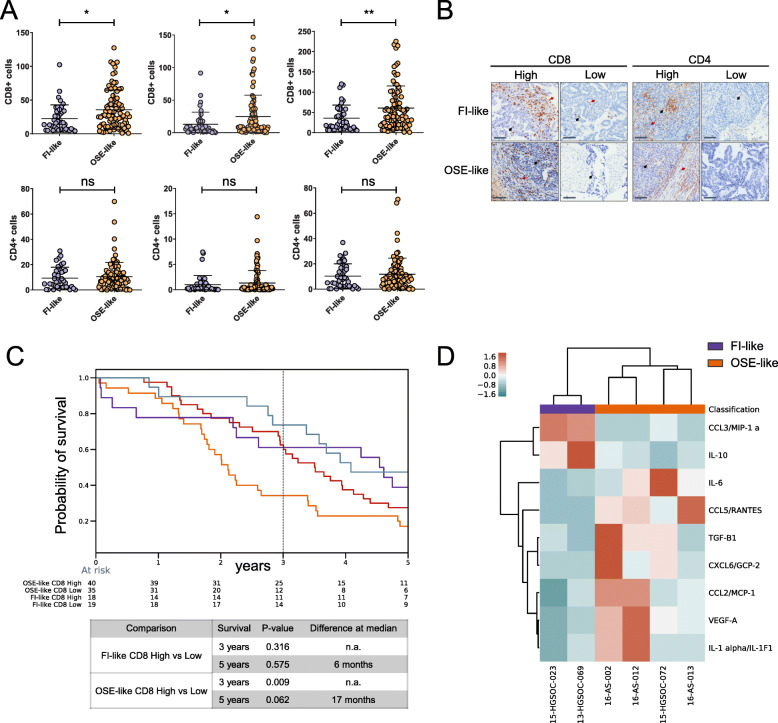
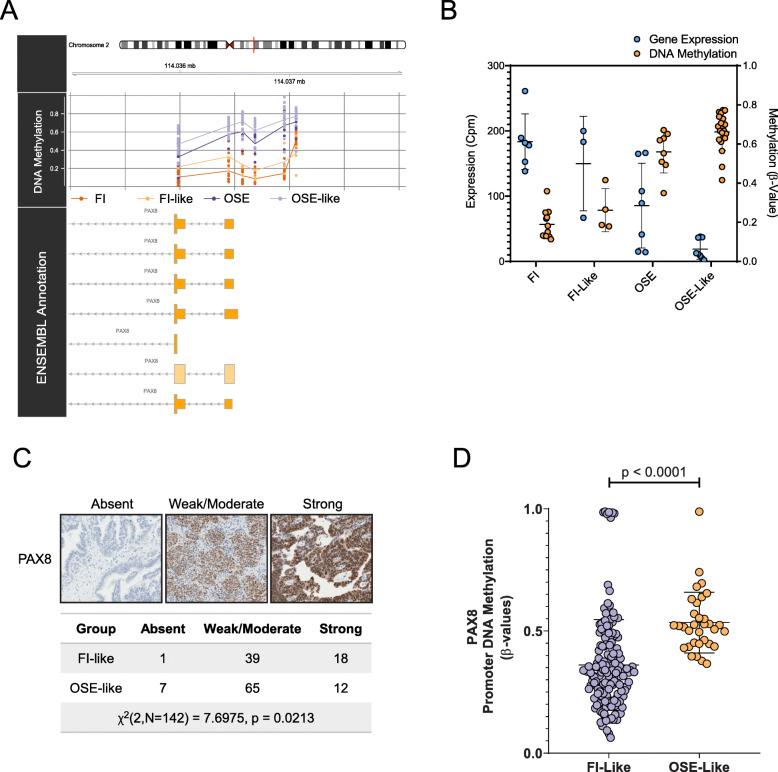
Methods: We used an approach based on the retention in tumors of a DNA methylation trace (OriPrint) that distinguishes the two putative tissues of origin of HGSOC, the fimbrial (FI) and ovarian surface epithelia (OSE), to stratify HGSOC by several clustering methods, both linear and non-linear. The identified tumor subtypes (FI-like and OSE-like HGSOC) were investigated at the RNAseq level to stratify an in-house cohort of macrodissected HGSOC FFPE samples to derive overall and disease-free survival and identify specific transcriptional alterations of the two tumor subtypes, both by classical differential expression and weighted correlation network analysis. We translated our strategy to published datasets and verified the co-occurrence of previously described molecular classification of HGSOC. We performed cytokine analysis coupled to immune phenotyping to verify alterations in the immune compartment associated with HGSOC. We identified genes that are both differentially expressed and methylated in the two tumor subtypes, concentrating on PAX8 as a bona fide marker of FI-like HGSOC.

Results: We show that: - OriPrint is a robust DNA methylation tracer that exposes the tissue of origin of HGSOC. - The tissue of origin of HGSOC is the main determinant of DNA methylation variance in HGSOC. - The tissue of origin is a prognostic factor for HGSOC patients. - FI-like and OSE-like HGSOC are endowed with specific transcriptional alterations that impact patients' prognosis. - OSE-like tumors present a more invasive and immunomodulatory phenotype, compatible with its worse prognostic impact. - Among genes that are differentially expressed and regulated in FI-like and OSE-like HGSOC, PAX8 is a bona fide marker of FI-like tumors.

Conclusions: Through an integrated approach, our work demonstrates that both FI and OSE are possible origins for human HGSOC, whose derived subtypes are both molecularly and clinically distinct. These results will help define a new roadmap towards rational, subtype-specific therapeutic inroads and improved patients' care.


Conflict of interest statement

Dr. Pasquale Laise is Director of Single-Cell Systems Biology at DarwinHealth, Inc., New York, NY, USA. The remaining authors declare that they have no competing interests.

Figures

Fig. 1
Fig. 1
OriPrint is able to stratify HGSOC on the basis of its cell of origin. a Schematic representation of the experimental pipeline. FI, fimbrial epithelium; OSE, ovarian surface epithelium; HGSOC high-grade serous ovarian cancer; FI-like, tumors originating from the fimbrial epithelium; OSE-like, tumors originating from the ovarian surface epithelium. b Top: PCA analysis of FI and OSE samples (n = 11 and 8, respectively) from the IEO cohort (purple and orange, respectively) considering ORIPrint CpGs. Bottom: Hierarchical clustering of the same samples, distance = Pearson’s correlation. c Top: PCA analysis of FI and OSE samples (tones of purple and orange, respectively) from IEO, Omaha (n = 5 and 5, respectively) and Melbourne (n = 6 FI) cohorts considering OriPrint CpGs in the space defined by normal samples. Bottom: Hierarchical clustering of the same samples, distance = Pearson’s correlation. d PCA analysis of normal and tumor samples (n = 24) from the IEO cohort, annotated using Pearson’s correlation-based classification in the space defined by normal samples. e PCA analysis of normal samples from IEO cohort and tumor samples from the Melbourne cohort (n = 85), annotated using Pearson’s correlation-based classification both in the space defined by OriPrint and normal samples (left) and by the whole set of CpGs (right)
Fig. 2
Fig. 2
OriPrint is a solid stratifier and establishes the tissue of origin as a major source of variance for HGSOC. a Diffusion map with pseudotime timeline performed on OriPrint CpGs for samples of all cohorts. The origin is situated either in the distal FI (purple origin) or OSE (orange origin) samples. b Diffusion maps showing the classification output for the three indicated clustering methods. The overlap plot shows in white the samples that are concordantly classified by all three methods and in green the samples that have a different classification in at least one of the three methods. c PCA analysis coupled to Gaussian Mixture Model (GMM) clustering of the Melbourne tumor cohort. Left: First two components of global variance in DNA methylation for the considered samples. Middle: The two probability distributions calculated by GMM. Right: Overlay of the OriPrint classification, showing a consistent overlap with GMM’s distributions
Fig. 3
Fig. 3
The cell of origin of HGSOC impacts the prognosis of patients independently of BRCA1/2 mutations. a Schematic representation of the strategy based on RNAseq to stratify a retrospective cohort of HGSOC. b Overall (left) and disease-free (right) survival of patients stratified by the cell of origin of HGSOC. Light-colored areas represent confidence intervals. Log rank test was used for statistical significance. c Cox’s proportional hazard model on clinical data. d Mutational status of BRCA1/2 in the retrospective cohort classified in FI-like (purple) and OSE-like (orange) tumors, shown as mutational frequency (top barplot) and contingency table (bottom). Fisher’s exact test was performed based on the contingency table. e Cumulative overall (left) and disease-free (right) survival over 5 years across the IEO, TCGA, and Tothill datasets. f Cox’s proportional hazard model on clinical data from the union of IEO, TCGA, and Tothill’s cohorts
Fig. 4
Fig. 4
Gene expression patterns of OSE-like tumors reveal a lower inflammatory response coupled to increased survivability and active cell-to-cell signaling. a IPA causal network analysis performed on WGCNA eigengenes associated with OSE-like tumors. Blue: regulator genes whose pathway is predicted to be inhibited; orange: regulator genes whose pathway is predicted to be activated; red: upregulated eigengenes; green: downregulated eigengenes. b IPA disease and function enrichment analysis on WGCNA eigengenes associated with OSE-like tumors. Enrichment p values are shown after Benjamini-Hochberg FDR correction. c Treemap of three of the categories in b. Box dimension is derived on activation z-score. Enrichment p values are shown as in b. d The inflammatory response IPA disease and function enrichment analysis category predicted to be inhibited in OSE-like vs FI-like tumors
Fig. 5
Fig. 5
OSE-like tumors have a mesenchymal, non-immunoreactive molecular phenotype. a Barplot of the mean expression levels of HGSOC molecular signatures in FI-like (purple bars) and OSE-like (orange bars) tumors. Two-way ANOVA analysis was used to calculate the significance for the difference in expression of the signature in the two groups. b Boxplot of the z-score relative to the expression of the mesenchymal (top) and immunoreactive (bottom) signatures in FI-like (purple) and OSE-like (orange) tumors. c Frequency stacked barplot for the proportion of Tothill’s molecular classes in FI-like and OSE-like tumors considering TCGA cohort (left panel) and Tothill’s cohort (right panel). The distribution in the entire considered dataset is reported on the rightmost bar of each panel (TCGA and Tothill, respectively)
Fig. 6
Fig. 6
OSE-like tumors show an immunomodulatory phenotype. a Dotplot showing the number of CD8+ cells (top panels) and CD4+ cells (bottom panels) in stromal and intratumoral regions. Mann-Whitney U test was used to derive statistical significance (*p < 0.05, **p < 0.01, ns = non-significant). b Immunohistochemistry staining for CD8 and CD4 in FI-like and OSE-like tumors. Representative pictures are shown. Red arrows: stromal positive cells. Black arrows: intratumoral positive cells. Scale bar = 100 μm. c Kaplan-Meier overall survival curves for FI-like and OSE-like affected patients, subdivided in CD8 high and low. The dashed line is set at 3-year survival. Log rank test results for significance are shown in the bottom table. d Heatmap of the level of protein expression of cytokines/chemokines segregating FI-like (purple) and OSE-like (orange) tumors. Distance = Euclidean
Fig. 7
Fig. 7
PAX8, a defining marker of HGSOC, is differentially methylated and expressed in FI-like vs. OSE-like tumors. a Graphical representation of the methylation of CpGs in PAX8 promoter across the indicated sample groups. b Dotplot depicting the gene expression level of PAX8 by RNAseq (blue bars, left Y-axis) and the DNA methylation level of its promoter by array (orange bars, right Y-axis) in the considered categories. The table summarizes the results of Mann-Whitney U tests (two-tailed) performed in the indicated comparisons. Data are shown as mean ± standard deviation. c PAX8 IHC performed on a tissue microarray of FFPE HGSOC. Samples were divided according to staining intensity. FI-like and OSE-like tumors were compared for the enrichment in the indicated categories by chi-square testing. d Dotplot depicting the DNA methylation level of PAX8 promoter in TCGA samples stratified as FI-like and OSE-like tumors. Mann-Whitney U test (two-tailed) for significance

References

    1. Bray F, Ferlay J, Soerjomataram I, Siegel RL, Torre LA, Jemal A. Global cancer statistics 2018: GLOBOCAN estimates of incidence and mortality worldwide for 36 cancers in 185 countries. CA Cancer J Clin. 2018;68(6):394–424. doi: 10.3322/caac.21492. - DOI - PubMed
    1. Reid BM, Permuth JB, Sellers TA. Epidemiology of ovarian cancer: a review. Cancer Biol Med. 2017;14(1):9–32. doi: 10.20892/j.issn.2095-3941.2016.0084. - DOI - PMC - PubMed
    1. Vaughan S, Coward JI, Bast RC, Berchuck A, Berek JS, Brenton JD, et al. Rethinking ovarian cancer: recommendations for improving outcomes. Nat Rev Cancer. 2011;11(10):719–725. doi: 10.1038/nrc3144. - DOI - PMC - PubMed
    1. Bowtell DD, Böhm S, Ahmed AA, Aspuria P-J, Bast RC, Beral V, et al. Rethinking ovarian cancer II: reducing mortality from high-grade serous ovarian cancer. Nat Rev Cancer. 2015;15(11):668–679. doi: 10.1038/nrc4019. - DOI - PMC - PubMed
    1. Klotz DM, Wimberger P. Cells of origin of ovarian cancer: ovarian surface epithelium or fallopian tube? Arch Gynecol Obstet. 2017;296(6):1055–1062. doi: 10.1007/s00404-017-4529-z. - DOI - PubMed

Publication types