. 2020 Dec 1;34(23-24):1619-1636.
doi: 10.1101/gad.337287.120. Epub 2020 Oct 29.

Replication stress conferred by POT1 dysfunction promotes telomere relocalization to the nuclear pore

Affiliations

Replication stress conferred by POT1 dysfunction promotes telomere relocalization to the nuclear pore

Alexandra M Pinzaru et al. Genes Dev. .

Abstract

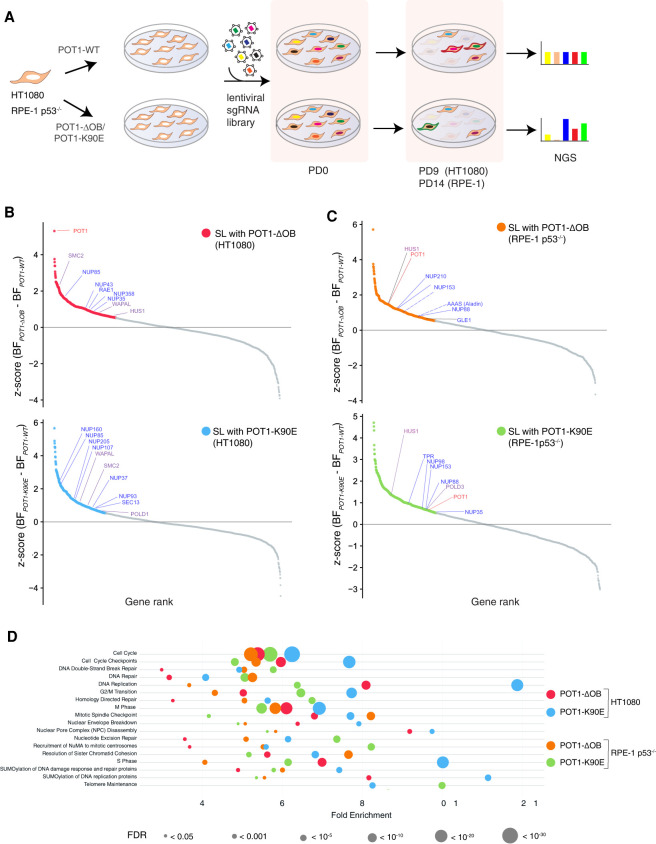
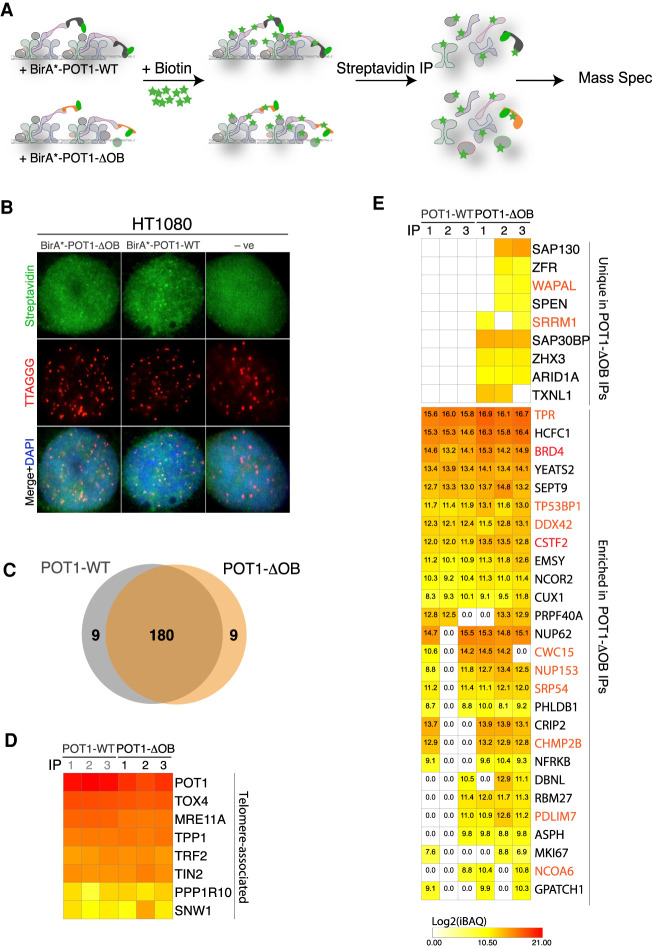
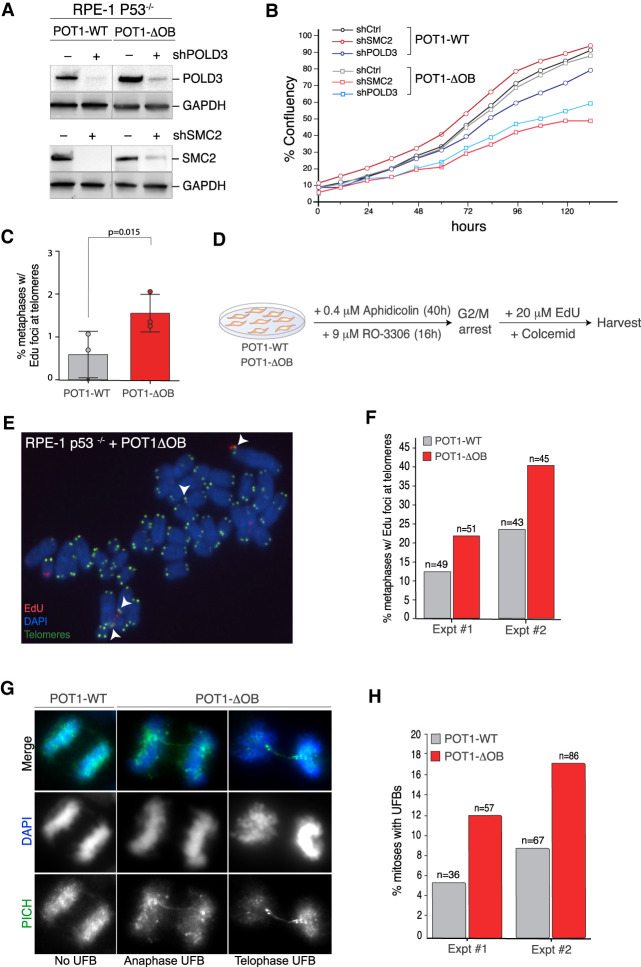
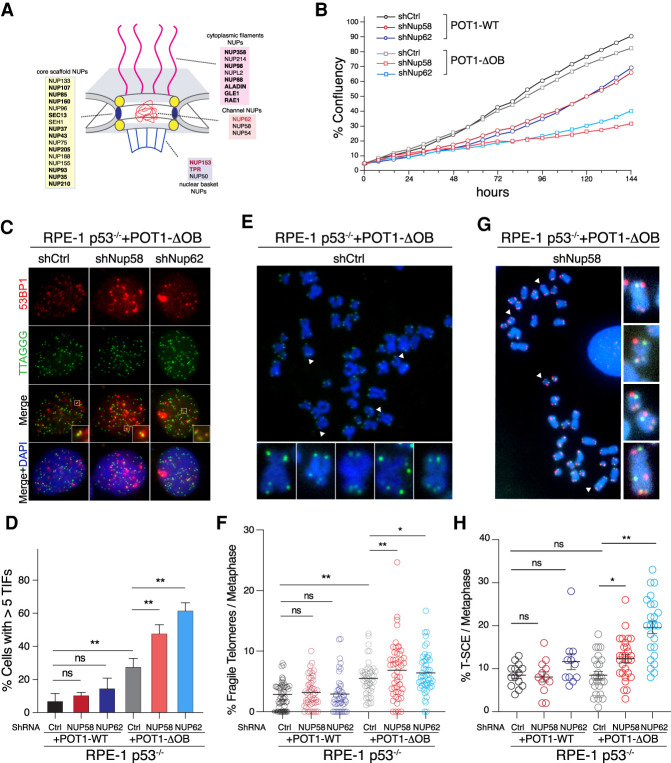
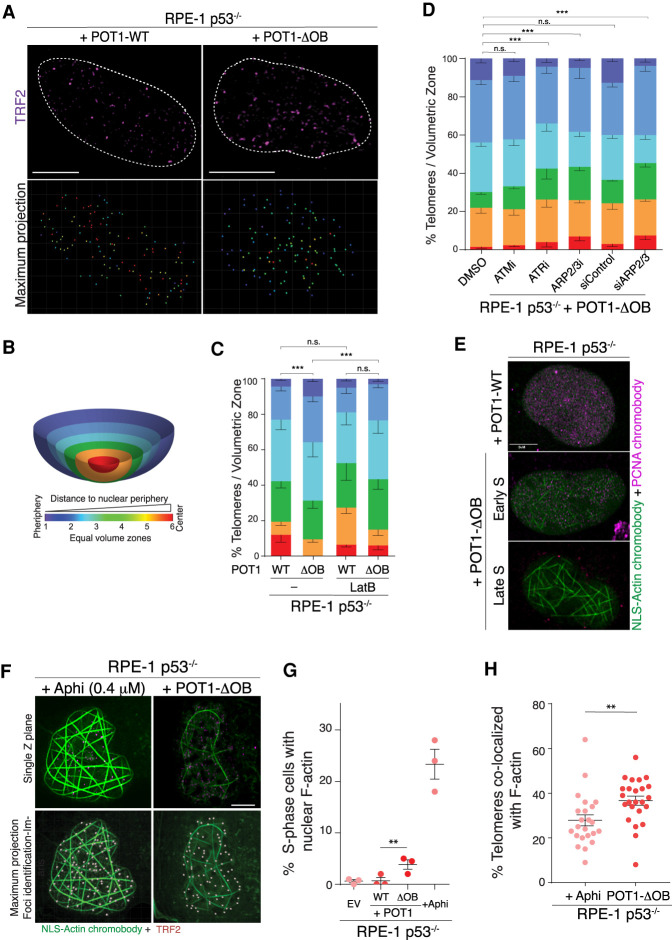
Mutations in the telomere-binding protein POT1 are associated with solid tumors and leukemias. POT1 alterations cause rapid telomere elongation, ATR kinase activation, telomere fragility, and accelerated tumor development. Here, we define the impact of mutant POT1 alleles through complementary genetic and proteomic approaches based on CRISPR interference and biotin-based proximity labeling, respectively. These screens reveal that replication stress is a major vulnerability in cells expressing mutant POT1, which manifests as increased telomere mitotic DNA synthesis at telomeres. Our study also unveils a role for the nuclear pore complex in resolving replication defects at telomeres. Depletion of nuclear pore complex subunits in the context of POT1 dysfunction increases DNA damage signaling, telomere fragility and sister chromatid exchanges. Furthermore, we observed telomere repositioning to the nuclear periphery driven by nuclear F-actin polymerization in cells with POT1 mutations. In conclusion, our study establishes that relocalization of dysfunctional telomeres to the nuclear periphery is critical to preserve telomere repeat integrity.

Keywords: CRISPRi; MiDAS; POT1; nuclear F-actin; nuclear periphery; nuclear pore; replication stress; telomeres.


Figures

Figure 1.
Figure 1.
CRISPR interference screens identify synthetic lethalities in cells expressing POT1 mutations. (A) Schematic of the CRIPSRi screening pipeline. HT1080 and RPE-1 p53−/− cells stably expressing dCas9-KRAB, as well as POT1-WT, POT1-ΔOB, and POT1-K90E, were transduced with the genome-wide hCRISPRi v2.1 sgRNA library (Horlbeck et al. 2016). Cells were collected following the selection of sgRNA-expressing cells and designated population doubling (PD) 0. Cells were also collected after approximately nine PDs and ∼14 PDs for HT1080 and RPE-1 p53−/− cells, respectively. The relative change in sgRNA abundance at the time of final collection compared with PD0 was determined by next-generation sequencing (NGS). (B) Ranked z-scores of the difference in Bayes factor (BF) scores for “essential” genes in POT1-ΔOB versus POT1-WT (top) and POT1-K90E vs. POT1-WT (bottom) in HT1080 cells. BF scores were determined using the BAGEL analysis pipeline (Hart and Moffat 2016). Genes with a z-score ≥0.53 were considered to be potentially synthetic lethal (SL) with mutant POT1. SL candidates are marked in red for POT1-ΔOB and in blue for POT1-K90E. (C) Similar analysis as in B for RPE-1 p53−/− cells. SL candidates are marked in orange for POT1-ΔOB and in green for POT1-K90E. (B,C) Selected SL candidate genes highlighted in blue depict nucleoporins (NUPs), purple denotes mitotic DNA synthesis (MiDAS), and general replication stress-related genes, and POT1 is highlighted in red. (D) Reactome pathway overrepresentation analysis of synthetic lethal genes with mutant POT1. The analysis was performed using PANTHER classification (v. 14.1). Fold enrichment of each pathway is plotted on the X-axis. The false discovery rate (FDR) associated with the fold enrichment is indicated by the size of the circle (the lower the FDR, the larger the circle size).
Figure 2.
Figure 2.
Proteomic analysis of the telomere interactome in cells expressing a POT1 OB-fold mutation. (A) Schematic of the biotin ligase (BirA*) purification scheme to characterize the telomere proteome in cells expressing BirA*-POT1-WT and BirA*-POT1-ΔOB. BirA* covalently attaches biotin to lysine residues on vicinal proteins. Labeled proteins are recovered by streptavidin immunoprecipitation (IP) and identified using liquid chromatography–mass spectrometry. IPs were performed in triplicate for each POT1 variant. (B) Indirect immunofluorescence (IF) for streptavidin (green) coupled with fluorescence in situ hybridization for telomeres (FISH) (red) in HT0180 cells with the indicated treatment and following overnight incubation with excess biotin. Cells expressing an empty vector were used as negative control for the staining. (C) Venn diagram of the overlap between POT1-WT and POT1-ΔOB hits identified in two or more IPs. (D) Heat map of the log2 transformed intensity-based absolute quantification (iBAQ) values for telomere-associated proteins recovered in cells expressing BirA*-POT1-WT or BirA*-POT1-ΔOB. n = 3 independent IPs. (E) Heat map of the log2 transformed iBAQ values of proteins enriched at telomeres in POT1-ΔOB cells. (Top) Proteins uniquely present in two or more IPs in POT1-ΔOB-expressing cells. (Bottom) iBAQ values for proteins with ≥50% enrichment (≥0.6 in log2) in two or more IPs in cells expressing POT1-ΔOB compared with those expressing POT1-WT. Values were compared in a paired manner (i.e., IP#1 for POT1-WT with IP#1 for POT1-ΔOB). Highlighted in red are enriched proteins that have been identified as SL candidates in the genome-wide screen (Supplemental Table S1).
Figure 3.
Figure 3.
POT1 dysfunction triggers mitotic DNA synthesis (MiDAS) at telomeres. (A,B) Validation of growth defects upon inhibition of MiDAS factors, SMC2 and POLD3, in cells expressing mutant POT1. (A) Western blot analysis for POLD3 and SMC2 in cells with the indicated treatment. (B) Graph depicting cellular growth monitored in real time by Incucyte in the indicated cells. (C) Analysis of MiDAS in asynchronous HT1080 cells expressing POT1-WT and POT1-ΔOB. Quantification of the number of metaphases with EdU foci at telomeres from asynchronous cells. Mean ± SD of three independent experiments (n = 634 metaphases for POT1-WT and 597 for POT1-ΔOB): Student's t-test, paired, and one-tailed. (D) Setup of MiDAS experiment in RPE-1 p53−/− cells expressing POT1-WT and POT1-ΔOB. Cells were treated with aphidicolin (0.4 µM) for 40 h and with Cdk1 inhibitor RO-3306 (9 µM) during the last 16h of the aphidicolin treatment. Following release from the G2/M block, cells were incubated with 20 µM EdU and Colcemid for 50–60 min, before metaphases were harvested. (E,F) Analysis of mitotic DNA synthesis (MiDAS) in RPE-1 p53−/− cells exogenously expressing POT1-WT and POT1-ΔOB following the treatment as in D. (E) Representative image of EdU incorporation at telomeres; arrowheads point to EdU foci at telomeres. (F) Quantification of the number of metaphases with EdU incorporation at telomeres; two independent experiments. (G,H) Analysis of ultrafine DNA bridges (UFBs) in U2OS cells exogenously expressing POT1-WT and POT1-ΔOB. (G) Representative images of mitotic UFBs detected by indirect immunofluorescence for PICH (green); DNA is stained with DAPI in blue. (H) Quantification of PICH UFBs in two independent experiments (total n > 100 mitoses for each condition).
Figure 4.
Figure 4.
The NUP62 subcomplex is necessary to maintain telomere integrity in cells carrying mutant POT1. (A) Schematic of the nuclear pore complex in mammalian cells (Kabachinski and Schwartz 2015). Highlighted in bold are SL hits with POT1 mutants and in red are nucleoporins (NUPs) enriched in the POT1-ΔOB BioID IPs. NUP153 and TPR were hits in both screens. (B) Incucyte growth analysis of RPE-1 p53−/− cells expressing POT1-WT and POT1-ΔOB, treated with shRNAs against NUP62, NUP58, and scramble control. Cell proliferation was monitored over 160h. Graph representing data from two independent experiments. (C) Representative images displaying telomere dysfunction-induced foci (TIFs) in RPE-1 p53−/− cells expressing POT1-ΔOB and treated with shRNAs against NUP58 and NUP62, as well as control shRNA. 53BP1 in red is detected by indirect immunofluorescence, and telomeres are marked with FISH in green. DNA is counterstained with DAPI in blue. (D) Quantification of the percentage of cells with five or more TIFs in RPE-1 p53−/− cells with the indicated treatment. Graph represents the mean of n = 3 independent experiments with SD (two-tailed t-test). (E,F) Analysis of telomere fragility in RPE-1 p53−/− cells expressing POT1-WT and POT1-ΔOB and treated with the indicated shRNA. (E) Representative images showing metaphase chromosomes from POT1-ΔOB cells with fragile telomeres. Arrowheads indicate examples of fragile telomeres on the metaphase. Telomeres were stained with FISH in green, while DNA is detected with DAPI in blue. (F) Quantification of fragile telomeres per metaphase in cells with the indicated treatments. Graph represents mean of four independent experiments (n > 40 metaphase per condition) with SD (one-way ANOVA test). (G,H) Telomere sister chromatid exchange (T-SCE) analysis in cells with the indicated treatment. (G) Image depicting metaphase chromosomes with T-SCE events (white arrows). Telomeres were stained with FISH in green and red and DNA is counterstained with DAPI in blue. (H) Quantification of T-SCE events per metaphase in the indicated cells (n > 15 metaphases per condition).
Figure 5.
Figure 5.
Nuclear F-actin polymerization in POT1-ΔOB cells facilitates the relocalization of telomeres to the nuclear periphery. (A) Representative superresolution microscopy of a three-dimensional (3D) image through the nuclear volume of fixed RPE-1 p53−/− cells expressing POT1-WT and POT1-ΔOB. S-phase cells were marked with PCNA (not shown) and telomeres detected with an anti-TRF2 antibody in magenta. The top image is a single z-plane through the nuclear center. The bottom image is a maximum projection rendering of all telomeres with their distance from the nuclear edge color coded. (B) Telomeres were identified throughout the nuclear volume and their distance to the nuclear periphery calculated using the Imaris 8.4.1 software. DAPI was used to segment nuclei into six equal volume zones from nuclear center to the periphery and each telomere assigned to the corresponding zone. The zone for each telomere relative to the nuclear periphery is identified via color coding. (C) Quantification of telomere localization in the nucleus of cells imaged in A, in the absence or presence of 0.2 µM Latrunculin B (LatB) treatment (24 h prior to fixation). Graph represents distribution of telomeres with respect to the nuclear periphery. Mean ± SEM (χ2 test). n ≥ 1805 telomeres from >19 nuclei and three independent experiments. (D) Quantification of telomere localization in the nucleus of cells with the indicated treatment. Graph represents distribution of telomeres with respect to the nuclear periphery. Mean ± SEM (χ2 test). n ≥ 6004 telomeres from >63 nuclei and three independent experiments. (E) Representative superresolution microscopy of single Z-planes taken from 3D images through the nuclear volume of fixed RPE-1 p53−/− cells expressing POT1-WT and POT1-ΔOB. Cells were transfected with NLS-GFP-Actin and Tag-RFP-PCNA chromobodies 48 h prior to fixation. (F) Representative superresolution microscopy of 3D images through the nuclear volume of fixed parental RPE-1 p53−/− cells and cells expressing POT1-ΔOB. Cells were transfected with an NLS-GFP-Actin chromobody 48 h prior to fixation and telomeres were detected with an anti-TRF2 antibody. Parental cells were treated with 0.4 µM aphidicolin for 24 h prior to fixation. (G) Quantification of filamentous-actin (F-actin) positive S-phase nuclei from the images depicted in E. Each data point represents an individual biological replicate. n = 3 independent experiments with >168 nuclei analyzed per experiment. SEM with Fisher's exact test. (H) Quantification of the percentage of telomeres that colocalized with nuclear F-actin in experiments highlighted in G. n = 3 independent experiments with >23 nuclei and >1656 telomeres. SEM with Mann–Whitney test. (**) P < 0.001; (***) P < 0.0005. Scale bar, 5 µm.

References

    1. Bainbridge MN, Armstrong GN, Gramatges MM, Bertuch AA, Jhangiani SN, Doddapaneni H, Lewis L, Tombrello J, Tsavachidis S, Liu Y, et al. 2015. Germline mutations in shelterin complex genes are associated with familial glioma. J Natl Cancer Inst 107: 384 10.1093/jnci/dju384 - DOI - PMC - PubMed
    1. Barefield C, Karlseder J. 2012. The BLM helicase contributes to telomere maintenance through processing of late-replicating intermediate structures. Nucleic Acids Res 40: 7358–7367. 10.1093/nar/gks407 - DOI - PMC - PubMed
    1. Baumann P, Cech TR. 2001. Pot1, the putative telomere end-binding protein in fission yeast and humans. Science 292: 1171–1175. 10.1126/science.1060036 - DOI - PubMed
    1. Bennett CB, Lewis LK, Karthikeyan G, Lobachev KS, Jin YH, Sterling JF, Snipe JR, Resnick MA. 2001. Genes required for ionizing radiation resistance in yeast. Nat Genet 29: 426–434. 10.1038/ng778 - DOI - PubMed
    1. Bizard AH, Nielsen CF, Hickson ID. 2018. Detection of ultrafine anaphase bridges. Methods Mol Biol 1672: 495–508. 10.1007/978-1-4939-7306-4_33 - DOI - PubMed

Publication types