. 2020 Oct 30;370(6516):eaay9097.
doi: 10.1126/science.aay9097.

Multi-omics analyses of radiation survivors identify radioprotective microbes and metabolites

Affiliations

Multi-omics analyses of radiation survivors identify radioprotective microbes and metabolites

Hao Guo et al. Science. .

Abstract

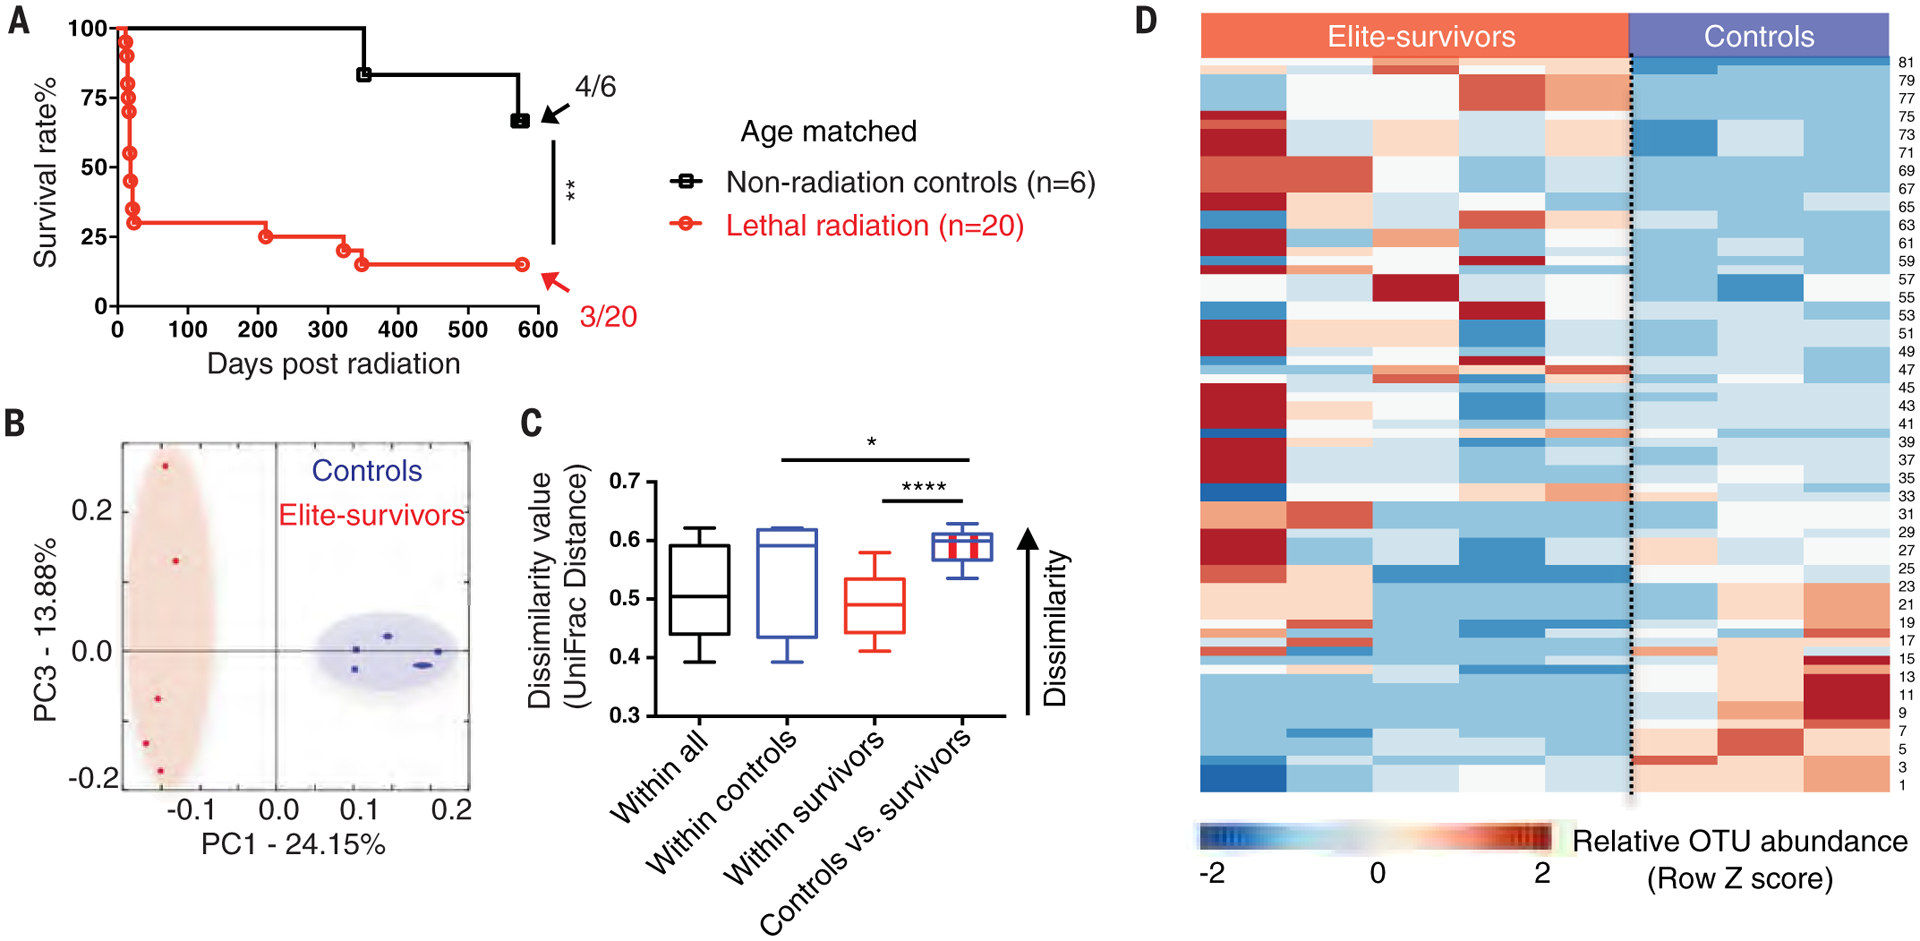
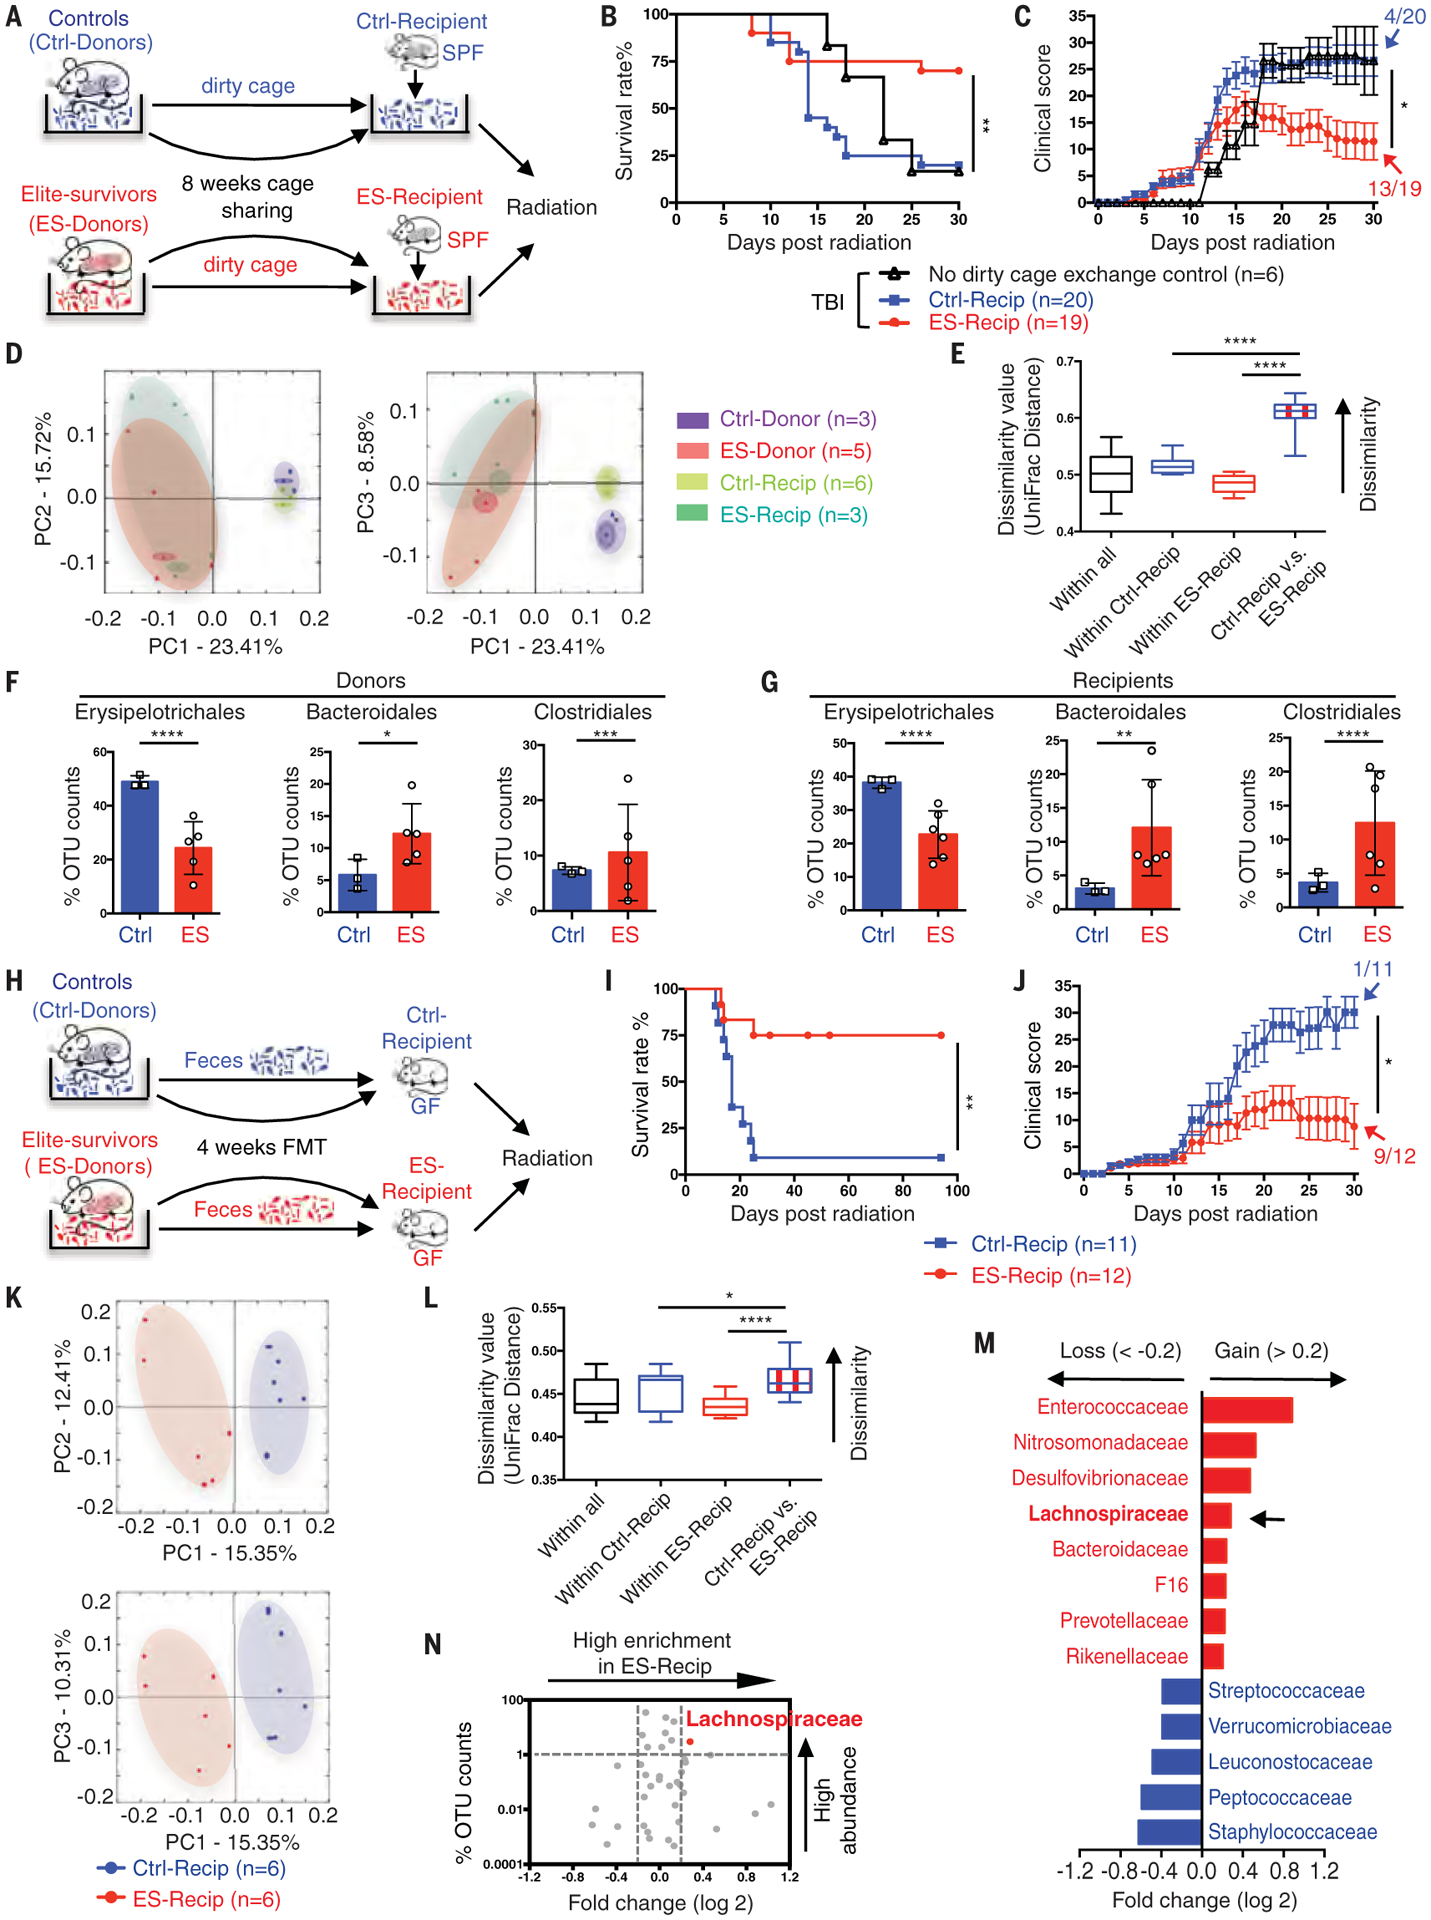
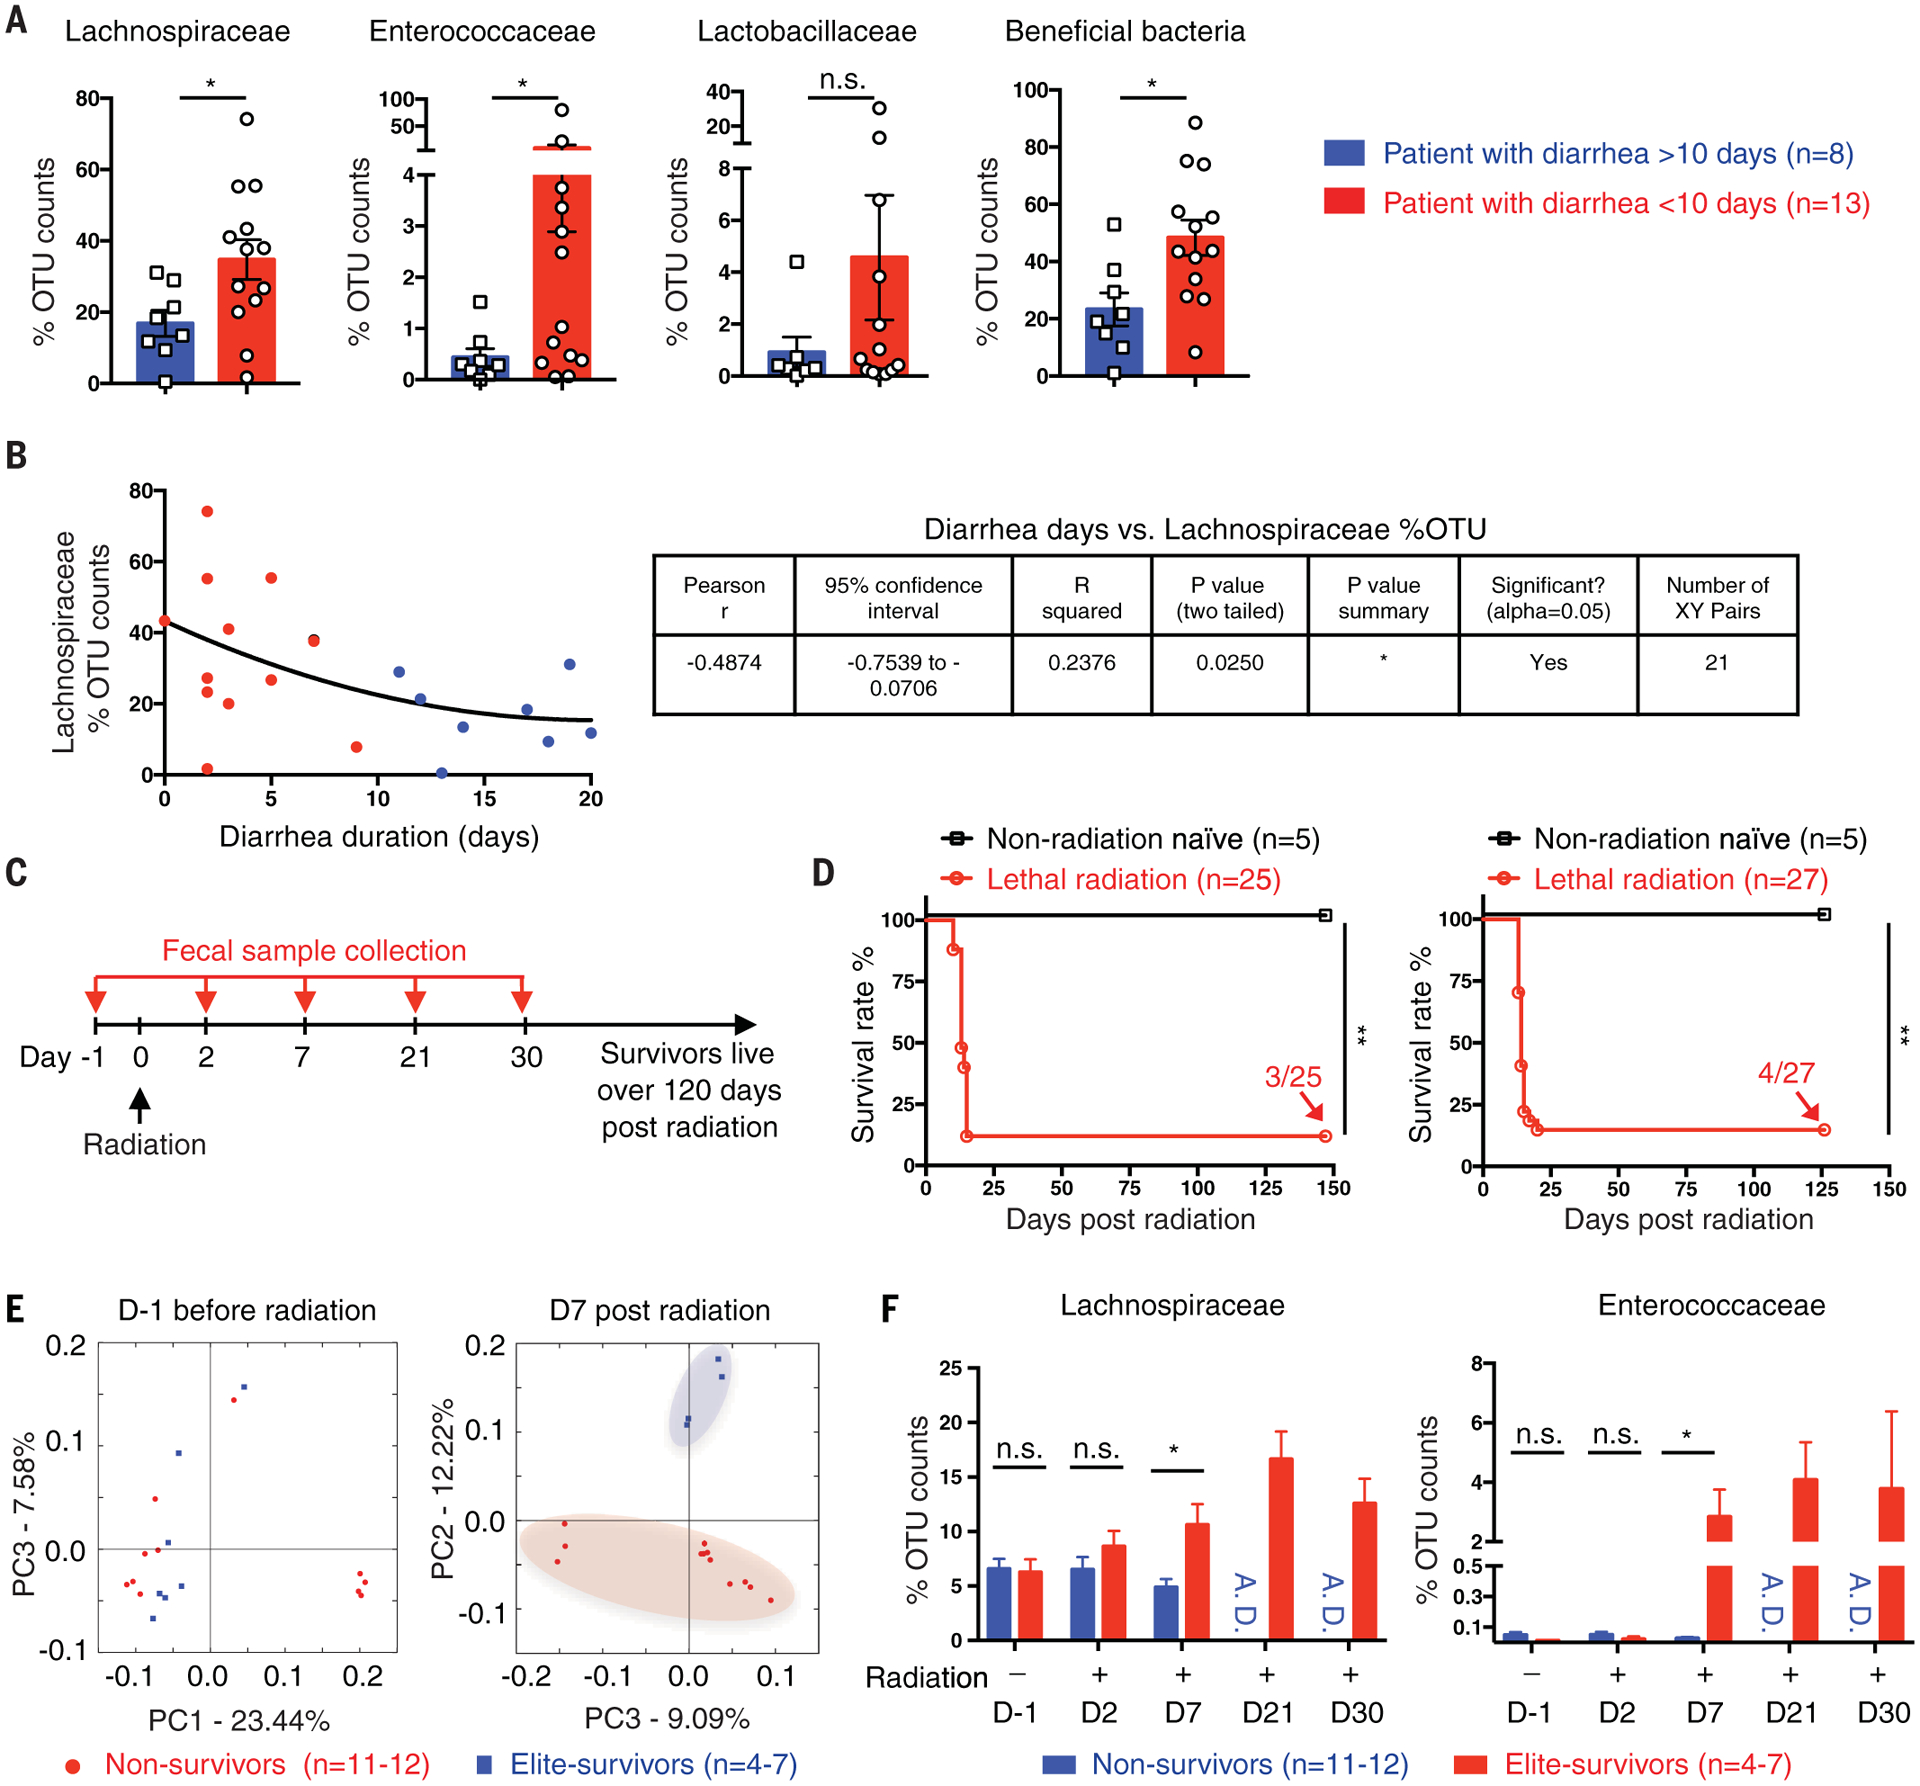
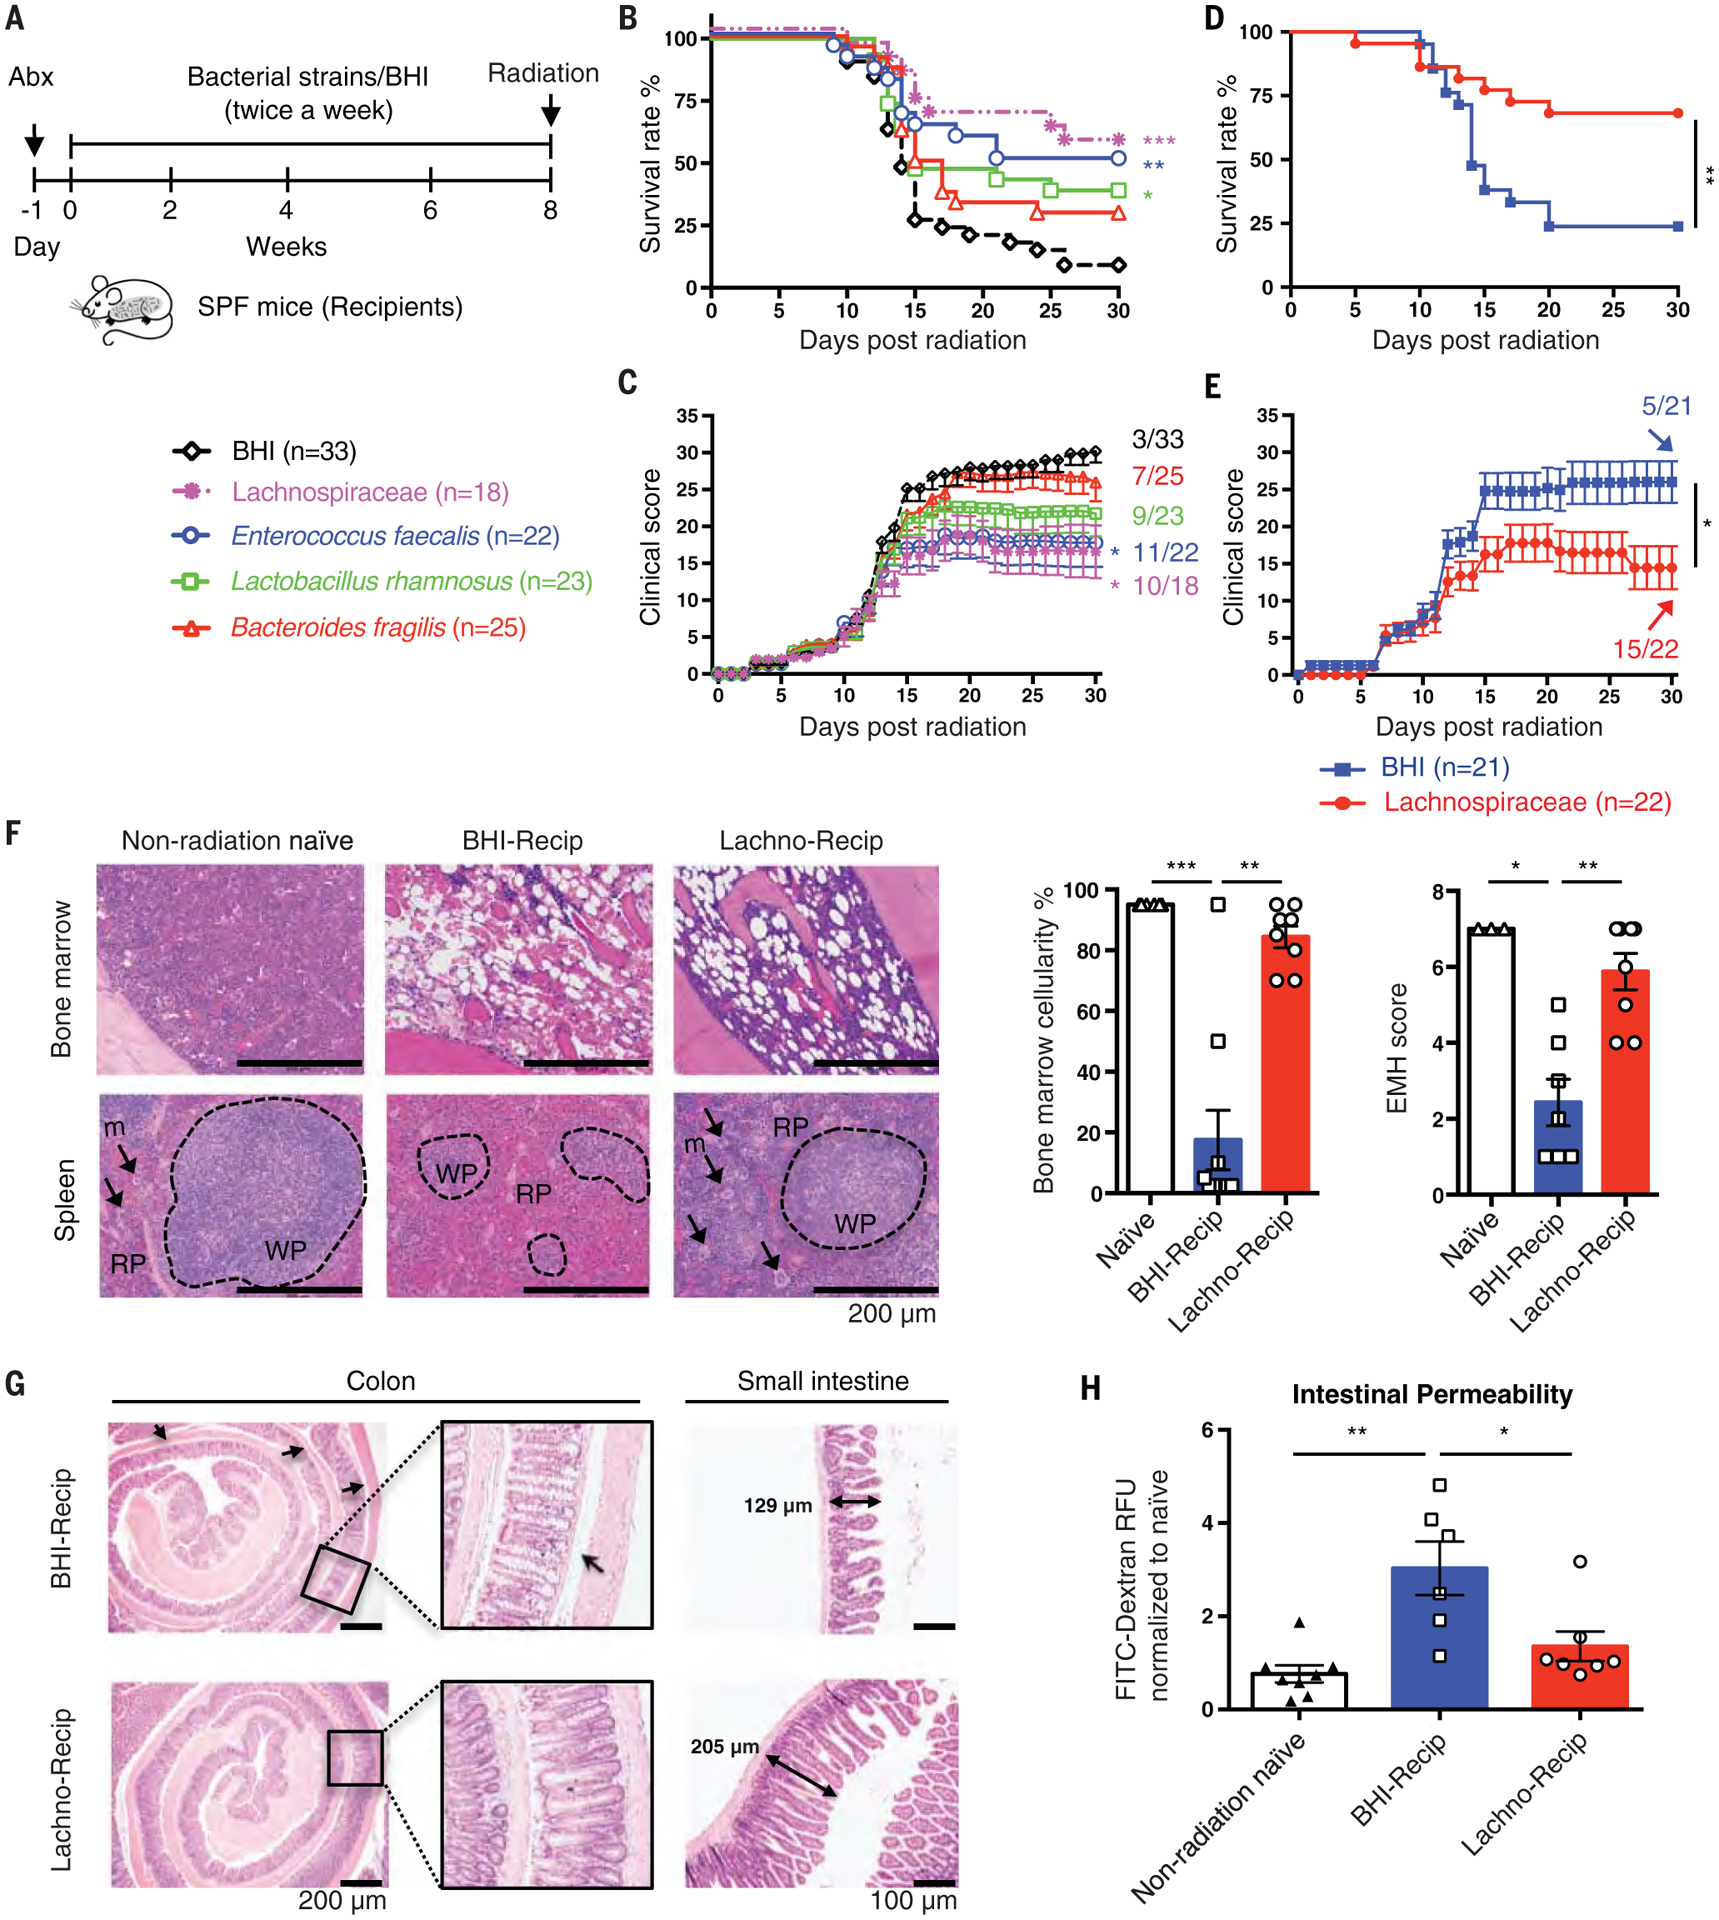
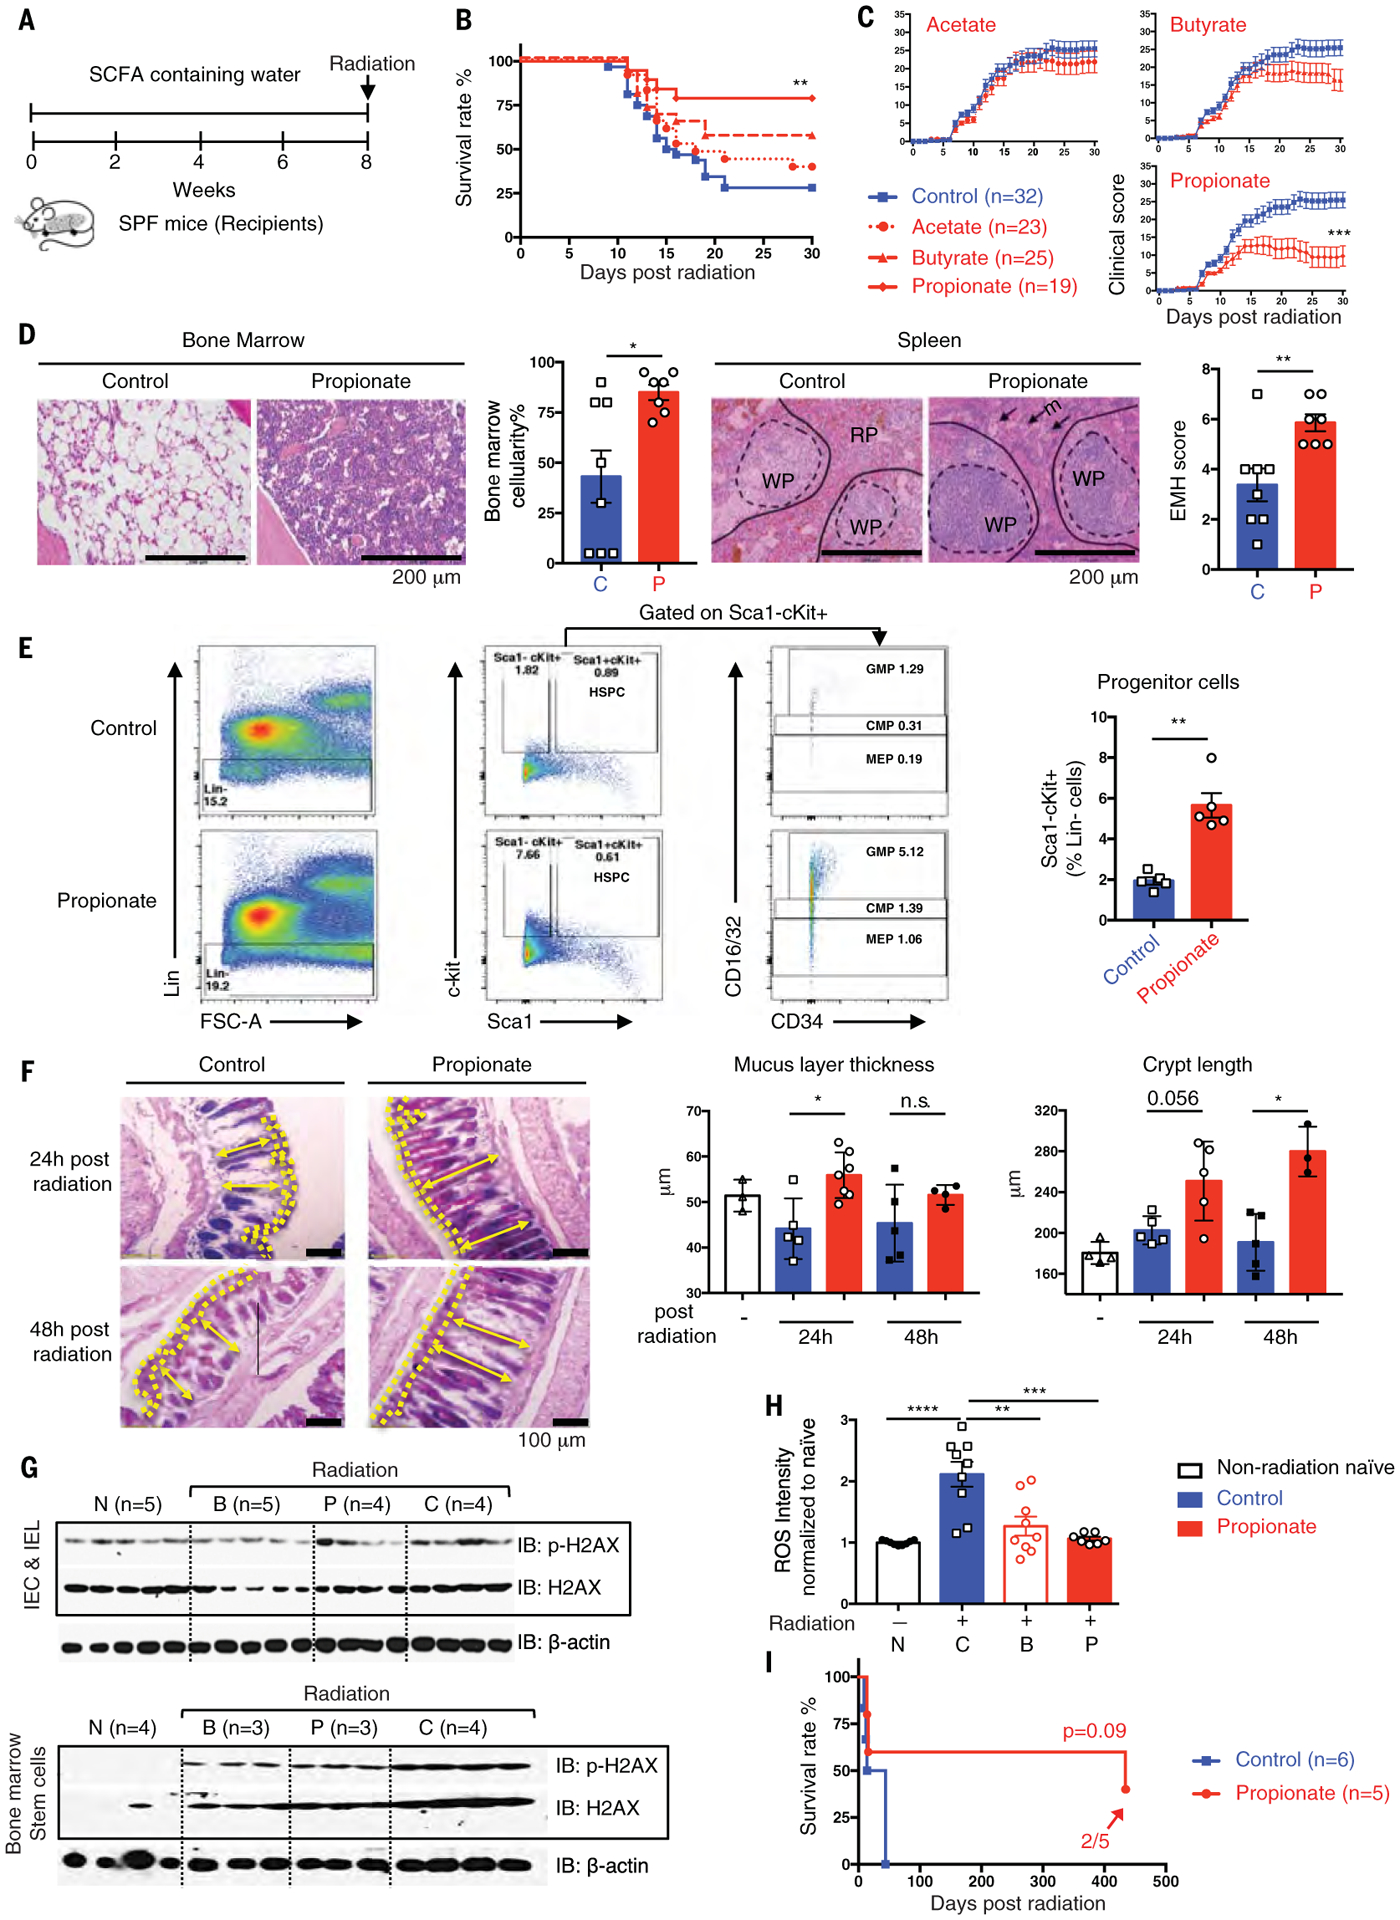
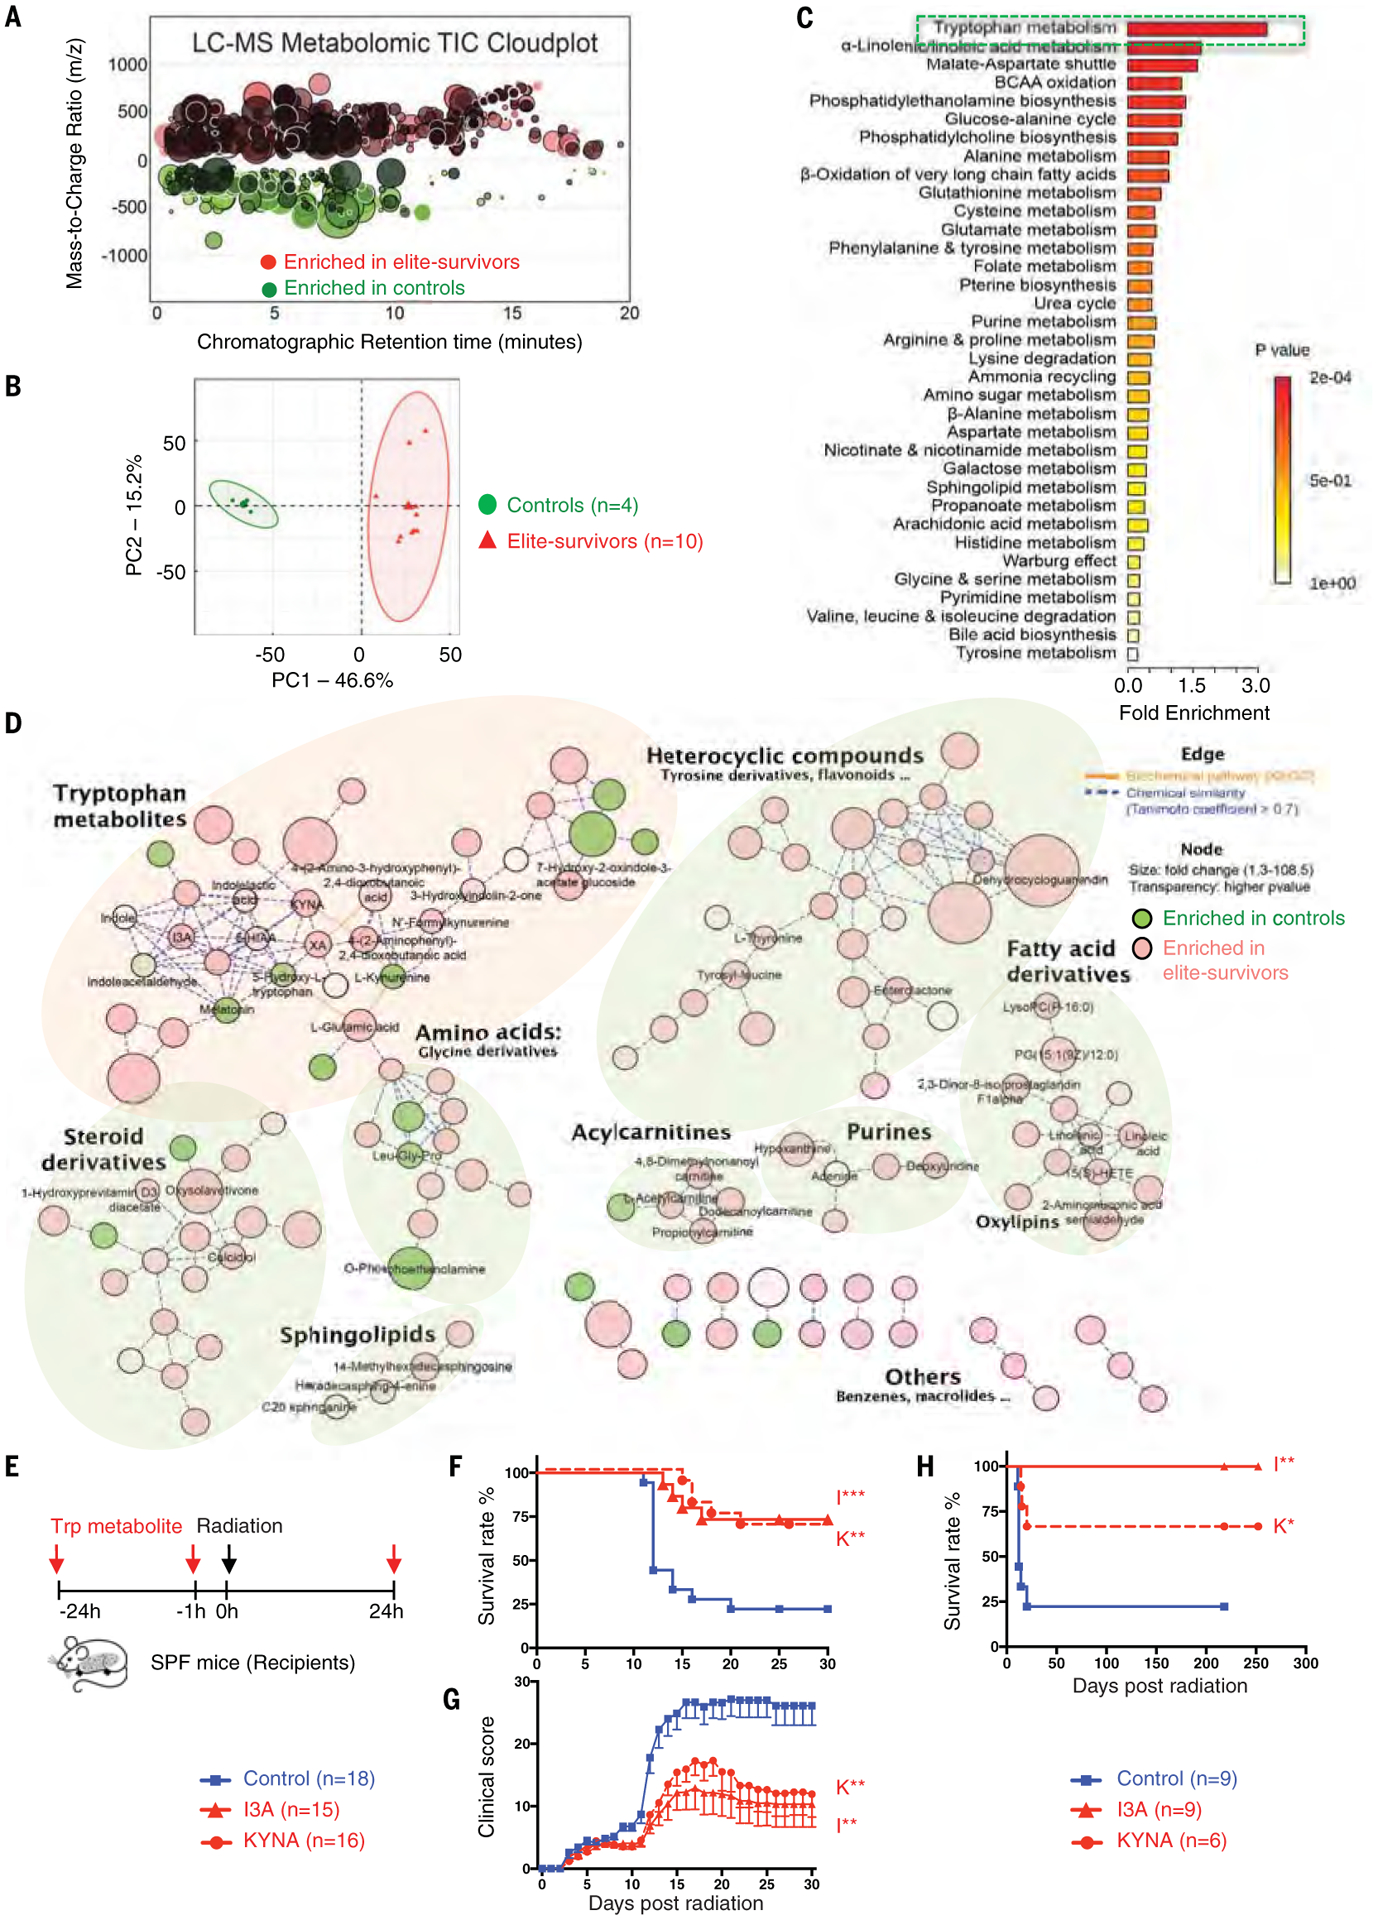
Ionizing radiation causes acute radiation syndrome, which leads to hematopoietic, gastrointestinal, and cerebrovascular injuries. We investigated a population of mice that recovered from high-dose radiation to live normal life spans. These "elite-survivors" harbored distinct gut microbiota that developed after radiation and protected against radiation-induced damage and death in both germ-free and conventionally housed recipients. Elevated abundances of members of the bacterial taxa Lachnospiraceae and Enterococcaceae were associated with postradiation restoration of hematopoiesis and gastrointestinal repair. These bacteria were also found to be more abundant in leukemia patients undergoing radiotherapy, who also displayed milder gastrointestinal dysfunction. In our study in mice, metabolomics revealed increased fecal concentrations of microbially derived propionate and tryptophan metabolites in elite-survivors. The administration of these metabolites caused long-term radioprotection, mitigation of hematopoietic and gastrointestinal syndromes, and a reduction in proinflammatory responses.


Conflict of interest statement

Competing interests: J.P.Y.T. is a cofounder of IMMvention Therapeutix and GoldCrest Bio. H.G. and W.J.B. hold equity shares in GoldCrest Bio. J.P.Y.T., H.G., and W.J.B. are named as inventors on U.S. Provisional Patent Application Serial No. 62/779,776: “Lachnospiraceae Mitigates Against Radiation-Induced Hematopoietic/Gastrointestinal Injury And Death, And Promotes Cancer Control By Radiation.” M.R.M.v.d.B. has received research support from Seres Therapeutics; has consulted, received honorarium from, or participated in advisory boards for Seres Therapeutics, Novartis, Evelo, Jazz Pharmaceuticals, Therakos, Amgen, Magenta Therapeutics, Merck & Co, Inc., Acute Leukemia Forum (ALF), and DKMS Medical Council (Board); has IP Licensing with Seres Therapeutics, Juno Therapeutics; and has stock options from Smart Immune. J.U.P. reports research funding, intellectual property fees, and travel reimbursement from Seres Therapeutics and consulting fees from DaVolterra.

Figures

Fig. 1.
Fig. 1.. Radiation elite-survivors harbor a distinct gut microbiota compared with age-matched controls.
(A) SPF C57BL/6 mice received a high dose of total body radiation and were monitored for >600 days. Fecal samples were collected from age-matched controls and elite-survivors at day 290 after radiation. Fractions indicate the number of mice that survived to the end of the experiment. Data are pooled from two independent experiments. (B and C) PCA plot showing microbial compositional differences (B) as quantified by UniFrac distance (C). (D) Heatmap of sequenced bacterial operational taxonomic unit (OTU) abundances. A detailed bacterial taxa list is provided in table S1. Fecal samples were collected from two independent experiments. Each symbol represents one mouse. Error bars indicate SEM, *P < 0.05, **P < 0.01, ****P < 0.0001 determined by log-rank (Mantel Cox) test (A) and Student’s t test (C).
Fig. 2.
Fig. 2.. Gut microbiota from elite-survivors protect GF and SPF recipients from radiation-induced death.
(A) Illustration of dirty cage-sharing experiment. (B and C) Survival rates (B) and clinical scores (C). Significance was found between the Ctrl-Recip and ES-Recip groups. Fecal samples were collected from recipients after 8 weeks of dirty cage sharing. (D and E) PCA plot (D) and UniFrac distance (E) of microbial composition. (F and G) Composite results of substantially changed bacterial groups were identified from donors (F) and recipients (G). (H) Illustration of FMT experiment. (I and J) Survival rates (I) and clinical scores (J). Fecal samples were collected after 4 weeks of FMT from recipients. (K and L) PCA plot (K) and UniFrac distance (L). (M) LDA effect size analysis [LDA significant threshold (log 2) > ±0.2] identified taxonomic biomarkers within recipients. Red bars, enriched within ES-Recip; blue bars, enriched within Ctrl-Recip. (N) Volcano plot displaying relative abundance distribution of microbial OTUs. x axis, log2 relative abundance; y axis, microbial OTU%. Each symbol represents one mouse or bacterial taxa (N). Fractions indicate the number of mice that survived to the end of the experiment [(C) and (J)]. Data are pooled from three [(B) and (C)] or four [(I) and (J)] independent experiments. Error bars indicate SEM, *P < 0.05, **P < 0.01, ***P < 0.001, ****P < 0.0001 determined by log-rank (Mantel Cox) test [(B) and (I)], Mann-Whitney test for area under the curve (AUC) [(C) and (J)], Student’s t test [(E) and (L)], and two-way ANOVA [(F) and (G)].
Fig. 3.
Fig. 3.. Gut microbiota is significantly associated with radioprotection both in patients and mice.
(A and B) Fecal samples were collected from 21 leukemia patients at the start of total body radiation given as a prehematopoietic stem cell transplantation conditioning. The gut microbiome was detected by 16S rRNA sequencing and compared in patients stratified by duration of diarrhea experienced. (A) Relative abundance of Lachnospiraceae, Enterococcaceae, Lactobacillaceae, or a sum of these three beneficial bacteria. (B) Correlation between diarrheal duration and Lachnospiraceae relative abundance. Blue dots, patients with diarrhea > 10 days; red dots, patients with diarrhea <10 days. (C) SPF C57BL/6 mice received a high dose of total body radiation and were monitored for >120 days. Fecal samples were collected from each single mouse at the indicated time points. Mice that survived over day 30 after radiation are referred to as elite-survivors and mice that died are referred to as nonsurvivors. (D) Survival rates (n = 25 in experiment 1 and n = 27 in experiment 2). Fractions indicate the number of mice that survived to the end of the experiment. Fecal 16S rRNA was sequenced. (E) PCA plot. (F) Lachnospiraceae and Enterococcaceae relative abundances. A.D., all mice died. Each symbol represents one patient [(A) and (B)] or one mouse [(C) to (E)]. Error bars indicate SEM, *P < 0.05, **P < 0.01 determined by Mann-Whitney test [(A) and (F)] and log-rank (Mantel Cox) test (D).
Fig. 4.
Fig. 4.. Administration of Lachnospiraceae ameliorates radiation-induced syndromes.
(A) Illustration of transfer experiments with bacteria [“Lachnospiraceae” (a mixture of 23 individual strains in the family Lachnospiraceae), E. faecalis, L. rhamnosus, and B. fragilis] compared with media control (BHI). (B and C) Survival rates (B) and clinical scores (C). Significance is shown between the BHI group and each bacteria group. (D and E) Survival rates (D) and clinical scores (E) from Lachnospiraceae transfer experiments. Fractions indicate the number of mice that survived to the end of the experiment. (F) Femurs and spleens were stained with H&E and quantified for bone marrow cellularity and spleen extramedullary hematopoiesis scores. White pulp (WP), black dashed circles; red pulp (RP), area outside of WP; megakaryocytes (m), black arrows. (G) Colons and small intestines were collected at day 1 after radiation. Arrows indicate gaps between crypt bases and muscularis mucosa. Double-headed arrows indicate the dimensions measured for villi length in small intestines. Representative histology from two independent experiments with seven to eight samples per group is shown. (H) Gut permeability was tested at day 1 after radiation. Fluorescence intensity in sera of each sample was normalized to non-radiation-naïve group average. Data are pooled from three [(B) to (E)] or two [(F) and (H)] independent experiments. Error bars indicate SEM, *P < 0.05, **P < 0.01, ***P < 0.001 determined by log-rank (Mantel Cox) test [(B) and (D)], Mann-Whitney test for AUC [(C) and (E)], and Mann-Whitney test [(F) and (H)].
Fig. 5.
Fig. 5.. Commensal-associated SCFAs suppress radiation-induced death and damage.
(A) Schematic of SCFA treatment. (B and C) Survival rates (B) and clinical scores (C). (D) Femurs and spleens were stained with H&E and quantified as described in Fig. 4F. (E) Flow cytometric analysis of hematopoietic progenitor cells from bone marrow (CMPs, LinSca1ckit+CD16/32int; GMPs, LinSca1ckit+CD16/32hi; MEPs, LinSca1ckit+CD16/32lo). (F) Representative images of AB/PAS staining in colon. Mucus layer, area between yellow dash lines; crypt length, yellow double-headed arrow. Mucus layer thickness and crypt length were quantified. (G) Intestinal epithelial cells, intestinal intraepithelial lymphocytes, and bone marrow stem cells were isolated (N, non-radiation naïve; B, butyrate; P, propionate; C, control) at 24 hours after radiation. Phosphorylated and total H2AX were detected by Western blot. (H) ROS levels in bone marrow stem cells were detected. Fluorescence intensity of each sample was normalized to non-radiation-naïve group average. (I) Long-term survival in propionate compared with control treated groups were monitored for >400 days after radiation. Fractions indicate the number of mice that survived to the end of the experiment. Data are pooled from three [(B) and (C)] or two [(D) and (H)] independent experiments or represent two independent experiments [(E) to (G)]. Error bars indicate SEM, *P < 0.05, **P < 0.01, ***P < 0.001, ****P < 0.0001 determined by log-rank (Mantel Cox) test [(B) and (I)], Mann-Whitney test for AUC (C), and Mann-Whitney test [(D), (E), (F), and (H)].
Fig. 6.
Fig. 6.. Untargeted metabolomics reveals tryptophan metabolites as potent radioprotectants.
Metabolite profiles were measured in fecal samples of elite-survivors and control mice at day 290 after total body radiation. (A and B) Total ion chromatogram metabolomic cloudplot (P < 0.01) (A) and PCA plot (B) of fecal metabolites. (C) Metabolite set enrichment analysis identified and interpreted metabolites in biochemical contexts. (D) Metabolic network integrated biochemical pathways and chemical relationships of all detected metabolites. Identified metabolites are represented by circular nodes, with lower transparency reflecting lower P values from Welch’s t test. Red nodes, metabolites with higher abundance in elite-survivors; green nodes, those higher in controls. Orange lines connecting metabolites symbolize Kyoto Encyclopedia of Genes and Genomes reactant pair links; green lines symbolize chemical similarity with a Tanimoto coefficient score >0.7. Tryptophan metabolites are highlighted by a pale pink shadow; others are distinguished by pale green shadows. (E) Schematic of tryptophan metabolite treatment. (F and G) Survival rates (F) and clinical scores (G). (H) Long-term survival in tryptophan metabolites compared with control treated groups were monitored for >200 days after radiation. Data are pooled from three [(F) and (G)] or two (H) independent experiments. Error bars indicate SEM, *P < 0.05, **P < 0.01, ***P < 0.001 determined by log-rank (Mantel Cox) test [(F) and (H)] and Mann-Whitney test for AUC (G).

Comment in

References

    1. Hauer-Jensen M, Denham JW, Andreyev HJ, Radiation enteropathy: Pathogenesis, treatment and prevention. Nat. Rev. Gastroenterol. Hepatol 11, 470–479 (2014). doi: 10.1038/nrgastro.2014.46; - DOI - PMC - PubMed
    1. Shadad AK, Sullivan FJ, Martin JD, Egan LJ, Gastrointestinal radiation injury: Prevention and treatment. World J. Gastroenterol 19, 199–208 (2013). doi: 10.3748/wjg.v19.i2.199; - DOI - PMC - PubMed
    1. Kau AL, Ahern PP, Griffin NW, Goodman AL, Gordon JI, Human nutrition, the gut microbiome and the immune system. Nature 474, 327–336 (2011). doi: 10.1038/nature10213; - DOI - PMC - PubMed
    1. Crawford PA, Gordon JI, Microbial regulation of intestinal radiosensitivity. Proc. Natl. Acad. Sci. U.S.A 102, 13254–13259 (2005). doi: 10.1073/pnas.0504830102; - DOI - PMC - PubMed
    1. Ciorba MA et al., Lactobacillus probiotic protects intestinal epithelium from radiation injury in a TLR-2/cyclo-oxygenase-2-dependent manner. Gut 61, 829–838 (2012). doi: 10.1136/gutjnl-2011-300367; - DOI - PMC - PubMed

Publication types

LinkOut - more resources