. 2020 Oct 29;10(1):18582.
doi: 10.1038/s41598-020-75657-7.

Functional in vivo and in vitro effects of 20q11.21 genetic aberrations on hPSC differentiation

Affiliations

Functional in vivo and in vitro effects of 20q11.21 genetic aberrations on hPSC differentiation

Hye-Yeong Jo et al. Sci Rep. .

Abstract

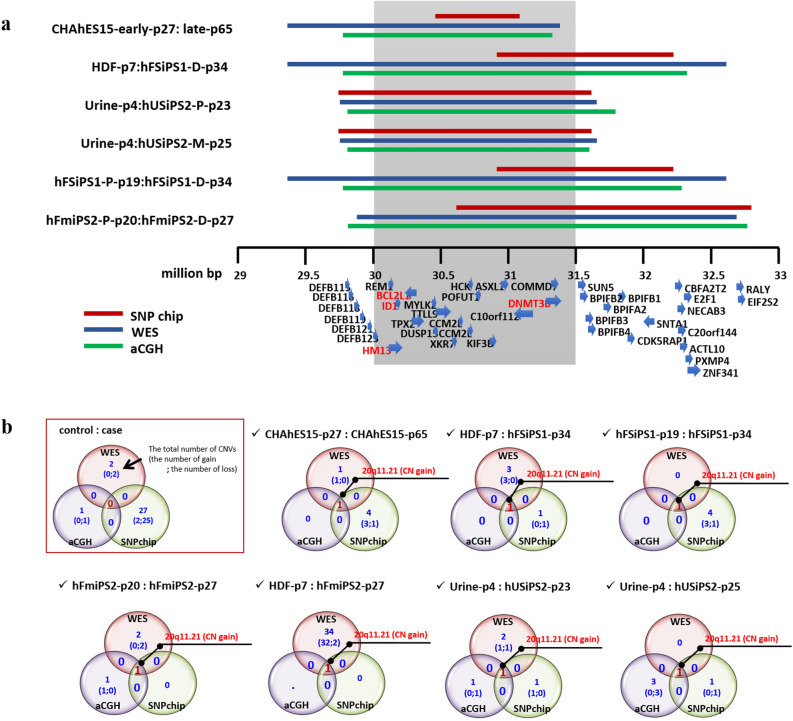
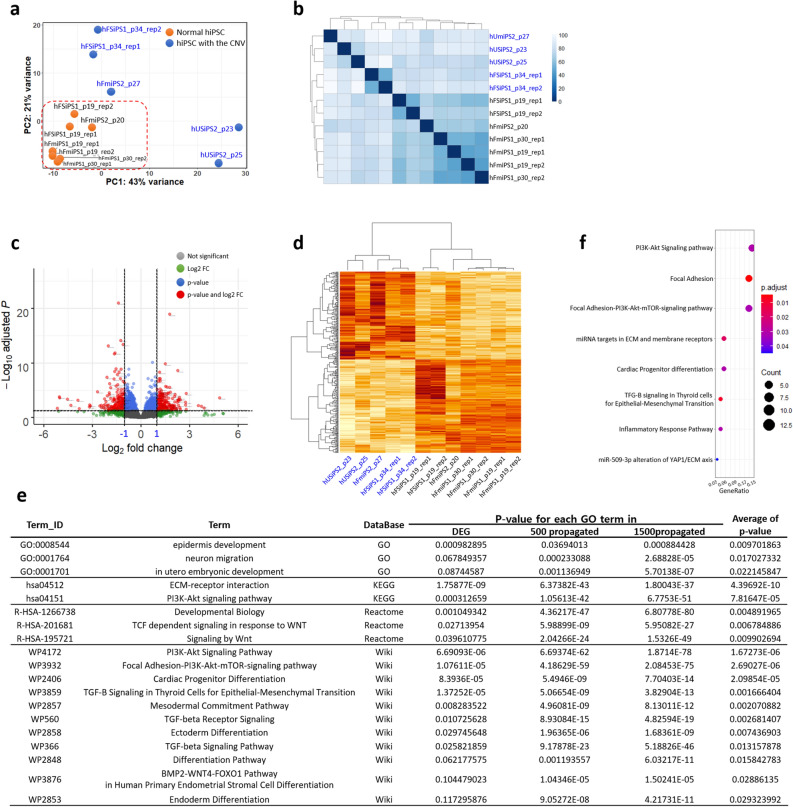
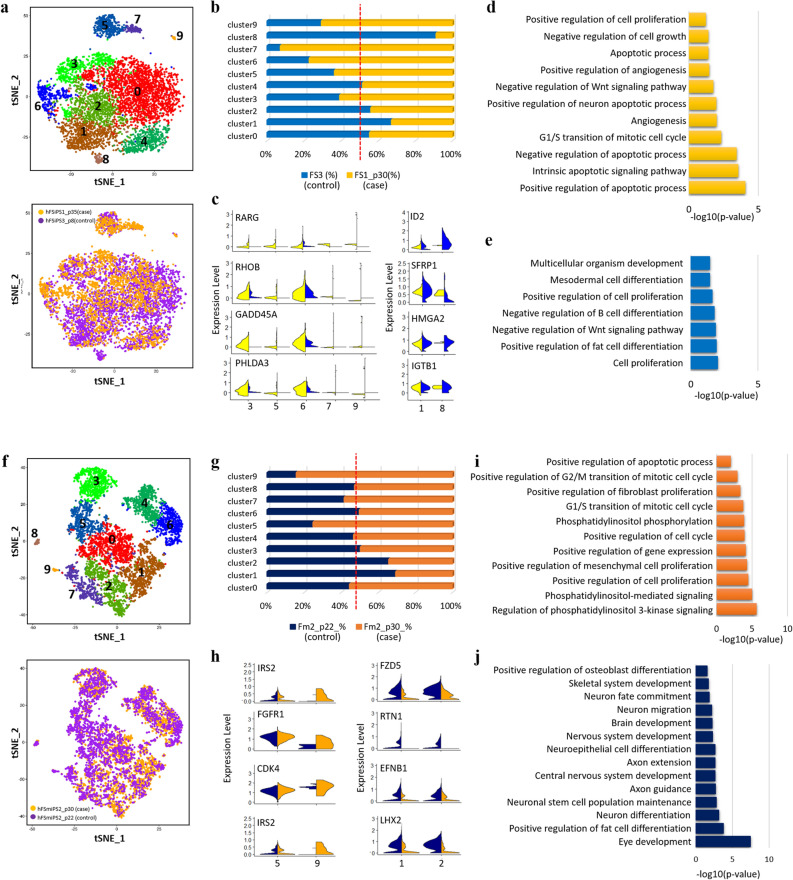
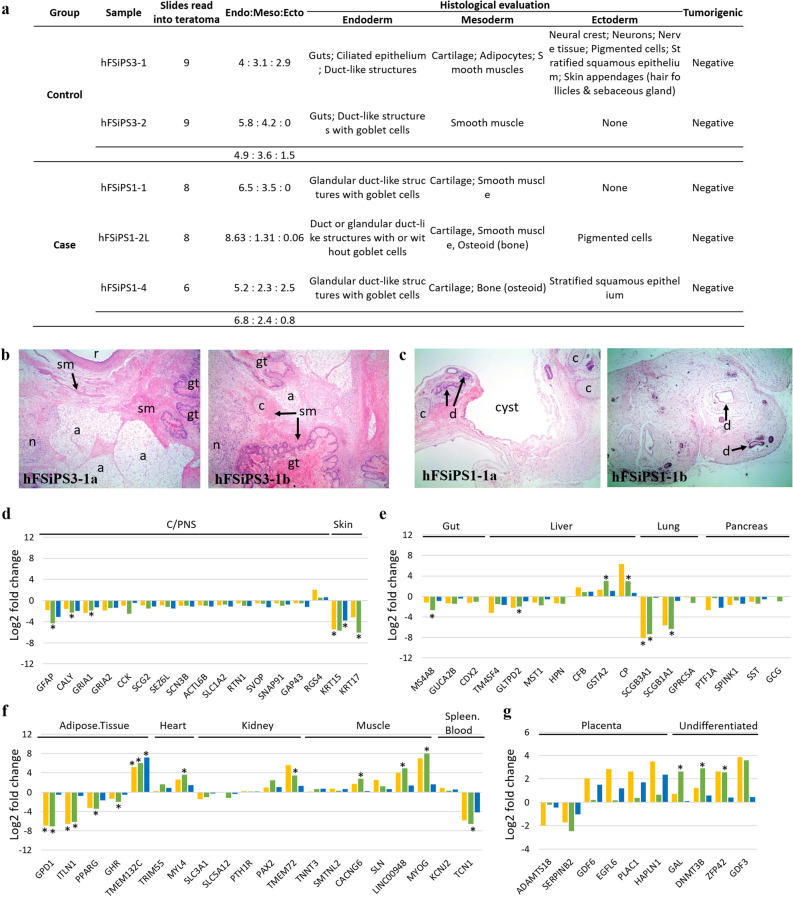
Human pluripotent stem cells (hPSCs) have promising therapeutic applications due to their infinite capacity for self-renewal and pluripotency. Genomic stability is imperative for the clinical use of hPSCs; however, copy number variation (CNV), especially recurrent CNV at 20q11.21, may contribute genomic instability of hPSCs. Furthermore, the effects of CNVs in hPSCs at the whole-transcriptome scale are poorly understood. This study aimed to examine the functional in vivo and in vitro effects of frequently detected CNVs at 20q11.21 during early-stage differentiation of hPSCs. Comprehensive transcriptome profiling of abnormal hPSCs revealed that the differential gene expression patterns had a negative effect on differentiation potential. Transcriptional heterogeneity identified by single-cell RNA sequencing (scRNA-seq) of embryoid bodies from two different isogenic lines of hPSCs revealed alterations in differentiated cell distributions compared with that of normal cells. RNA-seq analysis of 22 teratomas identified several differentially expressed lineage-specific markers in hPSCs with CNVs, consistent with the histological results of the altered ecto/meso/endodermal ratio due to CNVs. Our results suggest that CNV amplification contributes to cell proliferation, apoptosis, and cell fate specification. This work shows the functional consequences of recurrent genetic abnormalities and thereby provides evidence to support the development of cell-based applications.


Conflict of interest statement

The authors declare no competing interests.

Figures

Figure 1
Figure 1
Details of the region of recurrent CNV gain at 20q11.21 with WES, SNP array, and aCGH analyses. (a) Details of the region of recurrent CNV gain at 20q11.21. Red, blue, and green bars indicate the breakpoint of the CNV gain at 20q11.21 using SNP array, WES, and aCGH analysis, respectively. The core range, including the candidate BCL2L1, ID1, DNMT3B, and HM13 genes with strong selective advantages, is shaded in grey. This analysis was performed for control-case paired samples, showing the control: case cell lines on the left. The genes in the region of the CNV gain are specified with strand directions at the bottom. (b) Venn diagrams illustrating CNVs for paired samples from three platforms. Only pairs with CNV gain at 20q11.21 were specified. The CNV results for other paired samples are illustrated in Supplementary Fig. S2. A detailed explanation of the Venn diagrams is given in the red box.
Figure 2
Figure 2
Transcriptome profiling of hPSCs with CNV gain at 20q11.21. (a) A principal component analysis (PCA) plot for all 12 hiPSC lines from the RNA-seq data dataset is shown. Orange and blue dots indicate normal hiPSCs and hiPSCs with CNV gain, respectively. (b) Sample distance matrix and unsupervised hierarchical clustering for all samples in the expression space. This matrix was constructed with the distance between samples based on normalized expression values based on the “varianceStabilizingTransformation (vst)” method. (c) Scatterplot of the DEGs identified in this study. Significantly up- and downregulated genes are represented by red dots. Normalized count-based analysis was performed for the control and case studies. Grey, green, blue, and red dots indicate “not significant”, genes with |log2FC|≥ 1, genes with p-value > 0.05, and genes with |log2FC|≥ 2 and p-value > 0.05, respectively. (d) Heatmap and unsupervised hierarchical clustering for samples based on only DEG sets. The higher the value of the log2-fold change, the darker the red colour is. (e) Representation of GO results for 169 downregulated genes, 500 propagated genes, and 1500 propagated genes in four different GO databases, DAVID, KEGG, Reactome, and Wikipathways. The average p-value indicates the mean p-value for each GO term derived from DEG, 500 propagated genes, and 1500 propagated genes. A full list of GO results is specified in Supplementary Table S4. (f) Dot plots for significant GSEA terms of down-DEGs. Dot sizes indicate GeneRatio. GeneRatio indicates the gene counts involved in each GSEA term. Adjusted p-values represented in colour gradient ranging from red to blue, corresponding to the- increasing adjusted p-values. hiPSCs with CNV gain are represented in blue. Rep1 and rep2 indicate replicates of RNA-seq for the sample.
Figure 3
Figure 3
Transcriptional heterogeneity of EBs derived from hPSCs with CNV gain at 20q11.21. (a) tSNE plot of 6590 cells, coloured by cluster (top) and the sample origin (bottom) for hFSiPS3 (control) and hFSiPS1 (case) lines. (b) Fraction of cells in each cluster for the hFSiPS3 and hFSiPS1 lines. Blue bars indicate the proportion of the number of cells in each cluster of hFSiPS3, and yellow bars indicate those of hFSiPS1. (c) Violin plots showing the expression distribution of selected genes that are detected in higher proportions in hFSiPS1 (left, case) and in hFSiPS3 (right, control). GO results for clusters 3, 5, 6, 7, and 9 are shown in (d), and those for clusters 1 and 8 are shown in (e). (f) tSNE plot for 5850 cells, coloured by cluster (top) and the sample origin (bottom) for hFmiPS2 at p22 (control) and hFmiPS2 at 30 (case) lines. (g) Fraction of cells in each cluster for hFmiPS2 at p22 and p30. Navy bars are indicated as the proportion of the number of cells in each cluster of hFmiPS2 at p22, and orange bars are indicated as those of hFmiPS2 at p30. (h) Violin plots showing the expression distribution of selected genes that are detected in higher proportion in hFmiPS2 at p30 (left, case) and in hFmiPS2 at p22 (right, control). The GO results for clusters 5 and 9 are shown in (i), and those for clusters 1 and 2 are shown in (j).
Figure 4
Figure 4
Histological evaluation and RNA-seq analysis of teratomas from hiPSCs with and without CNV gain at 20q11.21. (a) Summary of the tissue types recorded for individual teratoma samples. (b,c) H&E stained representative images of histological features of hFSiPS3 (b) and hFSiPS1 (c) are shown. (hFSiPS3-1a~b) Note the relatively well-differentiated tissues with three different origins showing gut (gt), cartilage (c), adipocytes (a), smooth muscle (sm), nerve tissue (n), and (r). (hFSiPS1-1a~b) A few tissue types were evident, including duct-like structures (d) and cartilage (c). Magnification, × 40 for all. Expression of ectoderm (d), endoderm (e), mesoderm (f), and extraembryonic (g), specific signatures of teratomas are shown. Yellow, green, and blue bars indicate the log2-fold changes of group A, group B, and group C, respectively. Samples in group A are only included teratomas from one hiPSC line (hFSiPS3) with or without the CNV gain. Samples in group B are included teratomas from one normal hiPSC line (hFSiPS3) and abnormal hiPSC line (hFmiPS2). These three cell lines are originated from the same fibroblast. We pooled all RNAseq data of teratomas from normal and abnormal cell lines to exclude line variation and compare non-isogenic cell lines. Detailed information for the three groups is described in Supplementary Table S8. *Indicates significance of the DEGs under adjusted p-value < 0.05. C/PNS indicates the central or peripheral nervous system. (dg) Expression of lineage-specific signatures of teratomas.

References

    1. Thomson JA, et al. Embryonic stem cell lines derived from human blastocysts. Science. 1998;282:1145–1147. doi: 10.1126/science.282.5391.1145. - DOI - PubMed
    1. Zhu H, Lensch MW, Cahan P, Daley GQ. Investigating monogenic and complex diseases with pluripotent stem cells. Nat. Rev. Genet. 2011;12:266–275. doi: 10.1038/nrg2951. - DOI - PubMed
    1. Maitra A, et al. Genomic alterations in cultured human embryonic stem cells. Nat. Genet. 2005;37:1099–1103. doi: 10.1038/ng1631. - DOI - PubMed
    1. Yoshihara M, et al. Hotspots of de novo point mutations in induced pluripotent stem cells. Cell Rep. 2017;21:308–315. doi: 10.1016/j.celrep.2017.09.060. - DOI - PubMed
    1. Panopoulos AD, et al. iPSCORE: A resource of 222 iPSC lines enabling functional characterization of genetic variation across a variety of cell types. Stem Cell Rep. 2017;8:1086–1100. doi: 10.1016/j.stemcr.2017.03.012. - DOI - PMC - PubMed

Publication types

MeSH terms

Substances