. 2020 Oct 29;10(1):18547.
doi: 10.1038/s41598-020-75560-1.

Empirical comparison of analytical approaches for identifying molecular HIV-1 clusters

Affiliations

Empirical comparison of analytical approaches for identifying molecular HIV-1 clusters

Vlad Novitsky et al. Sci Rep. .

Abstract

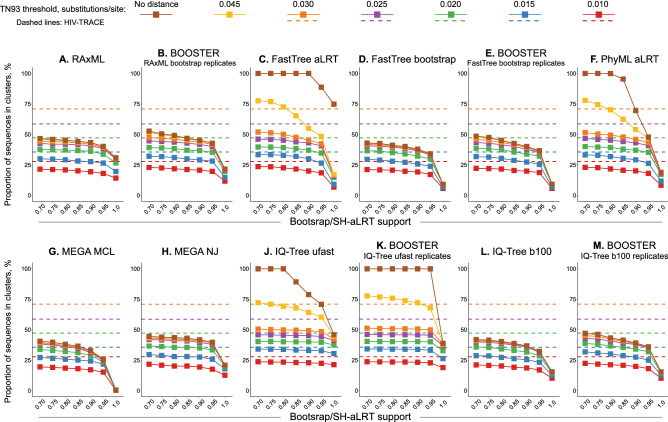
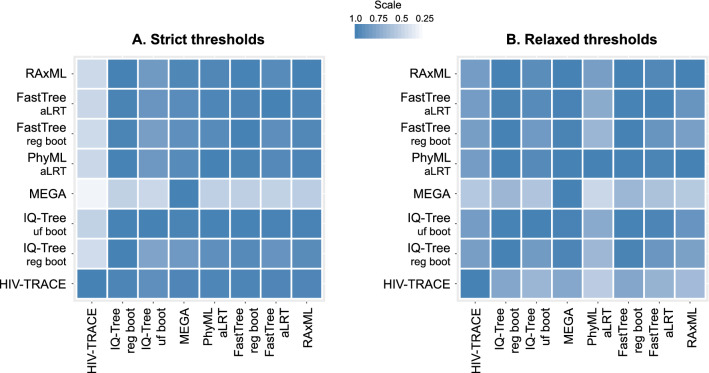
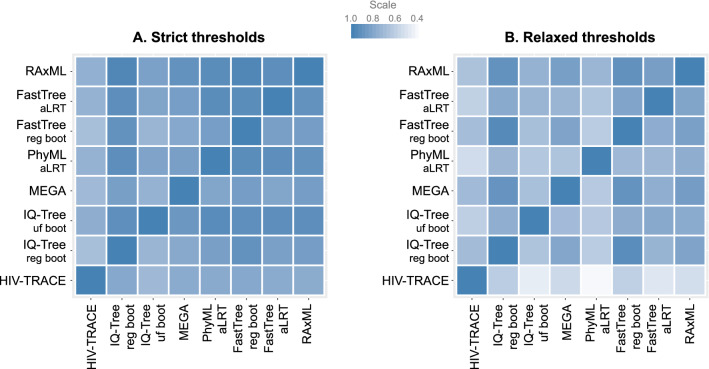
Public health interventions guided by clustering of HIV-1 molecular sequences may be impacted by choices of analytical approaches. We identified commonly-used clustering analytical approaches, applied them to 1886 HIV-1 Rhode Island sequences from 2004-2018, and compared concordance in identifying molecular HIV-1 clusters within and between approaches. We used strict (topological support ≥ 0.95; distance 0.015 substitutions/site) and relaxed (topological support 0.80-0.95; distance 0.030-0.045 substitutions/site) thresholds to reflect different epidemiological scenarios. We found that clustering differed by method and threshold and depended more on distance than topological support thresholds. Clustering concordance analyses demonstrated some differences across analytical approaches, with RAxML having the highest (91%) mean summary percent concordance when strict thresholds were applied, and three (RAxML-, FastTree regular bootstrap- and IQ-Tree regular bootstrap-based) analytical approaches having the highest (86%) mean summary percent concordance when relaxed thresholds were applied. We conclude that different analytical approaches can yield diverse HIV-1 clustering outcomes and may need to be differentially used in diverse public health scenarios. Recognizing the variability and limitations of commonly-used methods in cluster identification is important for guiding clustering-triggered interventions to disrupt new transmissions and end the HIV epidemic.


Conflict of interest statement

MH reports fees from Competition Economics and The Miriam Hospital for consulting, outside the submitted work. All other authors declare that they have no competing interests.

Figures

Figure 1
Figure 1
Comparison of proportion of HIV-1 sequences in clusters within commonly-used analytical approaches. Graphs A-M each represent the 12 model-based methods/variations examined. Solid lines in each graph represent the range of proportions of clustered sequences (Y axis) according to topological support (X axis) and distance thresholds (colored squares (legend at the top of the Figure), matching the line colors). Color-matching dashed lines in each graph represent the range of proportions of clustered sequences identified by HIV-TRACE according to five distance thresholds (see text for details).
Figure 2
Figure 2
Comparison of proportion of HIV-1 sequences in clusters between commonly-used analytical approaches. Each of the 49 panels demonstrates proportions of HIV sequences in clusters (Y axis) identified by the 12 selected methods (X axis; also represented by colors and outlined in the legend above the panels), representing a distinct combination of topological support (outlined in the gray line above the panels) and distance thresholds (outlined in the gray line to the right of the panels); see text for more details.
Figure 3
Figure 3
Differences of proportions of clustered HIV-1 sequences between method-pairs. The graph represents differences in proportions of clustered HIV-1 sequences (Y axis; shown with 95% CI) that were identified by pairs of the seven methods (X axis). Differences are ranked from left to right in descending order of absolute values, according to relaxed (red squares) and strict (green squares) thresholds. The red dashed line outlines a proportion difference of zero. Positive or negative differences in proportions depend on the directionality of the comparison between each methods-pair; see text for more details.
Figure 4
Figure 4
Concordance of HIV-1 clustering: proportion of sequence pairs clustered by method-pairs. In these asymmetric heatmaps, each of the 64 small squares in each panel represents the proportion of sequence pairs that were clustered together in one of the eight methods examined (listed at the bottom of the heatmap), and also in the second paired method (listed on the left of the heatmap). For example, the 3rd square from the left in the top row shows proportion of sequence pairs that clustered together by IQ-Tree ultra-fast bootstrap that also clustered together by RAxML; with the denominator being the proportion of clustered sequence pairs in IQ-Tree ultra-fast bootstrap analysis). The squares on the diagonal line from bottom left to upper right of each panel show concordance between the same methods, which is always 100%. Panel A demonstrates analyses according to strict thresholds and panel B according to relaxed thresholds (for more methods and thresholds details see text and Table 1). The scale of proportions for both panels is also shown.
Figure 5
Figure 5
Concordance of HIV-1 clustering: proportion of identical clusters in method-pairs. In these asymmetric heatmaps, each of the 64 small squares in each panel represents the proportion of identical clusters that were identified in one of the eight methods examined (listed at the bottom of the heatmap), and also in the second paired method (listed on the left of the heatmap). The squares on the diagonal line from bottom left to upper right of each panel show concordance between the same methods, which is always 100%. Panel A demonstrates analyses according to strict thresholds and panel B according to relaxed thresholds (for more methods and thresholds details see text and Table 1). The scale of proportions for both panels is also shown.
Figure 6
Figure 6
Concordance of HIV-1 clustering: proportion of sequences not clustered by method-pairs. In these asymmetric heatmaps each of the 64 small squares in each panel represents the proportion of non-clustered sequences that were identified in one of the eight methods examined (listed at the bottom of the heatmap), and also in the second paired method (listed on the left of the heatmap). The squares on the diagonal line from bottom left to upper right of each panel show concordance between the same methods, which is always 100%. Panel A demonstrates analyses according to strict thresholds and panel B according to relaxed thresholds (for more methods and thresholds details see text and Table 1). The Scale of proportions for both panels is also shown.

References

    1. UNAIDS. Global HIV and AIDS statistics—2019 fact sheet. https://www.unaids.org/en/resources/fact-sheet (2019).
    1. 2CDC. Detecting and responding to HIV transmission clusters. A guide for health departments. https://www.cdc.gov/hiv/pdf/funding/announcements/ps18-1802/CDC-HIV-PS18... (2018).
    1. Peters PJ, et al. HIV infection linked to injection use of oxymorphone in Indiana, 2014–2015. N. Engl. J. Med. 2016;375:229–239. doi: 10.1056/NEJMoa1515195. - DOI - PubMed
    1. Wertheim JO, Chato C, Poon AFY. Comparative analysis of HIV sequences in real time for public health. Curr. Opin. HIV AIDS. 2019;14:213–220. doi: 10.1097/COH.0000000000000539. - DOI - PubMed
    1. Poon AF, et al. Near real-time monitoring of HIV transmission hotspots from routine HIV genotyping: an implementation case study. Lancet HIV. 2016;3:e231–238. doi: 10.1016/s2352-3018(16)00046-1. - DOI - PMC - PubMed

Publication types