. 2020 Oct 29;10(1):18665.
doi: 10.1038/s41598-020-75618-0.

Serum S100B protein as a marker of severity in Covid-19 patients

Affiliations

Serum S100B protein as a marker of severity in Covid-19 patients

Antonio Aceti et al. Sci Rep. .

Abstract

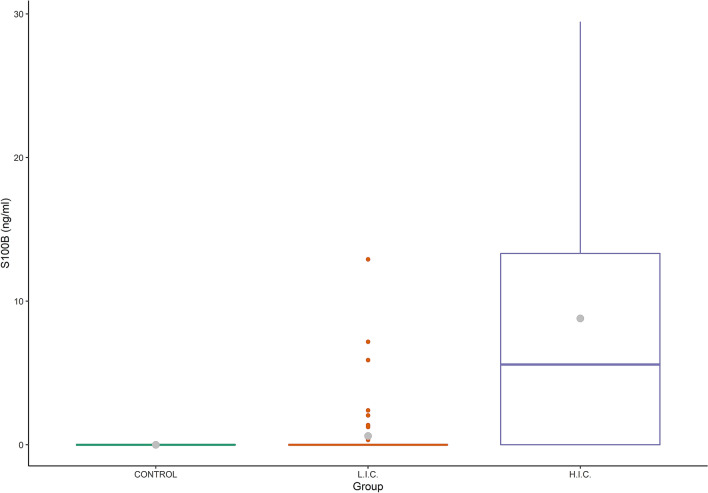
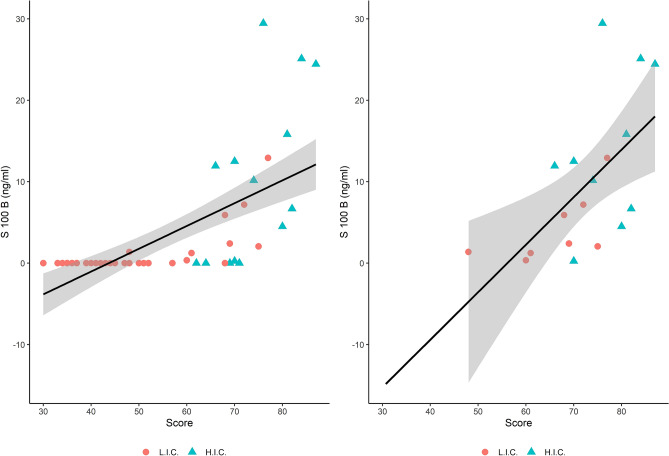
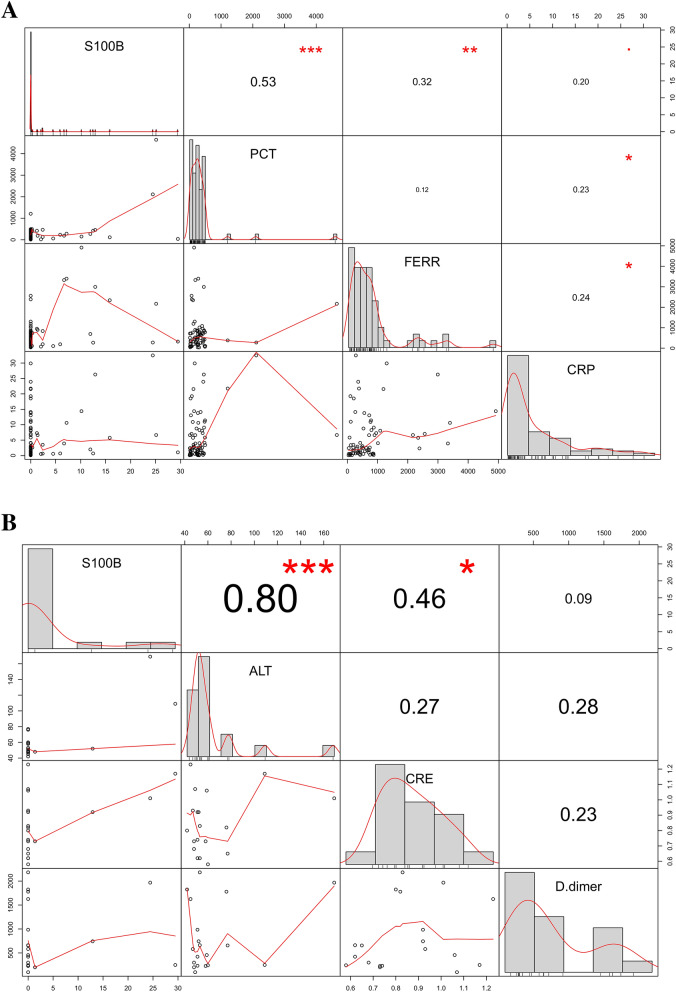
SARS-CoV-2 infection shows a wide-ranging clinical severity, requiring prognostic markers. We focused on S100B, a calcium-binding protein present in biological fluids, being a reliable biomarker in disorders having inflammatory processes as common basis and RAGE as main receptor. Since Covid-19 is characterized by a potent inflammatory response also involving RAGE, we tested if S100B serum levels were related to disease severity. Serum samples (n = 74) were collected from hospitalized SARS-CoV-2 positive patients admitted to Covid center. Illness severity was established by admission clinical criteria and Covid risk score. Treatment protocols followed WHO guidelines available at the time. Circulating S100B was determined by ELISA assay. Statistical analysis used Pearson's χ2 test, t-Test, and ANOVA, ANCOVA, Linear Regression. S100B was detected in serum from Covid-19 patients, significantly correlating with disease severity as shown both by the level of intensity of care (p < 0.006) as well by the value of Covid score (Multiple R-squared: 0.3751); the correlation between Covid-Score and S100B was 0.61 (p < 0.01). S100B concentration was associated with inflammation markers (Ferritin, C-Reactive Protein, Procalcitonin), and organ damage markers (Alanine Aminotransferase, Creatinine). Serum S100B plays a role in Covid-19 and can represent a marker of clinical severity in Sars-CoV-2 infected patients.


Conflict of interest statement

The authors declare no competing interests.

Figures

Figure 1
Figure 1
Detection of S100B in Covid patients and controls. Box plot showing the distribution of S100B in Covid (n = 74) patients with different clinical severity of disease. Also data from controls (n = 5 healthy individuals: negative for SARS-CoV-2 detection by PCR and negative by serologic test) are included. Grey dot: mean value, Line: median value; HIC: High Intensity Care; LIC: Low Intensity Care.
Figure 2
Figure 2
Relationship between Covid-Score and concentration of S100B. The scatterplot shows a positive correlation between S100B concentration (ng/mL) and clinical severity of the disease as represented by Covid-score. Analysis considering all samples (A) or only those with S100B detected in serum (B), from both HIC and LIC wards. Most of the samples with a concentration of S100B below the LOD belongs to the group hospitalized in the LIC wards (A). When considering only patients with S100B over the LOD and from both wards (B), the regression equation was Y = 0.584X−32.778. Figure A is reported as a comparison respect to figure B to highlight the distribution of S100B levels below the LOD and the independent linear regression curves are reported in supplementary materials (S1). The hospitalization ward is indicated for each patient (Red Dots: Low Intensity Care (LIC); Blue Triangles: High Intensive Care (HIC). The linear regression lines and their confidence intervals (95%) are showed by the gray areas. The correlation between Covid-Score and S100B is equal to 0.66 (p < 0.001) (A) and 0.61 (p < 0.01) (B).
Figure 3
Figure 3
Correlation of S100B with other blood markers. (A) Correlation of S100B versus inflammatory markers. S100B significantly correlates with PCT, FERR, CRP. Scatterplots of pairwise variable are shown. Values in the middle of boxes are referred to the Pearson Correlation. PCT: Procalcitonin; FERR: Ferritin, CRP: C-Reactive Protein. Red Stars and dots are referred to the p-values (***p < 0.0001; **p < 0.001; *p < 0.01; +p < 0.1). (B) Correlation of S100B versus Organ Damage markers. S100B significantly correlates with ALT and CRE (subgroup of patients showing ALT > 40 IU/L). Scatterplots of pairwise variable are shown. Values in the middle of boxes are referred to the Pearson Correlation. ALT: Alanine Aminotransferase; CRE: Creatinine; d-Dimer: d-Dimer. Values in the middle of boxes are referred to the Pearson Correlation. Red Stars and dots are referred to the p values (***p < 0.0001; **p < 0.001; *p < 0.01; +p < 0.1).

References

    1. WHO. Clinical management of severe acute respiratory infection (SARI) when COVID-19 disease is suspected: interim guidance, 13 March 2020 [Online]. Available from: https://apps.who.int/iris/handle/10665/331446. Accessed 24 March 2002.
    1. Guan W, et al. Clinical characteristics of coronavirus disease 2019 in China. N Engl J Med. 2020;382:1708–1720. doi: 10.1056/NEJMoa2002032. - DOI - PMC - PubMed
    1. Zhao, D. et al. A comparative study on the clinical features of Coronavirus 2019 (COVID-19) pneumonia with other pneumonias. Clin. Infect. Dis. 2020 Mar 12. 10.1093/cid/ciaa247 [Epub ahead of print]. - PMC - PubMed
    1. Galloway JB, Norton S, Barker RD, Brookes A, Carey I, et al. A clinical risk score to identify patients with COVID-19 at high risk of critical care admission or death: an observational cohort study. J. Infect. 2020;81:282–288. doi: 10.1016/j.jinf.2020.05.064. - DOI - PMC - PubMed
    1. Xiao L, et al. Development and validation of the HNC-LL score for predicting the severity of coronavirus disease 2019. EBioMedicine. 2020;57:102880. doi: 10.1016/j.ebiom.2020.102880. - DOI - PMC - PubMed

Publication types

Substances