. 2020 Oct 22:15:8121-8130.
doi: 10.2147/IJN.S272500. eCollection 2020.

Selective Detection of Nano-Sized Diagnostic Markers Using Au-ZnO Nanorod-Based Surface-Enhanced Raman Spectroscopy (SERS) in Ureteral Obstruction Models

Affiliations

Selective Detection of Nano-Sized Diagnostic Markers Using Au-ZnO Nanorod-Based Surface-Enhanced Raman Spectroscopy (SERS) in Ureteral Obstruction Models

Sanghwa Lee et al. Int J Nanomedicine. .

Abstract

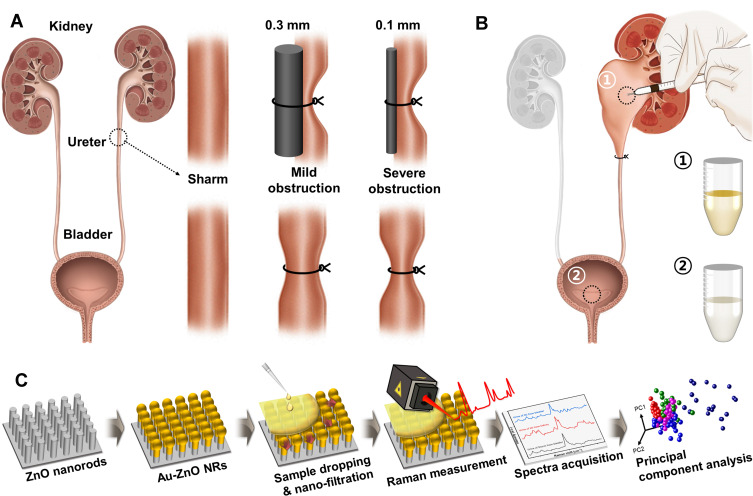
Background: This study investigated the diagnosis of renal diseases using a biochip capable of detecting nano-sized biomarkers. Raman measurements from a kidney injury model were taken, and the feasibility of early diagnosis was assessed.

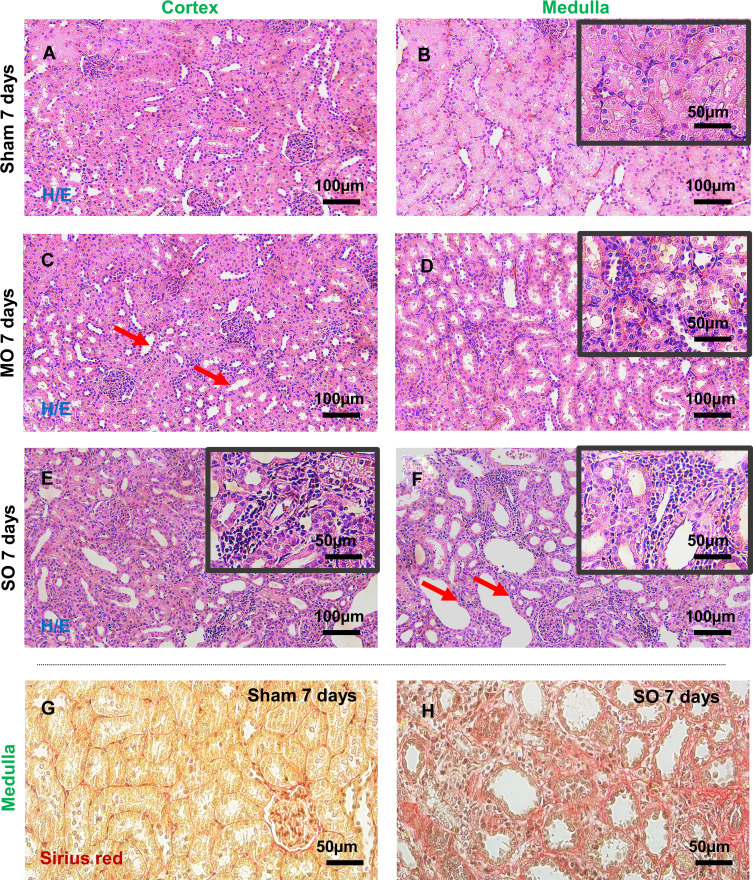
Materials and methods: Rat models with mild and severe unilateral ureteral obstructions were created, with the injury to the kidney varying according to the tightness of the stricture. After generating the animal ureteral obstruction models, urine was collected from the kidney and bladder.

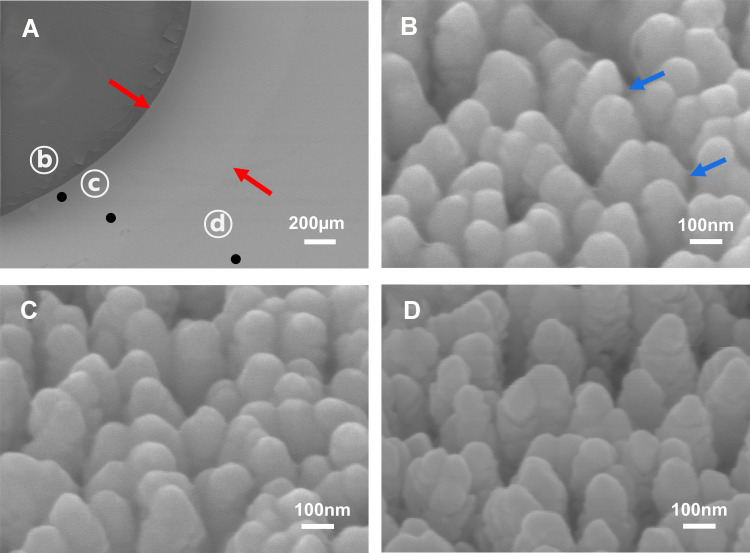
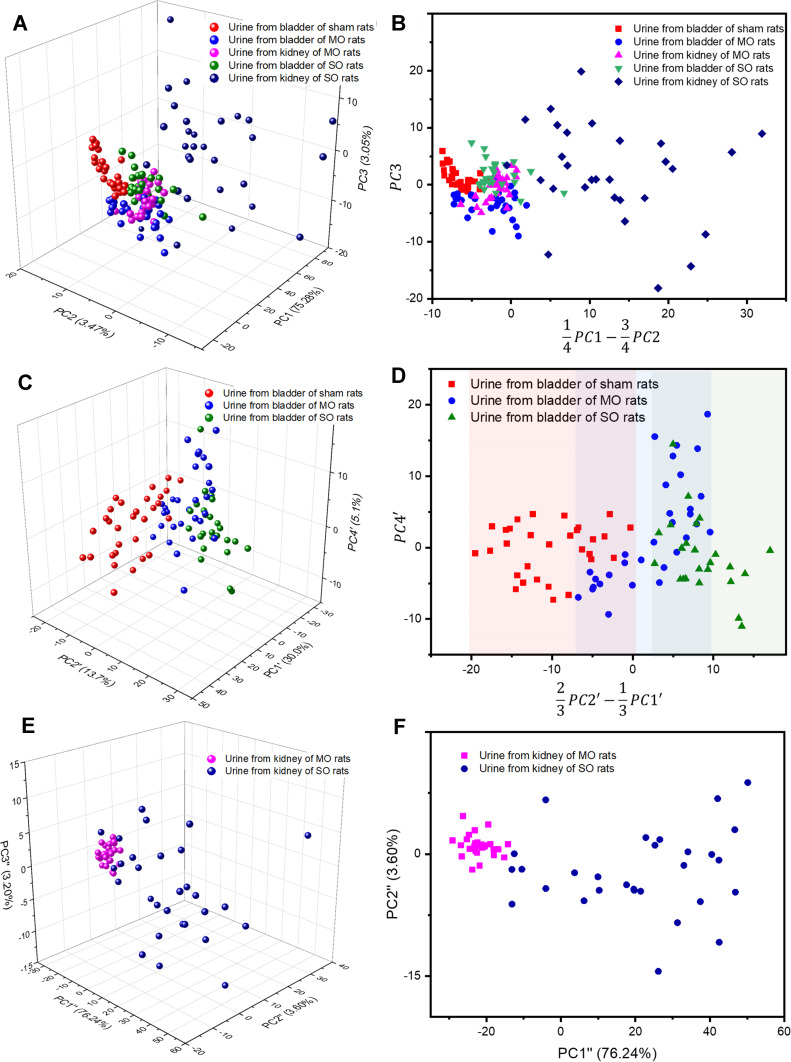
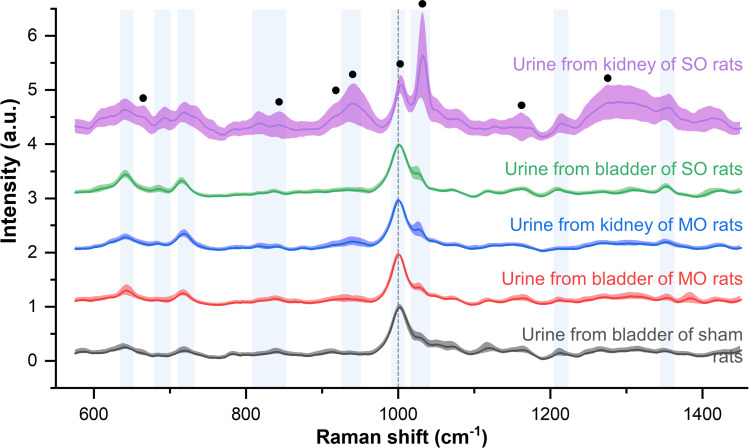
Results and discussion: After confirming the presence of renal injury, urine drops were placed onto a Raman chip whose surface had been enhanced with Au-ZnO nanorods, allowing nano-sized biomarkers that diffused into the nanogaps to be selectively amplified. The Raman signals varied according to the severity of the renal damage, and these differences were statistically confirmed.

Conclusion: These results confirm that ureteral stricture causes kidney injury and that signals in the urine from the release of nano-biomarkers can be monitored using surface-enhanced Raman spectroscopy.

Keywords: ZnO nanorods; nano-sized biomarker; principal component analysis; renal injury; surface-enhanced Raman spectroscopy; ureteral obstruction.


Conflict of interest statement

The authors declare no competing financial interests and no conflicts of interest for this work.

Figures

Scheme 1
Scheme 1
Schematic illustration of the overall experimental process. (A) The ligations were made using splint wires with diameters of 0.3 and 0.1 mm for mild and severe ureteral stenosis models, respectively, with the splint wires then removed to allow partial flow. (B) Urine samples are taken from the kidney (①) and bladder (②) after ureteral ligation. (C) Fabrication of a surface-enhanced Raman chip using ZnO nanorods and the process for the Raman signal acquisition and subsequent statistical analysis.
Figure 1
Figure 1
Histopathological evaluation of rat kidney tissue. Hematoxylin/eosin (H&E) staining illustrates the tubulointerstitial histological differences in the kidneys of the (C and D) MO and (E and F) SO experimental groups compared with (A and B) the sham-operated (control) group. Tubular cell injury, including mild and severe dilation of collection tubules, is marked with red arrows, while the presence of inflammatory cell infiltrates is shown in the magnified black boxes. The red area in the Sirius red stained images for the (G) sham and (H) SO groups indicates extracellular matrix accumulation in the tubular basement membrane.
Figure 2
Figure 2
FE-SEM images of urine drops on the SERS substrate. (A) Magnified SEM image illustrating three points: (B) the dried droplet interface, (C) the diffused area (between the red arrows), and (D) the bare SERS area. The 100,000 × magnified images (B–D) correspond to the points in (A).
Figure 3
Figure 3
Principal component analysis (PCA) of (A and B) all obstruction and sham urine samples (C and D) bladder samples only, and (E and F) kidney samples only.
Figure 4
Figure 4
Averaged Raman spectra from urine samples from the severe obstruction model (purple and green lines), the mild obstruction model (blue and red lines), and the control procedure (red line). The standard deviation is represented by the shaded areas around the solid lines. The black dots indicate the collagen assignment peaks.

References

    1. Zhou RS, Han CH, Hao L, et al. Ureteroscopic lithotripsy in the Trendelenburg position for extracting obstructive upper ureteral obstruction stones: a prospective, randomized, comparative trial. Scand J Urol. 2018;52(4):291–295. doi:10.1080/21681805.2018.1492966 - DOI - PubMed
    1. Kim DW, Yoon SK, Ha DH, Kang MJ, Lee JH, Choi S. CT-based assessment of renal function impairment in patients with acute unilateral ureteral obstruction by urinary stones. Abdom Imaging. 2015;40(7):2446–2452. doi:10.1007/s00261-015-0417-9 - DOI - PubMed
    1. Ingraham SE, McHugh KM. Current perspectives on congenital obstructive nephropathy. Pediatr Nephrol. 2011;26(9):1453–1461. doi:10.1007/s00467-011-1799-8 - DOI - PubMed
    1. Weitz M, Schmidt M, Laube G. Primary non-surgical management of unilateral ureteropelvic junction obstruction in children: a systematic review. Pediatr Nephrol. 2017;32(12):2203–2213. doi:10.1007/s00467-016-3566-3 - DOI - PubMed
    1. El-Ghar ME, Shokeir AA, El-Diasty TA, Refaie HF, Gad HM, El-Dein AB. Contrast enhanced spiral computerized tomography in patients with chronic obstructive uropathy and normal serum creatinine: a single session for anatomical and functional assessment. J Urol. 2004;172(3):985–988. doi:10.1097/01.ju.0000135368.77589.7c - DOI - PubMed

MeSH terms