

To Develop and Validate the Combination of RNA Methylation Regulators for the Prognosis of Patients with Gastric Cancer
- PMID: 33122917
- PMCID: PMC7591098
- DOI: 10.2147/OTT.S276239
To Develop and Validate the Combination of RNA Methylation Regulators for the Prognosis of Patients with Gastric Cancer
Abstract
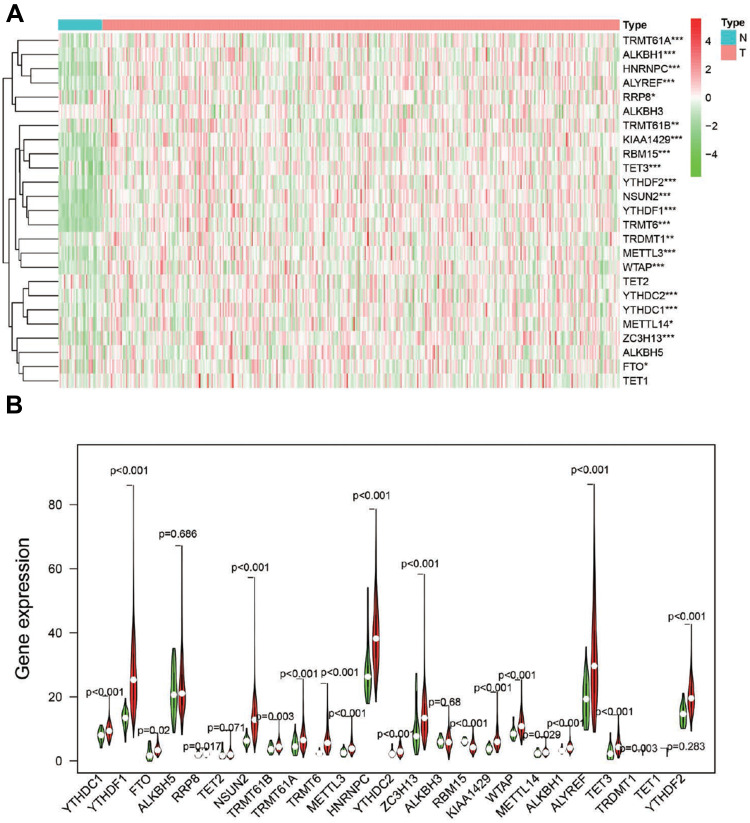
Background: Gastric cancer (GC) accounts for high mortality. RNA methylation has recently gained interest as markers in specific tumors. This study aimed to uncover the function of the roles of 25 RNA methylation regulators in GC.
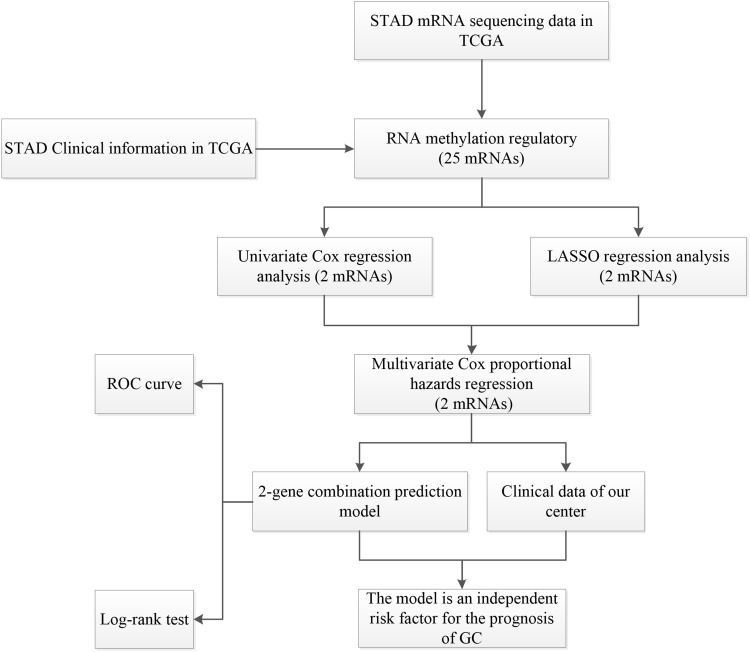
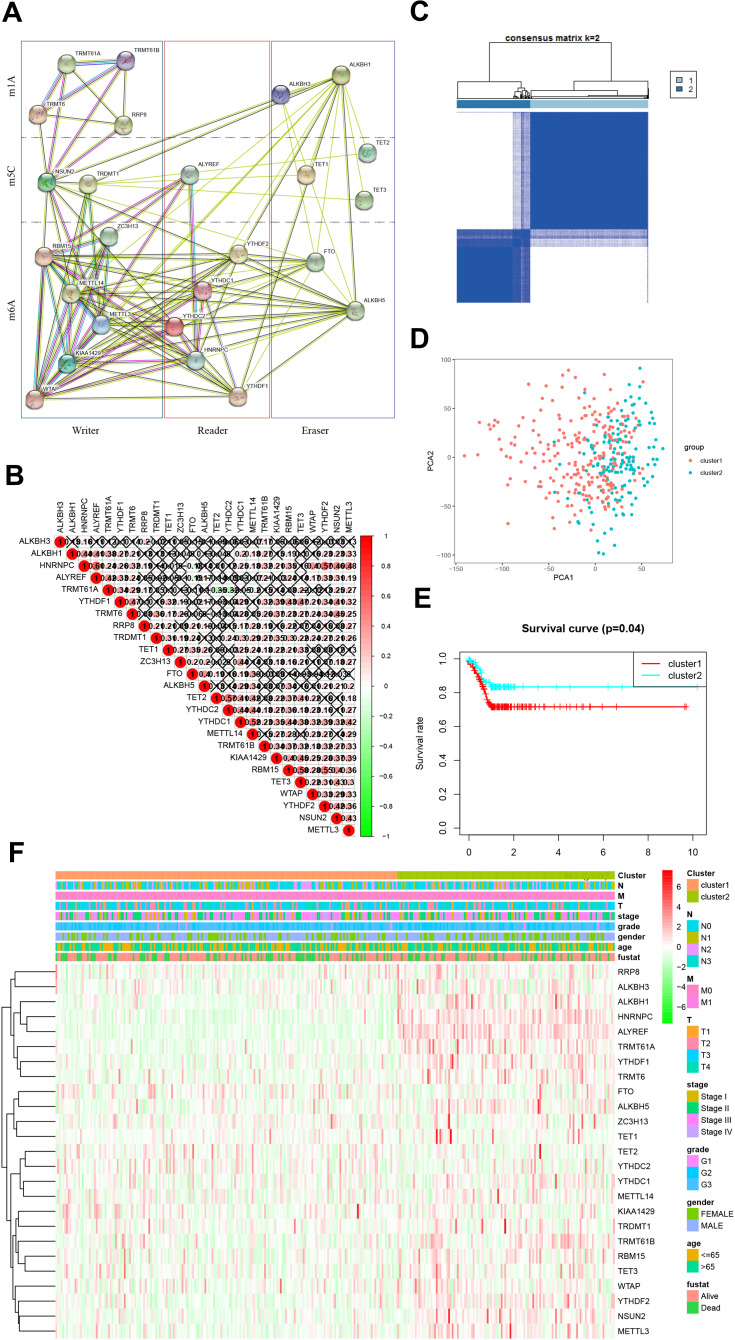
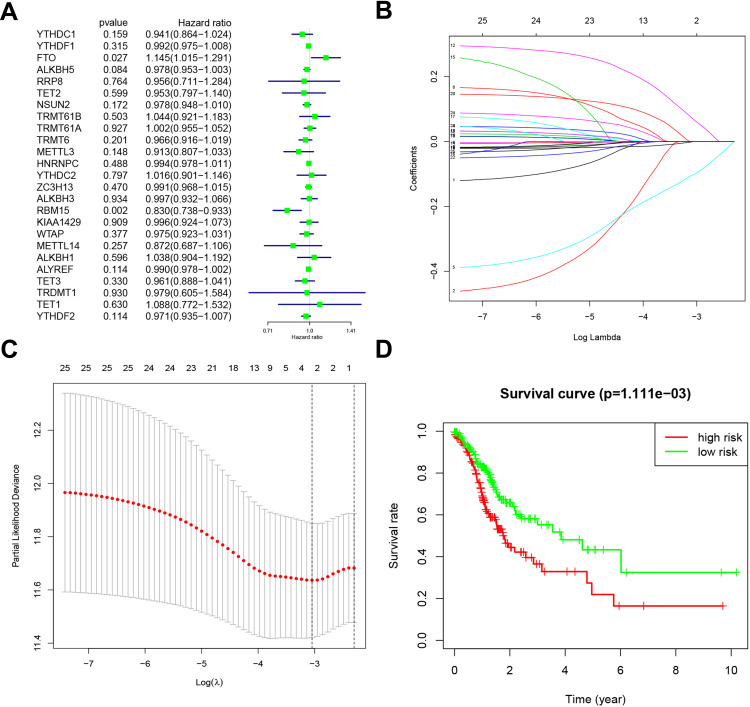
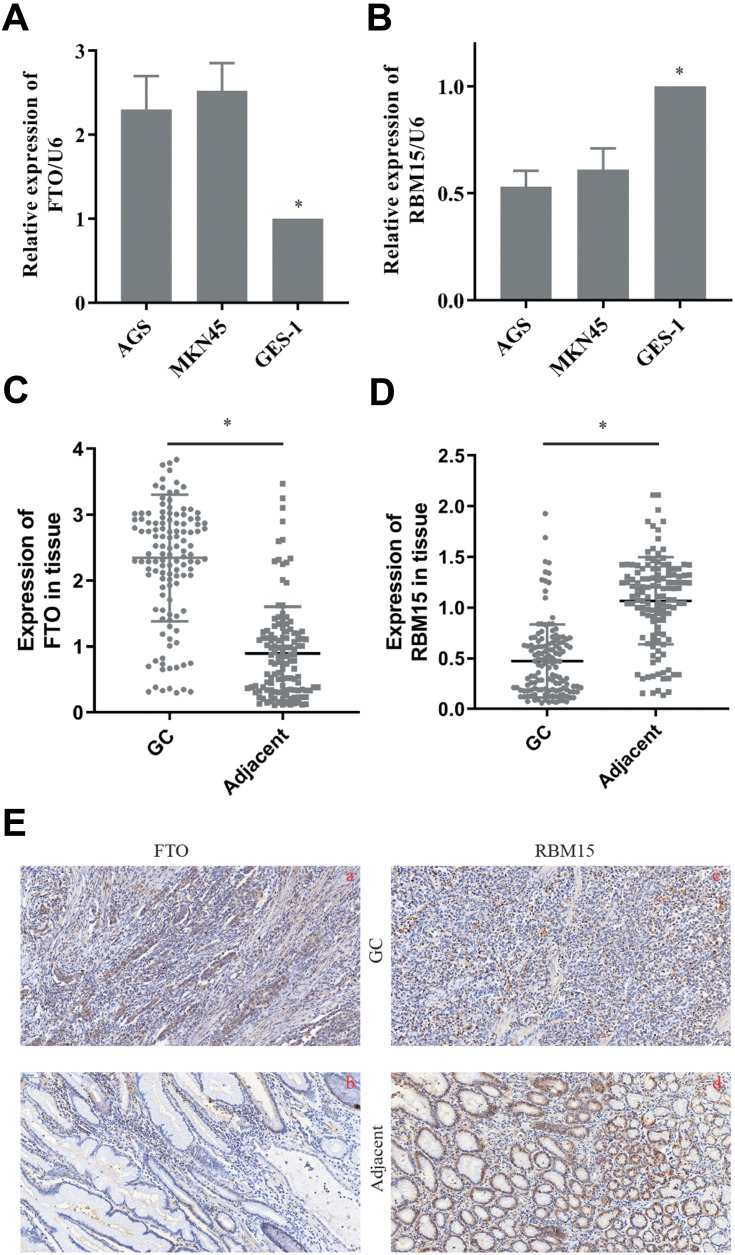
Methods: RNA sequence and clinical data were downloaded from The Cancer Genome Atlas (TCGA) database. "STRING" and R were performed to analyze the correlation among the methylase. COX and LASSO were performed to screen for prognostic associated RNA methylation regulators. A prognostic model was established based on the expression of methylase. RT-PCR and immunohistochemistry detected the expression of methylase in GC cells and tissue. Kaplan-Meier curve and Cox analysis were applied to evaluate the effectiveness of the model.
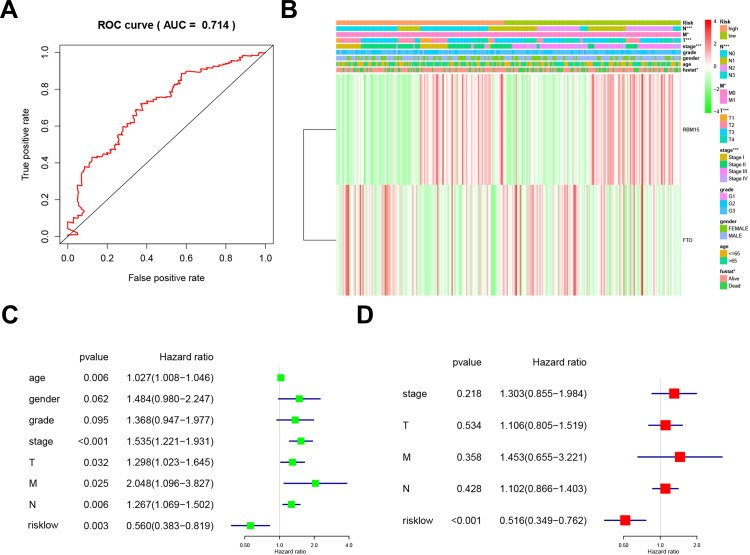
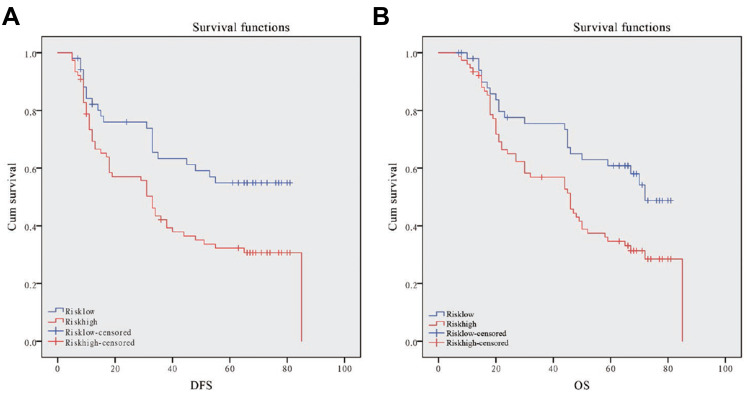
Results: The prediction model was established based on the expression of m6A RNA methylation regulators FTO (fat mass and obesity-associated) and RBM15 (RNA binding motif protein 15). Based on the model, GC patients were divided into "high risk" and "low risk" groups to compare the differences in survival. The model was re-evaluated with the clinical data of our center.
Conclusion: The two-methylase combination model was an independent prognostic factor of GC.
Keywords: RNA methylation; gastric cancer; least absolute shrinkage and selection operator; prognosis; survival analysis.
© 2020 Zhang et al.
Conflict of interest statement
No potential conflicts of interest were disclosed by the authors for this work.
Figures
Similar articles
-
Risk Score Prediction Model of Prognosis in GC Patients by Age and Gender Combined With m6A Modification Genes FTO and RBM15.Front Cell Dev Biol. 2022 Mar 31;10:710708. doi: 10.3389/fcell.2022.710708. eCollection 2022. Front Cell Dev Biol. 2022. PMID: 35433701 Free PMC article.
-
Differential analysis of RNA methylation regulators in gastric cancer based on TCGA data set and construction of a prognostic model.J Gastrointest Oncol. 2021 Aug;12(4):1384-1397. doi: 10.21037/jgo-21-325. J Gastrointest Oncol. 2021. PMID: 34532096 Free PMC article.
-
Identification of m6A-related genes and m6A RNA methylation regulators in pancreatic cancer and their association with survival.Ann Transl Med. 2020 Mar;8(6):387. doi: 10.21037/atm.2020.03.98. Ann Transl Med. 2020. PMID: 32355831 Free PMC article.
-
Expression Status And Prognostic Value Of M6A-associated Genes in Gastric Cancer.J Cancer. 2020 Mar 4;11(10):3027-3040. doi: 10.7150/jca.40866. eCollection 2020. J Cancer. 2020. PMID: 32226518 Free PMC article.
-
Expression patterns and prognostic role of m6A RNA methylation regulators in Non-small Cell Lung Cancer.Cell Mol Biol (Noisy-le-grand). 2024 Feb 29;70(2):67-72. doi: 10.14715/cmb/2024.70.2.11. Cell Mol Biol (Noisy-le-grand). 2024. PMID: 38430042
Cited by
-
Construction of a survival nomogram for gastric cancer based on the cancer genome atlas of m6A-related genes.Front Genet. 2022 Aug 5;13:936658. doi: 10.3389/fgene.2022.936658. eCollection 2022. Front Genet. 2022. PMID: 35991573 Free PMC article.
-
Emerging Roles of N6-Methyladenosine Demethylases and Its Interaction with Environmental Toxicants in Digestive System Cancers.Cancer Manag Res. 2021 Sep 9;13:7101-7114. doi: 10.2147/CMAR.S328188. eCollection 2021. Cancer Manag Res. 2021. PMID: 34526822 Free PMC article. Review.
-
Depicting the Profile of METTL3-Mediated lncRNA m6A Modification Variants and Identified SNHG7 as a Prognostic Indicator of MNNG-Induced Gastric Cancer.Toxics. 2023 Nov 20;11(11):944. doi: 10.3390/toxics11110944. Toxics. 2023. PMID: 37999596 Free PMC article.
-
The RNA-Binding Motif Protein Family in Cancer: Friend or Foe?Front Oncol. 2021 Nov 4;11:757135. doi: 10.3389/fonc.2021.757135. eCollection 2021. Front Oncol. 2021. PMID: 34804951 Free PMC article. Review.
-
Risk Score Prediction Model of Prognosis in GC Patients by Age and Gender Combined With m6A Modification Genes FTO and RBM15.Front Cell Dev Biol. 2022 Mar 31;10:710708. doi: 10.3389/fcell.2022.710708. eCollection 2022. Front Cell Dev Biol. 2022. PMID: 35433701 Free PMC article.
References
LinkOut - more resources
Full Text Sources
Miscellaneous
